Free Statistics

of Irreproducible Research!

Author's title

Author*The author of this computation has been verified*
R Software Modulerwasp_arimaforecasting.wasp
Title produced by softwareARIMA Forecasting
Date of computationThu, 29 Nov 2012 08:40:00 -0500
Cite this page as followsStatistical Computations at FreeStatistics.org, Office for Research Development and Education, URL https://freestatistics.org/blog/index.php?v=date/2012/Nov/29/t1354196434dt5ktvn8mz602zl.htm/, Retrieved Sun, 28 Apr 2024 00:26:21 +0000
Statistical Computations at FreeStatistics.org, Office for Research Development and Education, URL https://freestatistics.org/blog/index.php?pk=194581, Retrieved Sun, 28 Apr 2024 00:26:21 +0000
QR Codes:

Original text written by user:
IsPrivate?No (this computation is public)
User-defined keywords
Estimated Impact76
Family? (F = Feedback message, R = changed R code, M = changed R Module, P = changed Parameters, D = changed Data)
-       [ARIMA Forecasting] [ARIMA forecasting...] [2012-11-29 13:40:00] [64435dfec13c3cda39d1733fd4b6eb52] [Current]
Feedback Forum

Post a new message
Dataseries X:
54.3
55.9
63.9
64
60.7
67.8
70.5
76.6
76.2
71.8
67.8
69.7
76.7
74.2
75.8
84.3
84.9
84.4
89.4
88.5
76.5
71.4
72.1
75.8
66.6
71.7
75.4
80.9
80.7
85
91.5
87.7
95.3
102.4
114.2
111.7
113.7
118.8
129
136.4
155
166
168.7
145.5
127.3
91.5
69
54
56.3
54.2
59.3
63.4
73.3
86.7
81.3
89.6
85.3
92.4
96.8
93.6
97.6
94.2
99.9
106.4
96
94.9
94.8
95.9
96.2
103.1
106.9
114.2
118.2
123.9
137.1
146.2
136.4
133.2
135.9
127.1
128.5
126.6
132.6
130.9


Summary of computational transaction
Raw Inputview raw input (R code)
Raw Outputview raw output of R engine
Computing time2 seconds
R Server'Herman Ole Andreas Wold' @ wold.wessa.net

\begin{tabular}{lllllllll}
\hline
Summary of computational transaction \tabularnewline
Raw Input & view raw input (R code)  \tabularnewline
Raw Output & view raw output of R engine  \tabularnewline
Computing time & 2 seconds \tabularnewline
R Server & 'Herman Ole Andreas Wold' @ wold.wessa.net \tabularnewline
\hline
\end{tabular}
%Source: https://freestatistics.org/blog/index.php?pk=194581&T=0

[TABLE]
[ROW][C]Summary of computational transaction[/C][/ROW]
[ROW][C]Raw Input[/C][C]view raw input (R code) [/C][/ROW]
[ROW][C]Raw Output[/C][C]view raw output of R engine [/C][/ROW]
[ROW][C]Computing time[/C][C]2 seconds[/C][/ROW]
[ROW][C]R Server[/C][C]'Herman Ole Andreas Wold' @ wold.wessa.net[/C][/ROW]
[/TABLE]
Source: https://freestatistics.org/blog/index.php?pk=194581&T=0

Globally Unique Identifier (entire table): ba.freestatistics.org/blog/index.php?pk=194581&T=0

As an alternative you can also use a QR Code:  

The GUIDs for individual cells are displayed in the table below:

Summary of computational transaction
Raw Inputview raw input (R code)
Raw Outputview raw output of R engine
Computing time2 seconds
R Server'Herman Ole Andreas Wold' @ wold.wessa.net


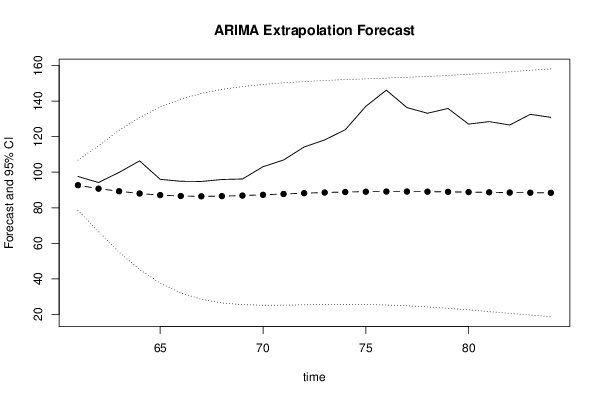
Univariate ARIMA Extrapolation Forecast
timeY[t]F[t]95% LB95% UBp-value(H0: Y[t] = F[t])P(F[t]>Y[t-1])P(F[t]>Y[t-s])P(F[t]>Y[60])
4854-------
4956.3-------
5054.2-------
5159.3-------
5263.4-------
5373.3-------
5486.7-------
5581.3-------
5689.6-------
5785.3-------
5892.4-------
5996.8-------
6093.6-------
6197.692.688378.5129106.86370.24850.449810.4498
6294.290.737966.5901114.88570.38940.28880.99850.4081
6399.989.29855.0114123.58460.27220.38970.95680.4029
64106.488.006845.2014130.81210.19980.2930.87010.3989
659687.126637.5345136.71870.36290.22310.70760.399
6694.986.602832.0427141.1630.38280.36780.49860.4008
6794.886.43128.4757144.38620.38860.38730.56890.4042
6895.986.538526.4238146.65310.38010.39380.46020.409
6996.286.849225.4426148.25580.38270.38630.51970.4147
70103.187.278125.1282149.42810.30890.38920.43580.421
71106.987.748625.1658150.33140.27430.31530.38840.4273
72114.288.196925.3359151.05790.20870.27990.43310.4331
73118.288.577425.4988151.6560.17870.2130.38960.438
74123.988.86325.5684152.15770.1390.18180.43440.4417
75137.189.04425.4915152.59640.06920.14120.36890.4441
76146.289.124625.2366153.01270.040.07050.29810.4454
77136.489.119924.7912153.44860.07490.0410.4170.4457
78133.289.050624.1627153.93860.09120.07630.42990.4454
79135.988.940223.378154.50250.08020.09290.43050.4446
80127.188.811122.4792155.1430.12890.08210.4170.4437
81128.588.682421.5159155.84880.12260.13110.41320.4429
82126.688.568620.5369156.60030.13660.1250.33770.4424
83132.688.479219.5832157.37530.10470.13910.30010.4421
84130.988.418518.6833158.15370.11620.10720.23430.4421

\begin{tabular}{lllllllll}
\hline
Univariate ARIMA Extrapolation Forecast \tabularnewline
time & Y[t] & F[t] & 95% LB & 95% UB & p-value(H0: Y[t] = F[t]) & P(F[t]>Y[t-1]) & P(F[t]>Y[t-s]) & P(F[t]>Y[60]) \tabularnewline
48 & 54 & - & - & - & - & - & - & - \tabularnewline
49 & 56.3 & - & - & - & - & - & - & - \tabularnewline
50 & 54.2 & - & - & - & - & - & - & - \tabularnewline
51 & 59.3 & - & - & - & - & - & - & - \tabularnewline
52 & 63.4 & - & - & - & - & - & - & - \tabularnewline
53 & 73.3 & - & - & - & - & - & - & - \tabularnewline
54 & 86.7 & - & - & - & - & - & - & - \tabularnewline
55 & 81.3 & - & - & - & - & - & - & - \tabularnewline
56 & 89.6 & - & - & - & - & - & - & - \tabularnewline
57 & 85.3 & - & - & - & - & - & - & - \tabularnewline
58 & 92.4 & - & - & - & - & - & - & - \tabularnewline
59 & 96.8 & - & - & - & - & - & - & - \tabularnewline
60 & 93.6 & - & - & - & - & - & - & - \tabularnewline
61 & 97.6 & 92.6883 & 78.5129 & 106.8637 & 0.2485 & 0.4498 & 1 & 0.4498 \tabularnewline
62 & 94.2 & 90.7379 & 66.5901 & 114.8857 & 0.3894 & 0.2888 & 0.9985 & 0.4081 \tabularnewline
63 & 99.9 & 89.298 & 55.0114 & 123.5846 & 0.2722 & 0.3897 & 0.9568 & 0.4029 \tabularnewline
64 & 106.4 & 88.0068 & 45.2014 & 130.8121 & 0.1998 & 0.293 & 0.8701 & 0.3989 \tabularnewline
65 & 96 & 87.1266 & 37.5345 & 136.7187 & 0.3629 & 0.2231 & 0.7076 & 0.399 \tabularnewline
66 & 94.9 & 86.6028 & 32.0427 & 141.163 & 0.3828 & 0.3678 & 0.4986 & 0.4008 \tabularnewline
67 & 94.8 & 86.431 & 28.4757 & 144.3862 & 0.3886 & 0.3873 & 0.5689 & 0.4042 \tabularnewline
68 & 95.9 & 86.5385 & 26.4238 & 146.6531 & 0.3801 & 0.3938 & 0.4602 & 0.409 \tabularnewline
69 & 96.2 & 86.8492 & 25.4426 & 148.2558 & 0.3827 & 0.3863 & 0.5197 & 0.4147 \tabularnewline
70 & 103.1 & 87.2781 & 25.1282 & 149.4281 & 0.3089 & 0.3892 & 0.4358 & 0.421 \tabularnewline
71 & 106.9 & 87.7486 & 25.1658 & 150.3314 & 0.2743 & 0.3153 & 0.3884 & 0.4273 \tabularnewline
72 & 114.2 & 88.1969 & 25.3359 & 151.0579 & 0.2087 & 0.2799 & 0.4331 & 0.4331 \tabularnewline
73 & 118.2 & 88.5774 & 25.4988 & 151.656 & 0.1787 & 0.213 & 0.3896 & 0.438 \tabularnewline
74 & 123.9 & 88.863 & 25.5684 & 152.1577 & 0.139 & 0.1818 & 0.4344 & 0.4417 \tabularnewline
75 & 137.1 & 89.044 & 25.4915 & 152.5964 & 0.0692 & 0.1412 & 0.3689 & 0.4441 \tabularnewline
76 & 146.2 & 89.1246 & 25.2366 & 153.0127 & 0.04 & 0.0705 & 0.2981 & 0.4454 \tabularnewline
77 & 136.4 & 89.1199 & 24.7912 & 153.4486 & 0.0749 & 0.041 & 0.417 & 0.4457 \tabularnewline
78 & 133.2 & 89.0506 & 24.1627 & 153.9386 & 0.0912 & 0.0763 & 0.4299 & 0.4454 \tabularnewline
79 & 135.9 & 88.9402 & 23.378 & 154.5025 & 0.0802 & 0.0929 & 0.4305 & 0.4446 \tabularnewline
80 & 127.1 & 88.8111 & 22.4792 & 155.143 & 0.1289 & 0.0821 & 0.417 & 0.4437 \tabularnewline
81 & 128.5 & 88.6824 & 21.5159 & 155.8488 & 0.1226 & 0.1311 & 0.4132 & 0.4429 \tabularnewline
82 & 126.6 & 88.5686 & 20.5369 & 156.6003 & 0.1366 & 0.125 & 0.3377 & 0.4424 \tabularnewline
83 & 132.6 & 88.4792 & 19.5832 & 157.3753 & 0.1047 & 0.1391 & 0.3001 & 0.4421 \tabularnewline
84 & 130.9 & 88.4185 & 18.6833 & 158.1537 & 0.1162 & 0.1072 & 0.2343 & 0.4421 \tabularnewline
\hline
\end{tabular}
%Source: https://freestatistics.org/blog/index.php?pk=194581&T=1

[TABLE]
[ROW][C]Univariate ARIMA Extrapolation Forecast[/C][/ROW]
[ROW][C]time[/C][C]Y[t][/C][C]F[t][/C][C]95% LB[/C][C]95% UB[/C][C]p-value(H0: Y[t] = F[t])[/C][C]P(F[t]>Y[t-1])[/C][C]P(F[t]>Y[t-s])[/C][C]P(F[t]>Y[60])[/C][/ROW]
[ROW][C]48[/C][C]54[/C][C]-[/C][C]-[/C][C]-[/C][C]-[/C][C]-[/C][C]-[/C][C]-[/C][/ROW]
[ROW][C]49[/C][C]56.3[/C][C]-[/C][C]-[/C][C]-[/C][C]-[/C][C]-[/C][C]-[/C][C]-[/C][/ROW]
[ROW][C]50[/C][C]54.2[/C][C]-[/C][C]-[/C][C]-[/C][C]-[/C][C]-[/C][C]-[/C][C]-[/C][/ROW]
[ROW][C]51[/C][C]59.3[/C][C]-[/C][C]-[/C][C]-[/C][C]-[/C][C]-[/C][C]-[/C][C]-[/C][/ROW]
[ROW][C]52[/C][C]63.4[/C][C]-[/C][C]-[/C][C]-[/C][C]-[/C][C]-[/C][C]-[/C][C]-[/C][/ROW]
[ROW][C]53[/C][C]73.3[/C][C]-[/C][C]-[/C][C]-[/C][C]-[/C][C]-[/C][C]-[/C][C]-[/C][/ROW]
[ROW][C]54[/C][C]86.7[/C][C]-[/C][C]-[/C][C]-[/C][C]-[/C][C]-[/C][C]-[/C][C]-[/C][/ROW]
[ROW][C]55[/C][C]81.3[/C][C]-[/C][C]-[/C][C]-[/C][C]-[/C][C]-[/C][C]-[/C][C]-[/C][/ROW]
[ROW][C]56[/C][C]89.6[/C][C]-[/C][C]-[/C][C]-[/C][C]-[/C][C]-[/C][C]-[/C][C]-[/C][/ROW]
[ROW][C]57[/C][C]85.3[/C][C]-[/C][C]-[/C][C]-[/C][C]-[/C][C]-[/C][C]-[/C][C]-[/C][/ROW]
[ROW][C]58[/C][C]92.4[/C][C]-[/C][C]-[/C][C]-[/C][C]-[/C][C]-[/C][C]-[/C][C]-[/C][/ROW]
[ROW][C]59[/C][C]96.8[/C][C]-[/C][C]-[/C][C]-[/C][C]-[/C][C]-[/C][C]-[/C][C]-[/C][/ROW]
[ROW][C]60[/C][C]93.6[/C][C]-[/C][C]-[/C][C]-[/C][C]-[/C][C]-[/C][C]-[/C][C]-[/C][/ROW]
[ROW][C]61[/C][C]97.6[/C][C]92.6883[/C][C]78.5129[/C][C]106.8637[/C][C]0.2485[/C][C]0.4498[/C][C]1[/C][C]0.4498[/C][/ROW]
[ROW][C]62[/C][C]94.2[/C][C]90.7379[/C][C]66.5901[/C][C]114.8857[/C][C]0.3894[/C][C]0.2888[/C][C]0.9985[/C][C]0.4081[/C][/ROW]
[ROW][C]63[/C][C]99.9[/C][C]89.298[/C][C]55.0114[/C][C]123.5846[/C][C]0.2722[/C][C]0.3897[/C][C]0.9568[/C][C]0.4029[/C][/ROW]
[ROW][C]64[/C][C]106.4[/C][C]88.0068[/C][C]45.2014[/C][C]130.8121[/C][C]0.1998[/C][C]0.293[/C][C]0.8701[/C][C]0.3989[/C][/ROW]
[ROW][C]65[/C][C]96[/C][C]87.1266[/C][C]37.5345[/C][C]136.7187[/C][C]0.3629[/C][C]0.2231[/C][C]0.7076[/C][C]0.399[/C][/ROW]
[ROW][C]66[/C][C]94.9[/C][C]86.6028[/C][C]32.0427[/C][C]141.163[/C][C]0.3828[/C][C]0.3678[/C][C]0.4986[/C][C]0.4008[/C][/ROW]
[ROW][C]67[/C][C]94.8[/C][C]86.431[/C][C]28.4757[/C][C]144.3862[/C][C]0.3886[/C][C]0.3873[/C][C]0.5689[/C][C]0.4042[/C][/ROW]
[ROW][C]68[/C][C]95.9[/C][C]86.5385[/C][C]26.4238[/C][C]146.6531[/C][C]0.3801[/C][C]0.3938[/C][C]0.4602[/C][C]0.409[/C][/ROW]
[ROW][C]69[/C][C]96.2[/C][C]86.8492[/C][C]25.4426[/C][C]148.2558[/C][C]0.3827[/C][C]0.3863[/C][C]0.5197[/C][C]0.4147[/C][/ROW]
[ROW][C]70[/C][C]103.1[/C][C]87.2781[/C][C]25.1282[/C][C]149.4281[/C][C]0.3089[/C][C]0.3892[/C][C]0.4358[/C][C]0.421[/C][/ROW]
[ROW][C]71[/C][C]106.9[/C][C]87.7486[/C][C]25.1658[/C][C]150.3314[/C][C]0.2743[/C][C]0.3153[/C][C]0.3884[/C][C]0.4273[/C][/ROW]
[ROW][C]72[/C][C]114.2[/C][C]88.1969[/C][C]25.3359[/C][C]151.0579[/C][C]0.2087[/C][C]0.2799[/C][C]0.4331[/C][C]0.4331[/C][/ROW]
[ROW][C]73[/C][C]118.2[/C][C]88.5774[/C][C]25.4988[/C][C]151.656[/C][C]0.1787[/C][C]0.213[/C][C]0.3896[/C][C]0.438[/C][/ROW]
[ROW][C]74[/C][C]123.9[/C][C]88.863[/C][C]25.5684[/C][C]152.1577[/C][C]0.139[/C][C]0.1818[/C][C]0.4344[/C][C]0.4417[/C][/ROW]
[ROW][C]75[/C][C]137.1[/C][C]89.044[/C][C]25.4915[/C][C]152.5964[/C][C]0.0692[/C][C]0.1412[/C][C]0.3689[/C][C]0.4441[/C][/ROW]
[ROW][C]76[/C][C]146.2[/C][C]89.1246[/C][C]25.2366[/C][C]153.0127[/C][C]0.04[/C][C]0.0705[/C][C]0.2981[/C][C]0.4454[/C][/ROW]
[ROW][C]77[/C][C]136.4[/C][C]89.1199[/C][C]24.7912[/C][C]153.4486[/C][C]0.0749[/C][C]0.041[/C][C]0.417[/C][C]0.4457[/C][/ROW]
[ROW][C]78[/C][C]133.2[/C][C]89.0506[/C][C]24.1627[/C][C]153.9386[/C][C]0.0912[/C][C]0.0763[/C][C]0.4299[/C][C]0.4454[/C][/ROW]
[ROW][C]79[/C][C]135.9[/C][C]88.9402[/C][C]23.378[/C][C]154.5025[/C][C]0.0802[/C][C]0.0929[/C][C]0.4305[/C][C]0.4446[/C][/ROW]
[ROW][C]80[/C][C]127.1[/C][C]88.8111[/C][C]22.4792[/C][C]155.143[/C][C]0.1289[/C][C]0.0821[/C][C]0.417[/C][C]0.4437[/C][/ROW]
[ROW][C]81[/C][C]128.5[/C][C]88.6824[/C][C]21.5159[/C][C]155.8488[/C][C]0.1226[/C][C]0.1311[/C][C]0.4132[/C][C]0.4429[/C][/ROW]
[ROW][C]82[/C][C]126.6[/C][C]88.5686[/C][C]20.5369[/C][C]156.6003[/C][C]0.1366[/C][C]0.125[/C][C]0.3377[/C][C]0.4424[/C][/ROW]
[ROW][C]83[/C][C]132.6[/C][C]88.4792[/C][C]19.5832[/C][C]157.3753[/C][C]0.1047[/C][C]0.1391[/C][C]0.3001[/C][C]0.4421[/C][/ROW]
[ROW][C]84[/C][C]130.9[/C][C]88.4185[/C][C]18.6833[/C][C]158.1537[/C][C]0.1162[/C][C]0.1072[/C][C]0.2343[/C][C]0.4421[/C][/ROW]
[/TABLE]
Source: https://freestatistics.org/blog/index.php?pk=194581&T=1

Globally Unique Identifier (entire table): ba.freestatistics.org/blog/index.php?pk=194581&T=1

As an alternative you can also use a QR Code:  

The GUIDs for individual cells are displayed in the table below:

Univariate ARIMA Extrapolation Forecast
timeY[t]F[t]95% LB95% UBp-value(H0: Y[t] = F[t])P(F[t]>Y[t-1])P(F[t]>Y[t-s])P(F[t]>Y[60])
4854-------
4956.3-------
5054.2-------
5159.3-------
5263.4-------
5373.3-------
5486.7-------
5581.3-------
5689.6-------
5785.3-------
5892.4-------
5996.8-------
6093.6-------
6197.692.688378.5129106.86370.24850.449810.4498
6294.290.737966.5901114.88570.38940.28880.99850.4081
6399.989.29855.0114123.58460.27220.38970.95680.4029
64106.488.006845.2014130.81210.19980.2930.87010.3989
659687.126637.5345136.71870.36290.22310.70760.399
6694.986.602832.0427141.1630.38280.36780.49860.4008
6794.886.43128.4757144.38620.38860.38730.56890.4042
6895.986.538526.4238146.65310.38010.39380.46020.409
6996.286.849225.4426148.25580.38270.38630.51970.4147
70103.187.278125.1282149.42810.30890.38920.43580.421
71106.987.748625.1658150.33140.27430.31530.38840.4273
72114.288.196925.3359151.05790.20870.27990.43310.4331
73118.288.577425.4988151.6560.17870.2130.38960.438
74123.988.86325.5684152.15770.1390.18180.43440.4417
75137.189.04425.4915152.59640.06920.14120.36890.4441
76146.289.124625.2366153.01270.040.07050.29810.4454
77136.489.119924.7912153.44860.07490.0410.4170.4457
78133.289.050624.1627153.93860.09120.07630.42990.4454
79135.988.940223.378154.50250.08020.09290.43050.4446
80127.188.811122.4792155.1430.12890.08210.4170.4437
81128.588.682421.5159155.84880.12260.13110.41320.4429
82126.688.568620.5369156.60030.13660.1250.33770.4424
83132.688.479219.5832157.37530.10470.13910.30010.4421
84130.988.418518.6833158.15370.11620.10720.23430.4421


Univariate ARIMA Extrapolation Forecast Performance
time% S.E.PEMAPESq.EMSERMSE
610.0780.053024.124600
620.13580.03820.045611.986418.05554.2492
630.19590.11870.07112.40249.50437.0359
640.24820.2090.1047338.3104121.705911.032
650.29040.10180.104178.7368113.11210.6354
660.32140.09580.102868.8427105.733810.2827
670.34210.09680.101970.0407100.634810.0317
680.35440.10820.102787.638599.01039.9504
690.36070.10770.103287.437397.72449.8856
700.36330.18130.111250.3315112.985110.6294
710.36390.21830.1208366.7776136.057111.6644
720.36360.29480.1353676.1625181.065913.4561
730.36330.33440.1506877.4984234.637715.3179
740.36340.39430.1681227.5895305.562817.4804
750.36410.53970.19282309.3833439.150820.9559
760.36570.64040.22083257.5967615.303724.8053
770.36830.53050.2392235.4101710.604126.6572
780.37180.49580.25331949.1654779.41327.918
790.37610.5280.26772205.2182854.455429.2311
800.38110.43110.27591466.0401885.034629.7495
810.38640.4490.28411585.4434918.387430.3049
820.39190.42940.29071446.3854942.387330.6983
830.39730.49870.29981946.6435986.050731.4014
840.40240.48050.30731804.67791020.160131.9399

\begin{tabular}{lllllllll}
\hline
Univariate ARIMA Extrapolation Forecast Performance \tabularnewline
time & % S.E. & PE & MAPE & Sq.E & MSE & RMSE \tabularnewline
61 & 0.078 & 0.053 & 0 & 24.1246 & 0 & 0 \tabularnewline
62 & 0.1358 & 0.0382 & 0.0456 & 11.9864 & 18.0555 & 4.2492 \tabularnewline
63 & 0.1959 & 0.1187 & 0.07 & 112.402 & 49.5043 & 7.0359 \tabularnewline
64 & 0.2482 & 0.209 & 0.1047 & 338.3104 & 121.7059 & 11.032 \tabularnewline
65 & 0.2904 & 0.1018 & 0.1041 & 78.7368 & 113.112 & 10.6354 \tabularnewline
66 & 0.3214 & 0.0958 & 0.1028 & 68.8427 & 105.7338 & 10.2827 \tabularnewline
67 & 0.3421 & 0.0968 & 0.1019 & 70.0407 & 100.6348 & 10.0317 \tabularnewline
68 & 0.3544 & 0.1082 & 0.1027 & 87.6385 & 99.0103 & 9.9504 \tabularnewline
69 & 0.3607 & 0.1077 & 0.1032 & 87.4373 & 97.7244 & 9.8856 \tabularnewline
70 & 0.3633 & 0.1813 & 0.111 & 250.3315 & 112.9851 & 10.6294 \tabularnewline
71 & 0.3639 & 0.2183 & 0.1208 & 366.7776 & 136.0571 & 11.6644 \tabularnewline
72 & 0.3636 & 0.2948 & 0.1353 & 676.1625 & 181.0659 & 13.4561 \tabularnewline
73 & 0.3633 & 0.3344 & 0.1506 & 877.4984 & 234.6377 & 15.3179 \tabularnewline
74 & 0.3634 & 0.3943 & 0.168 & 1227.5895 & 305.5628 & 17.4804 \tabularnewline
75 & 0.3641 & 0.5397 & 0.1928 & 2309.3833 & 439.1508 & 20.9559 \tabularnewline
76 & 0.3657 & 0.6404 & 0.2208 & 3257.5967 & 615.3037 & 24.8053 \tabularnewline
77 & 0.3683 & 0.5305 & 0.239 & 2235.4101 & 710.6041 & 26.6572 \tabularnewline
78 & 0.3718 & 0.4958 & 0.2533 & 1949.1654 & 779.413 & 27.918 \tabularnewline
79 & 0.3761 & 0.528 & 0.2677 & 2205.2182 & 854.4554 & 29.2311 \tabularnewline
80 & 0.3811 & 0.4311 & 0.2759 & 1466.0401 & 885.0346 & 29.7495 \tabularnewline
81 & 0.3864 & 0.449 & 0.2841 & 1585.4434 & 918.3874 & 30.3049 \tabularnewline
82 & 0.3919 & 0.4294 & 0.2907 & 1446.3854 & 942.3873 & 30.6983 \tabularnewline
83 & 0.3973 & 0.4987 & 0.2998 & 1946.6435 & 986.0507 & 31.4014 \tabularnewline
84 & 0.4024 & 0.4805 & 0.3073 & 1804.6779 & 1020.1601 & 31.9399 \tabularnewline
\hline
\end{tabular}
%Source: https://freestatistics.org/blog/index.php?pk=194581&T=2

[TABLE]
[ROW][C]Univariate ARIMA Extrapolation Forecast Performance[/C][/ROW]
[ROW][C]time[/C][C]% S.E.[/C][C]PE[/C][C]MAPE[/C][C]Sq.E[/C][C]MSE[/C][C]RMSE[/C][/ROW]
[ROW][C]61[/C][C]0.078[/C][C]0.053[/C][C]0[/C][C]24.1246[/C][C]0[/C][C]0[/C][/ROW]
[ROW][C]62[/C][C]0.1358[/C][C]0.0382[/C][C]0.0456[/C][C]11.9864[/C][C]18.0555[/C][C]4.2492[/C][/ROW]
[ROW][C]63[/C][C]0.1959[/C][C]0.1187[/C][C]0.07[/C][C]112.402[/C][C]49.5043[/C][C]7.0359[/C][/ROW]
[ROW][C]64[/C][C]0.2482[/C][C]0.209[/C][C]0.1047[/C][C]338.3104[/C][C]121.7059[/C][C]11.032[/C][/ROW]
[ROW][C]65[/C][C]0.2904[/C][C]0.1018[/C][C]0.1041[/C][C]78.7368[/C][C]113.112[/C][C]10.6354[/C][/ROW]
[ROW][C]66[/C][C]0.3214[/C][C]0.0958[/C][C]0.1028[/C][C]68.8427[/C][C]105.7338[/C][C]10.2827[/C][/ROW]
[ROW][C]67[/C][C]0.3421[/C][C]0.0968[/C][C]0.1019[/C][C]70.0407[/C][C]100.6348[/C][C]10.0317[/C][/ROW]
[ROW][C]68[/C][C]0.3544[/C][C]0.1082[/C][C]0.1027[/C][C]87.6385[/C][C]99.0103[/C][C]9.9504[/C][/ROW]
[ROW][C]69[/C][C]0.3607[/C][C]0.1077[/C][C]0.1032[/C][C]87.4373[/C][C]97.7244[/C][C]9.8856[/C][/ROW]
[ROW][C]70[/C][C]0.3633[/C][C]0.1813[/C][C]0.111[/C][C]250.3315[/C][C]112.9851[/C][C]10.6294[/C][/ROW]
[ROW][C]71[/C][C]0.3639[/C][C]0.2183[/C][C]0.1208[/C][C]366.7776[/C][C]136.0571[/C][C]11.6644[/C][/ROW]
[ROW][C]72[/C][C]0.3636[/C][C]0.2948[/C][C]0.1353[/C][C]676.1625[/C][C]181.0659[/C][C]13.4561[/C][/ROW]
[ROW][C]73[/C][C]0.3633[/C][C]0.3344[/C][C]0.1506[/C][C]877.4984[/C][C]234.6377[/C][C]15.3179[/C][/ROW]
[ROW][C]74[/C][C]0.3634[/C][C]0.3943[/C][C]0.168[/C][C]1227.5895[/C][C]305.5628[/C][C]17.4804[/C][/ROW]
[ROW][C]75[/C][C]0.3641[/C][C]0.5397[/C][C]0.1928[/C][C]2309.3833[/C][C]439.1508[/C][C]20.9559[/C][/ROW]
[ROW][C]76[/C][C]0.3657[/C][C]0.6404[/C][C]0.2208[/C][C]3257.5967[/C][C]615.3037[/C][C]24.8053[/C][/ROW]
[ROW][C]77[/C][C]0.3683[/C][C]0.5305[/C][C]0.239[/C][C]2235.4101[/C][C]710.6041[/C][C]26.6572[/C][/ROW]
[ROW][C]78[/C][C]0.3718[/C][C]0.4958[/C][C]0.2533[/C][C]1949.1654[/C][C]779.413[/C][C]27.918[/C][/ROW]
[ROW][C]79[/C][C]0.3761[/C][C]0.528[/C][C]0.2677[/C][C]2205.2182[/C][C]854.4554[/C][C]29.2311[/C][/ROW]
[ROW][C]80[/C][C]0.3811[/C][C]0.4311[/C][C]0.2759[/C][C]1466.0401[/C][C]885.0346[/C][C]29.7495[/C][/ROW]
[ROW][C]81[/C][C]0.3864[/C][C]0.449[/C][C]0.2841[/C][C]1585.4434[/C][C]918.3874[/C][C]30.3049[/C][/ROW]
[ROW][C]82[/C][C]0.3919[/C][C]0.4294[/C][C]0.2907[/C][C]1446.3854[/C][C]942.3873[/C][C]30.6983[/C][/ROW]
[ROW][C]83[/C][C]0.3973[/C][C]0.4987[/C][C]0.2998[/C][C]1946.6435[/C][C]986.0507[/C][C]31.4014[/C][/ROW]
[ROW][C]84[/C][C]0.4024[/C][C]0.4805[/C][C]0.3073[/C][C]1804.6779[/C][C]1020.1601[/C][C]31.9399[/C][/ROW]
[/TABLE]
Source: https://freestatistics.org/blog/index.php?pk=194581&T=2

Globally Unique Identifier (entire table): ba.freestatistics.org/blog/index.php?pk=194581&T=2

As an alternative you can also use a QR Code:  

The GUIDs for individual cells are displayed in the table below:

Univariate ARIMA Extrapolation Forecast Performance
time% S.E.PEMAPESq.EMSERMSE
610.0780.053024.124600
620.13580.03820.045611.986418.05554.2492
630.19590.11870.07112.40249.50437.0359
640.24820.2090.1047338.3104121.705911.032
650.29040.10180.104178.7368113.11210.6354
660.32140.09580.102868.8427105.733810.2827
670.34210.09680.101970.0407100.634810.0317
680.35440.10820.102787.638599.01039.9504
690.36070.10770.103287.437397.72449.8856
700.36330.18130.111250.3315112.985110.6294
710.36390.21830.1208366.7776136.057111.6644
720.36360.29480.1353676.1625181.065913.4561
730.36330.33440.1506877.4984234.637715.3179
740.36340.39430.1681227.5895305.562817.4804
750.36410.53970.19282309.3833439.150820.9559
760.36570.64040.22083257.5967615.303724.8053
770.36830.53050.2392235.4101710.604126.6572
780.37180.49580.25331949.1654779.41327.918
790.37610.5280.26772205.2182854.455429.2311
800.38110.43110.27591466.0401885.034629.7495
810.38640.4490.28411585.4434918.387430.3049
820.39190.42940.29071446.3854942.387330.6983
830.39730.49870.29981946.6435986.050731.4014
840.40240.48050.30731804.67791020.160131.9399


Parameters (Session):
par1 = 24 ; par2 = 1 ; par3 = 1 ; par4 = 0 ; par5 = 12 ; par6 = 3 ; par7 = 1 ; par8 = 0 ; par9 = 0 ; par10 = FALSE ;
Parameters (R input):
par1 = 24 ; par2 = 1 ; par3 = 1 ; par4 = 0 ; par5 = 12 ; par6 = 3 ; par7 = 1 ; par8 = 0 ; par9 = 0 ; par10 = FALSE ;
R code (references can be found in the software module):
par1 <- as.numeric(par1) #cut off periods
par2 <- as.numeric(par2) #lambda
par3 <- as.numeric(par3) #degree of non-seasonal differencing
par4 <- as.numeric(par4) #degree of seasonal differencing
par5 <- as.numeric(par5) #seasonal period
par6 <- as.numeric(par6) #p
par7 <- as.numeric(par7) #q
par8 <- as.numeric(par8) #P
par9 <- as.numeric(par9) #Q
if (par10 == 'TRUE') par10 <- TRUE
if (par10 == 'FALSE') par10 <- FALSE
if (par2 == 0) x <- log(x)
if (par2 != 0) x <- x^par2
lx <- length(x)
first <- lx - 2*par1
nx <- lx - par1
nx1 <- nx + 1
fx <- lx - nx
if (fx < 1) {
fx <- par5
nx1 <- lx + fx - 1
first <- lx - 2*fx
}
first <- 1
if (fx < 3) fx <- round(lx/10,0)
(arima.out <- arima(x[1:nx], order=c(par6,par3,par7), seasonal=list(order=c(par8,par4,par9), period=par5), include.mean=par10, method='ML'))
(forecast <- predict(arima.out,par1))
(lb <- forecast$pred - 1.96 * forecast$se)
(ub <- forecast$pred + 1.96 * forecast$se)
if (par2 == 0) {
x <- exp(x)
forecast$pred <- exp(forecast$pred)
lb <- exp(lb)
ub <- exp(ub)
}
if (par2 != 0) {
x <- x^(1/par2)
forecast$pred <- forecast$pred^(1/par2)
lb <- lb^(1/par2)
ub <- ub^(1/par2)
}
if (par2 < 0) {
olb <- lb
lb <- ub
ub <- olb
}
(actandfor <- c(x[1:nx], forecast$pred))
(perc.se <- (ub-forecast$pred)/1.96/forecast$pred)
bitmap(file='test1.png')
opar <- par(mar=c(4,4,2,2),las=1)
ylim <- c( min(x[first:nx],lb), max(x[first:nx],ub))
plot(x,ylim=ylim,type='n',xlim=c(first,lx))
usr <- par('usr')
rect(usr[1],usr[3],nx+1,usr[4],border=NA,col='lemonchiffon')
rect(nx1,usr[3],usr[2],usr[4],border=NA,col='lavender')
abline(h= (-3:3)*2 , col ='gray', lty =3)
polygon( c(nx1:lx,lx:nx1), c(lb,rev(ub)), col = 'orange', lty=2,border=NA)
lines(nx1:lx, lb , lty=2)
lines(nx1:lx, ub , lty=2)
lines(x, lwd=2)
lines(nx1:lx, forecast$pred , lwd=2 , col ='white')
box()
par(opar)
dev.off()
prob.dec <- array(NA, dim=fx)
prob.sdec <- array(NA, dim=fx)
prob.ldec <- array(NA, dim=fx)
prob.pval <- array(NA, dim=fx)
perf.pe <- array(0, dim=fx)
perf.mape <- array(0, dim=fx)
perf.mape1 <- array(0, dim=fx)
perf.se <- array(0, dim=fx)
perf.mse <- array(0, dim=fx)
perf.mse1 <- array(0, dim=fx)
perf.rmse <- array(0, dim=fx)
for (i in 1:fx) {
locSD <- (ub[i] - forecast$pred[i]) / 1.96
perf.pe[i] = (x[nx+i] - forecast$pred[i]) / forecast$pred[i]
perf.se[i] = (x[nx+i] - forecast$pred[i])^2
prob.dec[i] = pnorm((x[nx+i-1] - forecast$pred[i]) / locSD)
prob.sdec[i] = pnorm((x[nx+i-par5] - forecast$pred[i]) / locSD)
prob.ldec[i] = pnorm((x[nx] - forecast$pred[i]) / locSD)
prob.pval[i] = pnorm(abs(x[nx+i] - forecast$pred[i]) / locSD)
}
perf.mape[1] = abs(perf.pe[1])
perf.mse[1] = abs(perf.se[1])
for (i in 2:fx) {
perf.mape[i] = perf.mape[i-1] + abs(perf.pe[i])
perf.mape1[i] = perf.mape[i] / i
perf.mse[i] = perf.mse[i-1] + perf.se[i]
perf.mse1[i] = perf.mse[i] / i
}
perf.rmse = sqrt(perf.mse1)
bitmap(file='test2.png')
plot(forecast$pred, pch=19, type='b',main='ARIMA Extrapolation Forecast', ylab='Forecast and 95% CI', xlab='time',ylim=c(min(lb),max(ub)))
dum <- forecast$pred
dum[1:par1] <- x[(nx+1):lx]
lines(dum, lty=1)
lines(ub,lty=3)
lines(lb,lty=3)
dev.off()
load(file='createtable')
a<-table.start()
a<-table.row.start(a)
a<-table.element(a,'Univariate ARIMA Extrapolation Forecast',9,TRUE)
a<-table.row.end(a)
a<-table.row.start(a)
a<-table.element(a,'time',1,header=TRUE)
a<-table.element(a,'Y[t]',1,header=TRUE)
a<-table.element(a,'F[t]',1,header=TRUE)
a<-table.element(a,'95% LB',1,header=TRUE)
a<-table.element(a,'95% UB',1,header=TRUE)
a<-table.element(a,'p-value
(H0: Y[t] = F[t])',1,header=TRUE)
a<-table.element(a,'P(F[t]>Y[t-1])',1,header=TRUE)
a<-table.element(a,'P(F[t]>Y[t-s])',1,header=TRUE)
mylab <- paste('P(F[t]>Y[',nx,sep='')
mylab <- paste(mylab,'])',sep='')
a<-table.element(a,mylab,1,header=TRUE)
a<-table.row.end(a)
for (i in (nx-par5):nx) {
a<-table.row.start(a)
a<-table.element(a,i,header=TRUE)
a<-table.element(a,x[i])
a<-table.element(a,'-')
a<-table.row.end(a)
}
for (i in 1:fx) {
a<-table.row.start(a)
a<-table.element(a,nx+i,header=TRUE)
a<-table.element(a,round(x[nx+i],4))
a<-table.element(a,round(forecast$pred[i],4))
a<-table.element(a,round(lb[i],4))
a<-table.element(a,round(ub[i],4))
a<-table.element(a,round((1-prob.pval[i]),4))
a<-table.element(a,round((1-prob.dec[i]),4))
a<-table.element(a,round((1-prob.sdec[i]),4))
a<-table.element(a,round((1-prob.ldec[i]),4))
a<-table.row.end(a)
}
a<-table.end(a)
table.save(a,file='mytable.tab')
a<-table.start()
a<-table.row.start(a)
a<-table.element(a,'Univariate ARIMA Extrapolation Forecast Performance',7,TRUE)
a<-table.row.end(a)
a<-table.row.start(a)
a<-table.element(a,'time',1,header=TRUE)
a<-table.element(a,'% S.E.',1,header=TRUE)
a<-table.element(a,'PE',1,header=TRUE)
a<-table.element(a,'MAPE',1,header=TRUE)
a<-table.element(a,'Sq.E',1,header=TRUE)
a<-table.element(a,'MSE',1,header=TRUE)
a<-table.element(a,'RMSE',1,header=TRUE)
a<-table.row.end(a)
for (i in 1:fx) {
a<-table.row.start(a)
a<-table.element(a,nx+i,header=TRUE)
a<-table.element(a,round(perc.se[i],4))
a<-table.element(a,round(perf.pe[i],4))
a<-table.element(a,round(perf.mape1[i],4))
a<-table.element(a,round(perf.se[i],4))
a<-table.element(a,round(perf.mse1[i],4))
a<-table.element(a,round(perf.rmse[i],4))
a<-table.row.end(a)
}
a<-table.end(a)
table.save(a,file='mytable1.tab')