Free Statistics
of Irreproducible Research!
Description of Statistical Computation | |||||||||||||||||||||
|---|---|---|---|---|---|---|---|---|---|---|---|---|---|---|---|---|---|---|---|---|---|
| Author's title | |||||||||||||||||||||
| Author | *Unverified author* | ||||||||||||||||||||
| R Software Module | rwasp_sdplot.wasp | ||||||||||||||||||||
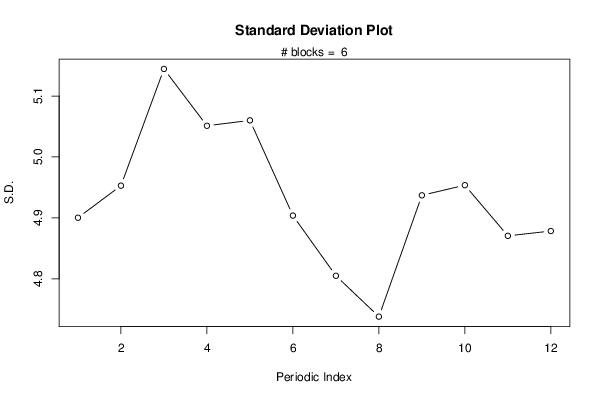
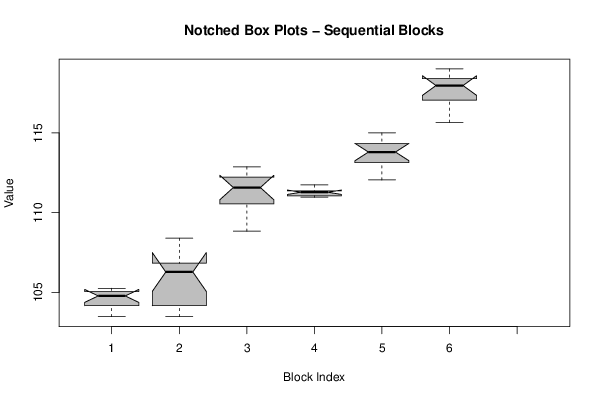
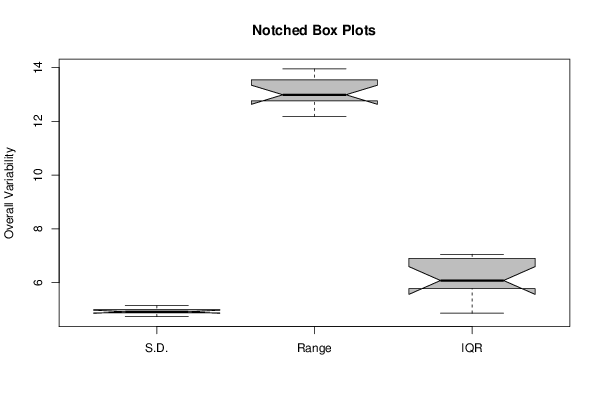
| Title produced by software | Standard Deviation Plot | ||||||||||||||||||||
| Date of computation | Thu, 29 Nov 2012 06:33:21 -0500 | ||||||||||||||||||||
| Cite this page as follows | Statistical Computations at FreeStatistics.org, Office for Research Development and Education, URL https://freestatistics.org/blog/index.php?v=date/2012/Nov/29/t1354188858av3my9ywksh2mxx.htm/, Retrieved Sun, 28 Apr 2024 12:00:54 +0000 | ||||||||||||||||||||
| Statistical Computations at FreeStatistics.org, Office for Research Development and Education, URL https://freestatistics.org/blog/index.php?pk=194261, Retrieved Sun, 28 Apr 2024 12:00:54 +0000 | |||||||||||||||||||||
| QR Codes: | |||||||||||||||||||||
|
| |||||||||||||||||||||
| Original text written by user: | |||||||||||||||||||||
| IsPrivate? | No (this computation is public) | ||||||||||||||||||||
| User-defined keywords | |||||||||||||||||||||
| Estimated Impact | 103 | ||||||||||||||||||||
Tree of Dependent Computations | |||||||||||||||||||||
| Family? (F = Feedback message, R = changed R code, M = changed R Module, P = changed Parameters, D = changed Data) | |||||||||||||||||||||
| - [Standard Deviation Plot] [spreidingsgrafiek...] [2012-11-29 11:33:21] [87986ea810528d5717aba44b63d5427b] [Current] | |||||||||||||||||||||
| Feedback Forum | |||||||||||||||||||||
Post a new message | |||||||||||||||||||||
Dataset | |||||||||||||||||||||
| Dataseries X: | |||||||||||||||||||||
103,48 103,93 103,89 104,4 104,79 104,77 105,13 105,26 104,96 104,75 105,01 105,1 103,48 103,93 103,89 104,4 104,79 106,12 106,57 106,44 106,54 107,1 108,1 108,4 108,84 109,62 110,42 110,67 111,66 112,28 112,87 112,18 112,36 112,16 111,49 111,25 111,36 111,74 111,1 111,33 111,25 111,04 110,97 111,31 111,02 111,07 111,36 111,54 112,05 112,52 112,94 113,33 113,78 113,77 113,82 113,89 114,25 114,41 114,55 115 115,66 116,33 116,91 117,2 117,59 117,95 118,09 117,99 118,31 118,49 118,96 119,01 | |||||||||||||||||||||
Tables (Output of Computation) | |||||||||||||||||||||
| |||||||||||||||||||||
Figures (Output of Computation) | |||||||||||||||||||||
Input Parameters & R Code | |||||||||||||||||||||
| Parameters (Session): | |||||||||||||||||||||
| par1 = 12 ; | |||||||||||||||||||||
| Parameters (R input): | |||||||||||||||||||||
| par1 = 12 ; | |||||||||||||||||||||
| R code (references can be found in the software module): | |||||||||||||||||||||
par1 <- as.numeric(par1) | |||||||||||||||||||||