Free Statistics

of Irreproducible Research!

Author's title

Author*Unverified author*
R Software Modulerwasp_autocorrelation.wasp
Title produced by software(Partial) Autocorrelation Function
Date of computationThu, 29 Nov 2012 05:29:12 -0500
Cite this page as followsStatistical Computations at FreeStatistics.org, Office for Research Development and Education, URL https://freestatistics.org/blog/index.php?v=date/2012/Nov/29/t1354184961hbvauvg75jcns55.htm/, Retrieved Sun, 28 Apr 2024 10:00:13 +0000
Statistical Computations at FreeStatistics.org, Office for Research Development and Education, URL https://freestatistics.org/blog/index.php?pk=194242, Retrieved Sun, 28 Apr 2024 10:00:13 +0000
QR Codes:

Original text written by user:
IsPrivate?No (this computation is public)
User-defined keywords
Estimated Impact120
Family? (F = Feedback message, R = changed R code, M = changed R Module, P = changed Parameters, D = changed Data)
-       [(Partial) Autocorrelation Function] [] [2012-11-29 10:29:12] [0dfc9291120e0017631158d00b067a5a] [Current]
Feedback Forum

Post a new message
Dataseries X:
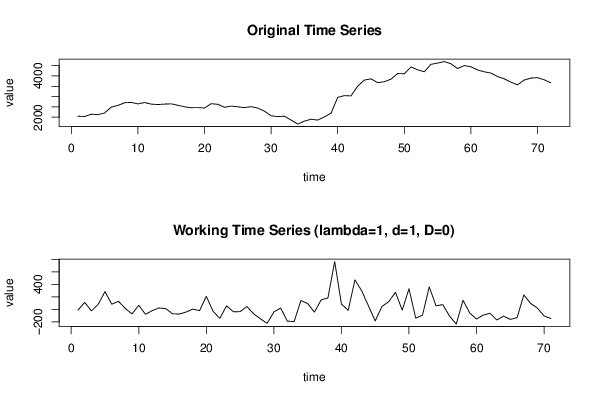
2048
2037
2149
2124
2205
2489
2573
2702
2718
2646
2712
2634
2614
2637
2649
2579
2505
2462
2467
2447
2656
2626
2483
2540
2503
2467
2513
2443
2293
2071
2030
2052
1864
1670
1811
1905
1863
2014
2198
2962
3047
3033
3504
3801
3858
3674
3721
3844
4117
4105
4435
4296
4203
4563
4621
4697
4591
4357
4503
4444
4291
4200
4139
3970
3862
3702
3570
3801
3896
3918
3813
3667


Summary of computational transaction
Raw Inputview raw input (R code)
Raw Outputview raw output of R engine
Computing time3 seconds
R Server'Sir Maurice George Kendall' @ kendall.wessa.net

\begin{tabular}{lllllllll}
\hline
Summary of computational transaction \tabularnewline
Raw Input & view raw input (R code)  \tabularnewline
Raw Output & view raw output of R engine  \tabularnewline
Computing time & 3 seconds \tabularnewline
R Server & 'Sir Maurice George Kendall' @ kendall.wessa.net \tabularnewline
\hline
\end{tabular}
%Source: https://freestatistics.org/blog/index.php?pk=194242&T=0

[TABLE]
[ROW][C]Summary of computational transaction[/C][/ROW]
[ROW][C]Raw Input[/C][C]view raw input (R code) [/C][/ROW]
[ROW][C]Raw Output[/C][C]view raw output of R engine [/C][/ROW]
[ROW][C]Computing time[/C][C]3 seconds[/C][/ROW]
[ROW][C]R Server[/C][C]'Sir Maurice George Kendall' @ kendall.wessa.net[/C][/ROW]
[/TABLE]
Source: https://freestatistics.org/blog/index.php?pk=194242&T=0

Globally Unique Identifier (entire table): ba.freestatistics.org/blog/index.php?pk=194242&T=0

As an alternative you can also use a QR Code:  

The GUIDs for individual cells are displayed in the table below:

Summary of computational transaction
Raw Inputview raw input (R code)
Raw Outputview raw output of R engine
Computing time3 seconds
R Server'Sir Maurice George Kendall' @ kendall.wessa.net


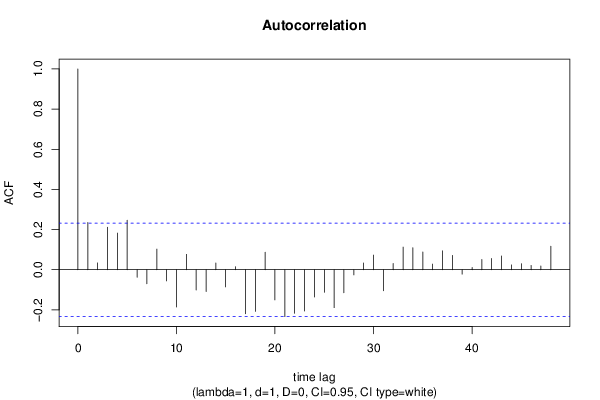
Autocorrelation Function
Time lag kACF(k)T-STATP-value
10.2355411.98470.025521
20.0338990.28560.387994
30.2112431.780.03968
40.1821941.53520.06459
50.2463642.07590.020763
6-0.037397-0.31510.3768
7-0.07035-0.59280.277607
80.1025750.86430.195163
9-0.05556-0.46820.320554
10-0.185423-1.56240.06132
110.076380.64360.260957
12-0.101512-0.85540.197617
13-0.108234-0.9120.182428
140.0331920.27970.390269
15-0.085554-0.72090.236673
160.0145480.12260.451391
17-0.21923-1.84730.034438
18-0.207663-1.74980.042236
190.0871520.73440.232576
20-0.150278-1.26630.104778
21-0.233818-1.97020.026359
22-0.216611-1.82520.036089
23-0.205696-1.73320.043698
24-0.136259-1.14810.127383
25-0.112299-0.94620.173616
26-0.188939-1.5920.05791
27-0.115215-0.97080.167466
28-0.025758-0.2170.414399
290.0332880.28050.389958
300.0727980.61340.270785
31-0.105158-0.88610.189284
320.0308170.25970.397937
330.1126490.94920.172869
340.1091840.920.180344
350.0885470.74610.229032
360.0278960.23510.40742
370.0939580.79170.215586
380.0712660.60050.275043
39-0.021981-0.18520.426793
400.0108110.09110.463836
410.0510260.430.334265
420.0561110.47280.318903
430.0679970.57290.284244
440.0239620.20190.420282
450.0300650.25330.400372
460.0214680.18090.428484
470.018210.15340.439243
480.1166410.98280.164512

\begin{tabular}{lllllllll}
\hline
Autocorrelation Function \tabularnewline
Time lag k & ACF(k) & T-STAT & P-value \tabularnewline
1 & 0.235541 & 1.9847 & 0.025521 \tabularnewline
2 & 0.033899 & 0.2856 & 0.387994 \tabularnewline
3 & 0.211243 & 1.78 & 0.03968 \tabularnewline
4 & 0.182194 & 1.5352 & 0.06459 \tabularnewline
5 & 0.246364 & 2.0759 & 0.020763 \tabularnewline
6 & -0.037397 & -0.3151 & 0.3768 \tabularnewline
7 & -0.07035 & -0.5928 & 0.277607 \tabularnewline
8 & 0.102575 & 0.8643 & 0.195163 \tabularnewline
9 & -0.05556 & -0.4682 & 0.320554 \tabularnewline
10 & -0.185423 & -1.5624 & 0.06132 \tabularnewline
11 & 0.07638 & 0.6436 & 0.260957 \tabularnewline
12 & -0.101512 & -0.8554 & 0.197617 \tabularnewline
13 & -0.108234 & -0.912 & 0.182428 \tabularnewline
14 & 0.033192 & 0.2797 & 0.390269 \tabularnewline
15 & -0.085554 & -0.7209 & 0.236673 \tabularnewline
16 & 0.014548 & 0.1226 & 0.451391 \tabularnewline
17 & -0.21923 & -1.8473 & 0.034438 \tabularnewline
18 & -0.207663 & -1.7498 & 0.042236 \tabularnewline
19 & 0.087152 & 0.7344 & 0.232576 \tabularnewline
20 & -0.150278 & -1.2663 & 0.104778 \tabularnewline
21 & -0.233818 & -1.9702 & 0.026359 \tabularnewline
22 & -0.216611 & -1.8252 & 0.036089 \tabularnewline
23 & -0.205696 & -1.7332 & 0.043698 \tabularnewline
24 & -0.136259 & -1.1481 & 0.127383 \tabularnewline
25 & -0.112299 & -0.9462 & 0.173616 \tabularnewline
26 & -0.188939 & -1.592 & 0.05791 \tabularnewline
27 & -0.115215 & -0.9708 & 0.167466 \tabularnewline
28 & -0.025758 & -0.217 & 0.414399 \tabularnewline
29 & 0.033288 & 0.2805 & 0.389958 \tabularnewline
30 & 0.072798 & 0.6134 & 0.270785 \tabularnewline
31 & -0.105158 & -0.8861 & 0.189284 \tabularnewline
32 & 0.030817 & 0.2597 & 0.397937 \tabularnewline
33 & 0.112649 & 0.9492 & 0.172869 \tabularnewline
34 & 0.109184 & 0.92 & 0.180344 \tabularnewline
35 & 0.088547 & 0.7461 & 0.229032 \tabularnewline
36 & 0.027896 & 0.2351 & 0.40742 \tabularnewline
37 & 0.093958 & 0.7917 & 0.215586 \tabularnewline
38 & 0.071266 & 0.6005 & 0.275043 \tabularnewline
39 & -0.021981 & -0.1852 & 0.426793 \tabularnewline
40 & 0.010811 & 0.0911 & 0.463836 \tabularnewline
41 & 0.051026 & 0.43 & 0.334265 \tabularnewline
42 & 0.056111 & 0.4728 & 0.318903 \tabularnewline
43 & 0.067997 & 0.5729 & 0.284244 \tabularnewline
44 & 0.023962 & 0.2019 & 0.420282 \tabularnewline
45 & 0.030065 & 0.2533 & 0.400372 \tabularnewline
46 & 0.021468 & 0.1809 & 0.428484 \tabularnewline
47 & 0.01821 & 0.1534 & 0.439243 \tabularnewline
48 & 0.116641 & 0.9828 & 0.164512 \tabularnewline
\hline
\end{tabular}
%Source: https://freestatistics.org/blog/index.php?pk=194242&T=1

[TABLE]
[ROW][C]Autocorrelation Function[/C][/ROW]
[ROW][C]Time lag k[/C][C]ACF(k)[/C][C]T-STAT[/C][C]P-value[/C][/ROW]
[ROW][C]1[/C][C]0.235541[/C][C]1.9847[/C][C]0.025521[/C][/ROW]
[ROW][C]2[/C][C]0.033899[/C][C]0.2856[/C][C]0.387994[/C][/ROW]
[ROW][C]3[/C][C]0.211243[/C][C]1.78[/C][C]0.03968[/C][/ROW]
[ROW][C]4[/C][C]0.182194[/C][C]1.5352[/C][C]0.06459[/C][/ROW]
[ROW][C]5[/C][C]0.246364[/C][C]2.0759[/C][C]0.020763[/C][/ROW]
[ROW][C]6[/C][C]-0.037397[/C][C]-0.3151[/C][C]0.3768[/C][/ROW]
[ROW][C]7[/C][C]-0.07035[/C][C]-0.5928[/C][C]0.277607[/C][/ROW]
[ROW][C]8[/C][C]0.102575[/C][C]0.8643[/C][C]0.195163[/C][/ROW]
[ROW][C]9[/C][C]-0.05556[/C][C]-0.4682[/C][C]0.320554[/C][/ROW]
[ROW][C]10[/C][C]-0.185423[/C][C]-1.5624[/C][C]0.06132[/C][/ROW]
[ROW][C]11[/C][C]0.07638[/C][C]0.6436[/C][C]0.260957[/C][/ROW]
[ROW][C]12[/C][C]-0.101512[/C][C]-0.8554[/C][C]0.197617[/C][/ROW]
[ROW][C]13[/C][C]-0.108234[/C][C]-0.912[/C][C]0.182428[/C][/ROW]
[ROW][C]14[/C][C]0.033192[/C][C]0.2797[/C][C]0.390269[/C][/ROW]
[ROW][C]15[/C][C]-0.085554[/C][C]-0.7209[/C][C]0.236673[/C][/ROW]
[ROW][C]16[/C][C]0.014548[/C][C]0.1226[/C][C]0.451391[/C][/ROW]
[ROW][C]17[/C][C]-0.21923[/C][C]-1.8473[/C][C]0.034438[/C][/ROW]
[ROW][C]18[/C][C]-0.207663[/C][C]-1.7498[/C][C]0.042236[/C][/ROW]
[ROW][C]19[/C][C]0.087152[/C][C]0.7344[/C][C]0.232576[/C][/ROW]
[ROW][C]20[/C][C]-0.150278[/C][C]-1.2663[/C][C]0.104778[/C][/ROW]
[ROW][C]21[/C][C]-0.233818[/C][C]-1.9702[/C][C]0.026359[/C][/ROW]
[ROW][C]22[/C][C]-0.216611[/C][C]-1.8252[/C][C]0.036089[/C][/ROW]
[ROW][C]23[/C][C]-0.205696[/C][C]-1.7332[/C][C]0.043698[/C][/ROW]
[ROW][C]24[/C][C]-0.136259[/C][C]-1.1481[/C][C]0.127383[/C][/ROW]
[ROW][C]25[/C][C]-0.112299[/C][C]-0.9462[/C][C]0.173616[/C][/ROW]
[ROW][C]26[/C][C]-0.188939[/C][C]-1.592[/C][C]0.05791[/C][/ROW]
[ROW][C]27[/C][C]-0.115215[/C][C]-0.9708[/C][C]0.167466[/C][/ROW]
[ROW][C]28[/C][C]-0.025758[/C][C]-0.217[/C][C]0.414399[/C][/ROW]
[ROW][C]29[/C][C]0.033288[/C][C]0.2805[/C][C]0.389958[/C][/ROW]
[ROW][C]30[/C][C]0.072798[/C][C]0.6134[/C][C]0.270785[/C][/ROW]
[ROW][C]31[/C][C]-0.105158[/C][C]-0.8861[/C][C]0.189284[/C][/ROW]
[ROW][C]32[/C][C]0.030817[/C][C]0.2597[/C][C]0.397937[/C][/ROW]
[ROW][C]33[/C][C]0.112649[/C][C]0.9492[/C][C]0.172869[/C][/ROW]
[ROW][C]34[/C][C]0.109184[/C][C]0.92[/C][C]0.180344[/C][/ROW]
[ROW][C]35[/C][C]0.088547[/C][C]0.7461[/C][C]0.229032[/C][/ROW]
[ROW][C]36[/C][C]0.027896[/C][C]0.2351[/C][C]0.40742[/C][/ROW]
[ROW][C]37[/C][C]0.093958[/C][C]0.7917[/C][C]0.215586[/C][/ROW]
[ROW][C]38[/C][C]0.071266[/C][C]0.6005[/C][C]0.275043[/C][/ROW]
[ROW][C]39[/C][C]-0.021981[/C][C]-0.1852[/C][C]0.426793[/C][/ROW]
[ROW][C]40[/C][C]0.010811[/C][C]0.0911[/C][C]0.463836[/C][/ROW]
[ROW][C]41[/C][C]0.051026[/C][C]0.43[/C][C]0.334265[/C][/ROW]
[ROW][C]42[/C][C]0.056111[/C][C]0.4728[/C][C]0.318903[/C][/ROW]
[ROW][C]43[/C][C]0.067997[/C][C]0.5729[/C][C]0.284244[/C][/ROW]
[ROW][C]44[/C][C]0.023962[/C][C]0.2019[/C][C]0.420282[/C][/ROW]
[ROW][C]45[/C][C]0.030065[/C][C]0.2533[/C][C]0.400372[/C][/ROW]
[ROW][C]46[/C][C]0.021468[/C][C]0.1809[/C][C]0.428484[/C][/ROW]
[ROW][C]47[/C][C]0.01821[/C][C]0.1534[/C][C]0.439243[/C][/ROW]
[ROW][C]48[/C][C]0.116641[/C][C]0.9828[/C][C]0.164512[/C][/ROW]
[/TABLE]
Source: https://freestatistics.org/blog/index.php?pk=194242&T=1

Globally Unique Identifier (entire table): ba.freestatistics.org/blog/index.php?pk=194242&T=1

As an alternative you can also use a QR Code:  

The GUIDs for individual cells are displayed in the table below:

Autocorrelation Function
Time lag kACF(k)T-STATP-value
10.2355411.98470.025521
20.0338990.28560.387994
30.2112431.780.03968
40.1821941.53520.06459
50.2463642.07590.020763
6-0.037397-0.31510.3768
7-0.07035-0.59280.277607
80.1025750.86430.195163
9-0.05556-0.46820.320554
10-0.185423-1.56240.06132
110.076380.64360.260957
12-0.101512-0.85540.197617
13-0.108234-0.9120.182428
140.0331920.27970.390269
15-0.085554-0.72090.236673
160.0145480.12260.451391
17-0.21923-1.84730.034438
18-0.207663-1.74980.042236
190.0871520.73440.232576
20-0.150278-1.26630.104778
21-0.233818-1.97020.026359
22-0.216611-1.82520.036089
23-0.205696-1.73320.043698
24-0.136259-1.14810.127383
25-0.112299-0.94620.173616
26-0.188939-1.5920.05791
27-0.115215-0.97080.167466
28-0.025758-0.2170.414399
290.0332880.28050.389958
300.0727980.61340.270785
31-0.105158-0.88610.189284
320.0308170.25970.397937
330.1126490.94920.172869
340.1091840.920.180344
350.0885470.74610.229032
360.0278960.23510.40742
370.0939580.79170.215586
380.0712660.60050.275043
39-0.021981-0.18520.426793
400.0108110.09110.463836
410.0510260.430.334265
420.0561110.47280.318903
430.0679970.57290.284244
440.0239620.20190.420282
450.0300650.25330.400372
460.0214680.18090.428484
470.018210.15340.439243
480.1166410.98280.164512


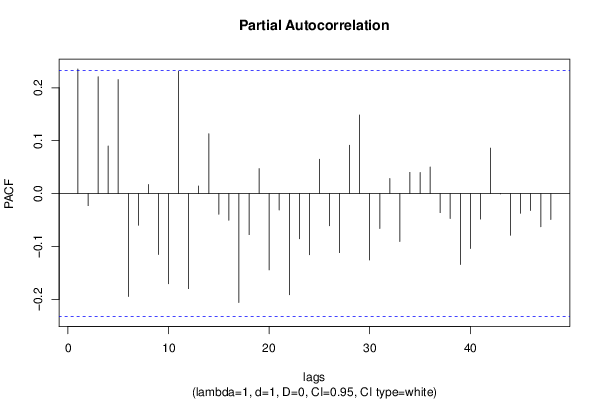
Partial Autocorrelation Function
Time lag kPACF(k)T-STATP-value
10.2355411.98470.025521
2-0.022848-0.19250.423942
30.2208181.86060.033468
40.089980.75820.225425
50.2153981.8150.036876
6-0.194459-1.63850.052867
7-0.059833-0.50420.307854
80.0171380.14440.442795
9-0.115312-0.97160.167265
10-0.1704-1.43580.077723
110.2313741.94960.027588
12-0.179681-1.5140.06723
130.0142720.12030.452308
140.1132370.95420.171622
15-0.039047-0.3290.371555
16-0.050544-0.42590.335738
17-0.205838-1.73440.043592
18-0.077666-0.65440.257475
190.0472260.39790.345937
20-0.144213-1.21520.114165
21-0.031195-0.26290.396711
22-0.191186-1.6110.055813
23-0.085341-0.71910.237222
24-0.115598-0.9740.166669
250.0650320.5480.292715
26-0.060917-0.51330.304668
27-0.111625-0.94060.175057
280.0912850.76920.222167
290.148551.25170.107393
30-0.125518-1.05760.146904
31-0.066098-0.5570.289655
320.0285350.24040.40534
33-0.090524-0.76280.224064
340.0400570.33750.368358
350.0399370.33650.368736
360.0502290.42320.336702
37-0.036084-0.30410.380989
38-0.047281-0.39840.345766
39-0.134111-1.130.131131
40-0.103943-0.87580.192036
41-0.048237-0.40640.342818
420.0859810.72450.235572
43-0.000592-0.0050.498016
44-0.078717-0.66330.25465
45-0.037139-0.31290.377621
46-0.031967-0.26940.394218
47-0.062843-0.52950.299046
48-0.048903-0.41210.340767

\begin{tabular}{lllllllll}
\hline
Partial Autocorrelation Function \tabularnewline
Time lag k & PACF(k) & T-STAT & P-value \tabularnewline
1 & 0.235541 & 1.9847 & 0.025521 \tabularnewline
2 & -0.022848 & -0.1925 & 0.423942 \tabularnewline
3 & 0.220818 & 1.8606 & 0.033468 \tabularnewline
4 & 0.08998 & 0.7582 & 0.225425 \tabularnewline
5 & 0.215398 & 1.815 & 0.036876 \tabularnewline
6 & -0.194459 & -1.6385 & 0.052867 \tabularnewline
7 & -0.059833 & -0.5042 & 0.307854 \tabularnewline
8 & 0.017138 & 0.1444 & 0.442795 \tabularnewline
9 & -0.115312 & -0.9716 & 0.167265 \tabularnewline
10 & -0.1704 & -1.4358 & 0.077723 \tabularnewline
11 & 0.231374 & 1.9496 & 0.027588 \tabularnewline
12 & -0.179681 & -1.514 & 0.06723 \tabularnewline
13 & 0.014272 & 0.1203 & 0.452308 \tabularnewline
14 & 0.113237 & 0.9542 & 0.171622 \tabularnewline
15 & -0.039047 & -0.329 & 0.371555 \tabularnewline
16 & -0.050544 & -0.4259 & 0.335738 \tabularnewline
17 & -0.205838 & -1.7344 & 0.043592 \tabularnewline
18 & -0.077666 & -0.6544 & 0.257475 \tabularnewline
19 & 0.047226 & 0.3979 & 0.345937 \tabularnewline
20 & -0.144213 & -1.2152 & 0.114165 \tabularnewline
21 & -0.031195 & -0.2629 & 0.396711 \tabularnewline
22 & -0.191186 & -1.611 & 0.055813 \tabularnewline
23 & -0.085341 & -0.7191 & 0.237222 \tabularnewline
24 & -0.115598 & -0.974 & 0.166669 \tabularnewline
25 & 0.065032 & 0.548 & 0.292715 \tabularnewline
26 & -0.060917 & -0.5133 & 0.304668 \tabularnewline
27 & -0.111625 & -0.9406 & 0.175057 \tabularnewline
28 & 0.091285 & 0.7692 & 0.222167 \tabularnewline
29 & 0.14855 & 1.2517 & 0.107393 \tabularnewline
30 & -0.125518 & -1.0576 & 0.146904 \tabularnewline
31 & -0.066098 & -0.557 & 0.289655 \tabularnewline
32 & 0.028535 & 0.2404 & 0.40534 \tabularnewline
33 & -0.090524 & -0.7628 & 0.224064 \tabularnewline
34 & 0.040057 & 0.3375 & 0.368358 \tabularnewline
35 & 0.039937 & 0.3365 & 0.368736 \tabularnewline
36 & 0.050229 & 0.4232 & 0.336702 \tabularnewline
37 & -0.036084 & -0.3041 & 0.380989 \tabularnewline
38 & -0.047281 & -0.3984 & 0.345766 \tabularnewline
39 & -0.134111 & -1.13 & 0.131131 \tabularnewline
40 & -0.103943 & -0.8758 & 0.192036 \tabularnewline
41 & -0.048237 & -0.4064 & 0.342818 \tabularnewline
42 & 0.085981 & 0.7245 & 0.235572 \tabularnewline
43 & -0.000592 & -0.005 & 0.498016 \tabularnewline
44 & -0.078717 & -0.6633 & 0.25465 \tabularnewline
45 & -0.037139 & -0.3129 & 0.377621 \tabularnewline
46 & -0.031967 & -0.2694 & 0.394218 \tabularnewline
47 & -0.062843 & -0.5295 & 0.299046 \tabularnewline
48 & -0.048903 & -0.4121 & 0.340767 \tabularnewline
\hline
\end{tabular}
%Source: https://freestatistics.org/blog/index.php?pk=194242&T=2

[TABLE]
[ROW][C]Partial Autocorrelation Function[/C][/ROW]
[ROW][C]Time lag k[/C][C]PACF(k)[/C][C]T-STAT[/C][C]P-value[/C][/ROW]
[ROW][C]1[/C][C]0.235541[/C][C]1.9847[/C][C]0.025521[/C][/ROW]
[ROW][C]2[/C][C]-0.022848[/C][C]-0.1925[/C][C]0.423942[/C][/ROW]
[ROW][C]3[/C][C]0.220818[/C][C]1.8606[/C][C]0.033468[/C][/ROW]
[ROW][C]4[/C][C]0.08998[/C][C]0.7582[/C][C]0.225425[/C][/ROW]
[ROW][C]5[/C][C]0.215398[/C][C]1.815[/C][C]0.036876[/C][/ROW]
[ROW][C]6[/C][C]-0.194459[/C][C]-1.6385[/C][C]0.052867[/C][/ROW]
[ROW][C]7[/C][C]-0.059833[/C][C]-0.5042[/C][C]0.307854[/C][/ROW]
[ROW][C]8[/C][C]0.017138[/C][C]0.1444[/C][C]0.442795[/C][/ROW]
[ROW][C]9[/C][C]-0.115312[/C][C]-0.9716[/C][C]0.167265[/C][/ROW]
[ROW][C]10[/C][C]-0.1704[/C][C]-1.4358[/C][C]0.077723[/C][/ROW]
[ROW][C]11[/C][C]0.231374[/C][C]1.9496[/C][C]0.027588[/C][/ROW]
[ROW][C]12[/C][C]-0.179681[/C][C]-1.514[/C][C]0.06723[/C][/ROW]
[ROW][C]13[/C][C]0.014272[/C][C]0.1203[/C][C]0.452308[/C][/ROW]
[ROW][C]14[/C][C]0.113237[/C][C]0.9542[/C][C]0.171622[/C][/ROW]
[ROW][C]15[/C][C]-0.039047[/C][C]-0.329[/C][C]0.371555[/C][/ROW]
[ROW][C]16[/C][C]-0.050544[/C][C]-0.4259[/C][C]0.335738[/C][/ROW]
[ROW][C]17[/C][C]-0.205838[/C][C]-1.7344[/C][C]0.043592[/C][/ROW]
[ROW][C]18[/C][C]-0.077666[/C][C]-0.6544[/C][C]0.257475[/C][/ROW]
[ROW][C]19[/C][C]0.047226[/C][C]0.3979[/C][C]0.345937[/C][/ROW]
[ROW][C]20[/C][C]-0.144213[/C][C]-1.2152[/C][C]0.114165[/C][/ROW]
[ROW][C]21[/C][C]-0.031195[/C][C]-0.2629[/C][C]0.396711[/C][/ROW]
[ROW][C]22[/C][C]-0.191186[/C][C]-1.611[/C][C]0.055813[/C][/ROW]
[ROW][C]23[/C][C]-0.085341[/C][C]-0.7191[/C][C]0.237222[/C][/ROW]
[ROW][C]24[/C][C]-0.115598[/C][C]-0.974[/C][C]0.166669[/C][/ROW]
[ROW][C]25[/C][C]0.065032[/C][C]0.548[/C][C]0.292715[/C][/ROW]
[ROW][C]26[/C][C]-0.060917[/C][C]-0.5133[/C][C]0.304668[/C][/ROW]
[ROW][C]27[/C][C]-0.111625[/C][C]-0.9406[/C][C]0.175057[/C][/ROW]
[ROW][C]28[/C][C]0.091285[/C][C]0.7692[/C][C]0.222167[/C][/ROW]
[ROW][C]29[/C][C]0.14855[/C][C]1.2517[/C][C]0.107393[/C][/ROW]
[ROW][C]30[/C][C]-0.125518[/C][C]-1.0576[/C][C]0.146904[/C][/ROW]
[ROW][C]31[/C][C]-0.066098[/C][C]-0.557[/C][C]0.289655[/C][/ROW]
[ROW][C]32[/C][C]0.028535[/C][C]0.2404[/C][C]0.40534[/C][/ROW]
[ROW][C]33[/C][C]-0.090524[/C][C]-0.7628[/C][C]0.224064[/C][/ROW]
[ROW][C]34[/C][C]0.040057[/C][C]0.3375[/C][C]0.368358[/C][/ROW]
[ROW][C]35[/C][C]0.039937[/C][C]0.3365[/C][C]0.368736[/C][/ROW]
[ROW][C]36[/C][C]0.050229[/C][C]0.4232[/C][C]0.336702[/C][/ROW]
[ROW][C]37[/C][C]-0.036084[/C][C]-0.3041[/C][C]0.380989[/C][/ROW]
[ROW][C]38[/C][C]-0.047281[/C][C]-0.3984[/C][C]0.345766[/C][/ROW]
[ROW][C]39[/C][C]-0.134111[/C][C]-1.13[/C][C]0.131131[/C][/ROW]
[ROW][C]40[/C][C]-0.103943[/C][C]-0.8758[/C][C]0.192036[/C][/ROW]
[ROW][C]41[/C][C]-0.048237[/C][C]-0.4064[/C][C]0.342818[/C][/ROW]
[ROW][C]42[/C][C]0.085981[/C][C]0.7245[/C][C]0.235572[/C][/ROW]
[ROW][C]43[/C][C]-0.000592[/C][C]-0.005[/C][C]0.498016[/C][/ROW]
[ROW][C]44[/C][C]-0.078717[/C][C]-0.6633[/C][C]0.25465[/C][/ROW]
[ROW][C]45[/C][C]-0.037139[/C][C]-0.3129[/C][C]0.377621[/C][/ROW]
[ROW][C]46[/C][C]-0.031967[/C][C]-0.2694[/C][C]0.394218[/C][/ROW]
[ROW][C]47[/C][C]-0.062843[/C][C]-0.5295[/C][C]0.299046[/C][/ROW]
[ROW][C]48[/C][C]-0.048903[/C][C]-0.4121[/C][C]0.340767[/C][/ROW]
[/TABLE]
Source: https://freestatistics.org/blog/index.php?pk=194242&T=2

Globally Unique Identifier (entire table): ba.freestatistics.org/blog/index.php?pk=194242&T=2

As an alternative you can also use a QR Code:  

The GUIDs for individual cells are displayed in the table below:

Partial Autocorrelation Function
Time lag kPACF(k)T-STATP-value
10.2355411.98470.025521
2-0.022848-0.19250.423942
30.2208181.86060.033468
40.089980.75820.225425
50.2153981.8150.036876
6-0.194459-1.63850.052867
7-0.059833-0.50420.307854
80.0171380.14440.442795
9-0.115312-0.97160.167265
10-0.1704-1.43580.077723
110.2313741.94960.027588
12-0.179681-1.5140.06723
130.0142720.12030.452308
140.1132370.95420.171622
15-0.039047-0.3290.371555
16-0.050544-0.42590.335738
17-0.205838-1.73440.043592
18-0.077666-0.65440.257475
190.0472260.39790.345937
20-0.144213-1.21520.114165
21-0.031195-0.26290.396711
22-0.191186-1.6110.055813
23-0.085341-0.71910.237222
24-0.115598-0.9740.166669
250.0650320.5480.292715
26-0.060917-0.51330.304668
27-0.111625-0.94060.175057
280.0912850.76920.222167
290.148551.25170.107393
30-0.125518-1.05760.146904
31-0.066098-0.5570.289655
320.0285350.24040.40534
33-0.090524-0.76280.224064
340.0400570.33750.368358
350.0399370.33650.368736
360.0502290.42320.336702
37-0.036084-0.30410.380989
38-0.047281-0.39840.345766
39-0.134111-1.130.131131
40-0.103943-0.87580.192036
41-0.048237-0.40640.342818
420.0859810.72450.235572
43-0.000592-0.0050.498016
44-0.078717-0.66330.25465
45-0.037139-0.31290.377621
46-0.031967-0.26940.394218
47-0.062843-0.52950.299046
48-0.048903-0.41210.340767


Parameters (Session):
par1 = 48 ; par2 = 1 ; par3 = 1 ; par4 = 0 ; par5 = 12 ; par6 = White Noise ; par7 = 0.95 ;
Parameters (R input):
par1 = 48 ; par2 = 1 ; par3 = 1 ; par4 = 0 ; par5 = 12 ; par6 = White Noise ; par7 = 0.95 ; par8 = ;
R code (references can be found in the software module):
if (par1 == 'Default') {
par1 = 10*log10(length(x))
} else {
par1 <- as.numeric(par1)
}
par2 <- as.numeric(par2)
par3 <- as.numeric(par3)
par4 <- as.numeric(par4)
par5 <- as.numeric(par5)
if (par6 == 'White Noise') par6 <- 'white' else par6 <- 'ma'
par7 <- as.numeric(par7)
if (par8 != '') par8 <- as.numeric(par8)
ox <- x
if (par8 == '') {
if (par2 == 0) {
x <- log(x)
} else {
x <- (x ^ par2 - 1) / par2
}
} else {
x <- log(x,base=par8)
}
if (par3 > 0) x <- diff(x,lag=1,difference=par3)
if (par4 > 0) x <- diff(x,lag=par5,difference=par4)
bitmap(file='picts.png')
op <- par(mfrow=c(2,1))
plot(ox,type='l',main='Original Time Series',xlab='time',ylab='value')
if (par8=='') {
mytitle <- paste('Working Time Series (lambda=',par2,', d=',par3,', D=',par4,')',sep='')
mysub <- paste('(lambda=',par2,', d=',par3,', D=',par4,', CI=', par7, ', CI type=',par6,')',sep='')
} else {
mytitle <- paste('Working Time Series (base=',par8,', d=',par3,', D=',par4,')',sep='')
mysub <- paste('(base=',par8,', d=',par3,', D=',par4,', CI=', par7, ', CI type=',par6,')',sep='')
}
plot(x,type='l', main=mytitle,xlab='time',ylab='value')
par(op)
dev.off()
bitmap(file='pic1.png')
racf <- acf(x, par1, main='Autocorrelation', xlab='time lag', ylab='ACF', ci.type=par6, ci=par7, sub=mysub)
dev.off()
bitmap(file='pic2.png')
rpacf <- pacf(x,par1,main='Partial Autocorrelation',xlab='lags',ylab='PACF',sub=mysub)
dev.off()
(myacf <- c(racf$acf))
(mypacf <- c(rpacf$acf))
lengthx <- length(x)
sqrtn <- sqrt(lengthx)
load(file='createtable')
a<-table.start()
a<-table.row.start(a)
a<-table.element(a,'Autocorrelation Function',4,TRUE)
a<-table.row.end(a)
a<-table.row.start(a)
a<-table.element(a,'Time lag k',header=TRUE)
a<-table.element(a,hyperlink('basics.htm','ACF(k)','click here for more information about the Autocorrelation Function'),header=TRUE)
a<-table.element(a,'T-STAT',header=TRUE)
a<-table.element(a,'P-value',header=TRUE)
a<-table.row.end(a)
for (i in 2:(par1+1)) {
a<-table.row.start(a)
a<-table.element(a,i-1,header=TRUE)
a<-table.element(a,round(myacf[i],6))
mytstat <- myacf[i]*sqrtn
a<-table.element(a,round(mytstat,4))
a<-table.element(a,round(1-pt(abs(mytstat),lengthx),6))
a<-table.row.end(a)
}
a<-table.end(a)
table.save(a,file='mytable.tab')
a<-table.start()
a<-table.row.start(a)
a<-table.element(a,'Partial Autocorrelation Function',4,TRUE)
a<-table.row.end(a)
a<-table.row.start(a)
a<-table.element(a,'Time lag k',header=TRUE)
a<-table.element(a,hyperlink('basics.htm','PACF(k)','click here for more information about the Partial Autocorrelation Function'),header=TRUE)
a<-table.element(a,'T-STAT',header=TRUE)
a<-table.element(a,'P-value',header=TRUE)
a<-table.row.end(a)
for (i in 1:par1) {
a<-table.row.start(a)
a<-table.element(a,i,header=TRUE)
a<-table.element(a,round(mypacf[i],6))
mytstat <- mypacf[i]*sqrtn
a<-table.element(a,round(mytstat,4))
a<-table.element(a,round(1-pt(abs(mytstat),lengthx),6))
a<-table.row.end(a)
}
a<-table.end(a)
table.save(a,file='mytable1.tab')