Free Statistics

of Irreproducible Research!

Author's title

Author*Unverified author*
R Software Modulerwasp_autocorrelation.wasp
Title produced by software(Partial) Autocorrelation Function
Date of computationThu, 29 Nov 2012 05:27:49 -0500
Cite this page as followsStatistical Computations at FreeStatistics.org, Office for Research Development and Education, URL https://freestatistics.org/blog/index.php?v=date/2012/Nov/29/t1354184875dz3txc2lid9e37d.htm/, Retrieved Sat, 27 Apr 2024 19:38:09 +0000
Statistical Computations at FreeStatistics.org, Office for Research Development and Education, URL https://freestatistics.org/blog/index.php?pk=194241, Retrieved Sat, 27 Apr 2024 19:38:09 +0000
QR Codes:

Original text written by user:
IsPrivate?No (this computation is public)
User-defined keywords
Estimated Impact110
Family? (F = Feedback message, R = changed R code, M = changed R Module, P = changed Parameters, D = changed Data)
-       [(Partial) Autocorrelation Function] [] [2012-11-29 10:27:49] [0dfc9291120e0017631158d00b067a5a] [Current]
Feedback Forum

Post a new message
Dataseries X:
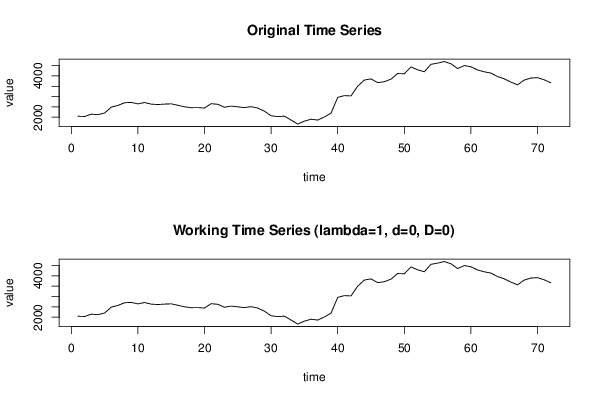
2048
2037
2149
2124
2205
2489
2573
2702
2718
2646
2712
2634
2614
2637
2649
2579
2505
2462
2467
2447
2656
2626
2483
2540
2503
2467
2513
2443
2293
2071
2030
2052
1864
1670
1811
1905
1863
2014
2198
2962
3047
3033
3504
3801
3858
3674
3721
3844
4117
4105
4435
4296
4203
4563
4621
4697
4591
4357
4503
4444
4291
4200
4139
3970
3862
3702
3570
3801
3896
3918
3813
3667


Summary of computational transaction
Raw Inputview raw input (R code)
Raw Outputview raw output of R engine
Computing time3 seconds
R Server'Sir Ronald Aylmer Fisher' @ fisher.wessa.net

\begin{tabular}{lllllllll}
\hline
Summary of computational transaction \tabularnewline
Raw Input & view raw input (R code)  \tabularnewline
Raw Output & view raw output of R engine  \tabularnewline
Computing time & 3 seconds \tabularnewline
R Server & 'Sir Ronald Aylmer Fisher' @ fisher.wessa.net \tabularnewline
\hline
\end{tabular}
%Source: https://freestatistics.org/blog/index.php?pk=194241&T=0

[TABLE]
[ROW][C]Summary of computational transaction[/C][/ROW]
[ROW][C]Raw Input[/C][C]view raw input (R code) [/C][/ROW]
[ROW][C]Raw Output[/C][C]view raw output of R engine [/C][/ROW]
[ROW][C]Computing time[/C][C]3 seconds[/C][/ROW]
[ROW][C]R Server[/C][C]'Sir Ronald Aylmer Fisher' @ fisher.wessa.net[/C][/ROW]
[/TABLE]
Source: https://freestatistics.org/blog/index.php?pk=194241&T=0

Globally Unique Identifier (entire table): ba.freestatistics.org/blog/index.php?pk=194241&T=0

As an alternative you can also use a QR Code:  

The GUIDs for individual cells are displayed in the table below:

Summary of computational transaction
Raw Inputview raw input (R code)
Raw Outputview raw output of R engine
Computing time3 seconds
R Server'Sir Ronald Aylmer Fisher' @ fisher.wessa.net


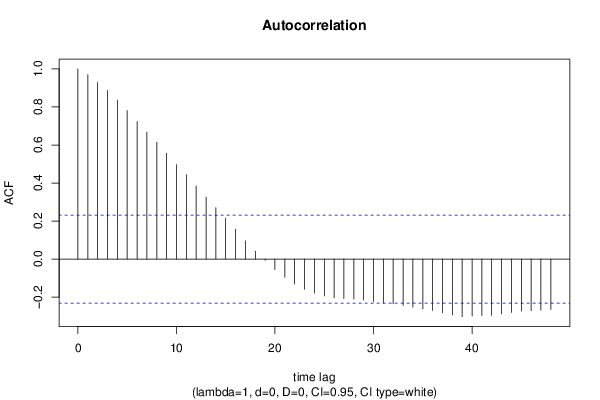
Autocorrelation Function
Time lag kACF(k)T-STATP-value
10.9696228.22750
20.9285267.87880
30.8864917.52210
40.8360087.09380
50.7808196.62550
60.7238856.14240
70.6679795.6680
80.6147835.21661e-06
90.5565954.72296e-06
100.4967084.21473.6e-05
110.4432983.76150.000171
120.3841023.25920.000854
130.3257782.76430.00362
140.2702592.29320.012379
150.2144381.81960.036491
160.1571081.33310.09335
170.0958480.81330.209365
180.0413270.35070.363429
19-0.006157-0.05220.479238
20-0.054362-0.46130.322995
21-0.095211-0.80790.210907
22-0.130614-1.10830.13571
23-0.158478-1.34470.091466
24-0.178972-1.51860.066618
25-0.193327-1.64040.052639
26-0.203849-1.72970.043983
27-0.207066-1.7570.041583
28-0.210114-1.78290.039411
29-0.21525-1.82650.035963
30-0.223453-1.89610.030982
31-0.230939-1.95960.026958
32-0.235115-1.9950.024913
33-0.243666-2.06760.021137
34-0.252598-2.14340.017731
35-0.26139-2.2180.014856
36-0.270406-2.29450.012341
37-0.281934-2.39230.009678
38-0.293367-2.48930.007555
39-0.302713-2.56860.006142
40-0.299282-2.53950.006631
41-0.296539-2.51620.007046
42-0.295611-2.50830.007192
43-0.288351-2.44670.008429
44-0.280125-2.37690.010058
45-0.273051-2.31690.011678
46-0.271025-2.29970.012183
47-0.268366-2.27720.012875
48-0.264375-2.24330.013978

\begin{tabular}{lllllllll}
\hline
Autocorrelation Function \tabularnewline
Time lag k & ACF(k) & T-STAT & P-value \tabularnewline
1 & 0.969622 & 8.2275 & 0 \tabularnewline
2 & 0.928526 & 7.8788 & 0 \tabularnewline
3 & 0.886491 & 7.5221 & 0 \tabularnewline
4 & 0.836008 & 7.0938 & 0 \tabularnewline
5 & 0.780819 & 6.6255 & 0 \tabularnewline
6 & 0.723885 & 6.1424 & 0 \tabularnewline
7 & 0.667979 & 5.668 & 0 \tabularnewline
8 & 0.614783 & 5.2166 & 1e-06 \tabularnewline
9 & 0.556595 & 4.7229 & 6e-06 \tabularnewline
10 & 0.496708 & 4.2147 & 3.6e-05 \tabularnewline
11 & 0.443298 & 3.7615 & 0.000171 \tabularnewline
12 & 0.384102 & 3.2592 & 0.000854 \tabularnewline
13 & 0.325778 & 2.7643 & 0.00362 \tabularnewline
14 & 0.270259 & 2.2932 & 0.012379 \tabularnewline
15 & 0.214438 & 1.8196 & 0.036491 \tabularnewline
16 & 0.157108 & 1.3331 & 0.09335 \tabularnewline
17 & 0.095848 & 0.8133 & 0.209365 \tabularnewline
18 & 0.041327 & 0.3507 & 0.363429 \tabularnewline
19 & -0.006157 & -0.0522 & 0.479238 \tabularnewline
20 & -0.054362 & -0.4613 & 0.322995 \tabularnewline
21 & -0.095211 & -0.8079 & 0.210907 \tabularnewline
22 & -0.130614 & -1.1083 & 0.13571 \tabularnewline
23 & -0.158478 & -1.3447 & 0.091466 \tabularnewline
24 & -0.178972 & -1.5186 & 0.066618 \tabularnewline
25 & -0.193327 & -1.6404 & 0.052639 \tabularnewline
26 & -0.203849 & -1.7297 & 0.043983 \tabularnewline
27 & -0.207066 & -1.757 & 0.041583 \tabularnewline
28 & -0.210114 & -1.7829 & 0.039411 \tabularnewline
29 & -0.21525 & -1.8265 & 0.035963 \tabularnewline
30 & -0.223453 & -1.8961 & 0.030982 \tabularnewline
31 & -0.230939 & -1.9596 & 0.026958 \tabularnewline
32 & -0.235115 & -1.995 & 0.024913 \tabularnewline
33 & -0.243666 & -2.0676 & 0.021137 \tabularnewline
34 & -0.252598 & -2.1434 & 0.017731 \tabularnewline
35 & -0.26139 & -2.218 & 0.014856 \tabularnewline
36 & -0.270406 & -2.2945 & 0.012341 \tabularnewline
37 & -0.281934 & -2.3923 & 0.009678 \tabularnewline
38 & -0.293367 & -2.4893 & 0.007555 \tabularnewline
39 & -0.302713 & -2.5686 & 0.006142 \tabularnewline
40 & -0.299282 & -2.5395 & 0.006631 \tabularnewline
41 & -0.296539 & -2.5162 & 0.007046 \tabularnewline
42 & -0.295611 & -2.5083 & 0.007192 \tabularnewline
43 & -0.288351 & -2.4467 & 0.008429 \tabularnewline
44 & -0.280125 & -2.3769 & 0.010058 \tabularnewline
45 & -0.273051 & -2.3169 & 0.011678 \tabularnewline
46 & -0.271025 & -2.2997 & 0.012183 \tabularnewline
47 & -0.268366 & -2.2772 & 0.012875 \tabularnewline
48 & -0.264375 & -2.2433 & 0.013978 \tabularnewline
\hline
\end{tabular}
%Source: https://freestatistics.org/blog/index.php?pk=194241&T=1

[TABLE]
[ROW][C]Autocorrelation Function[/C][/ROW]
[ROW][C]Time lag k[/C][C]ACF(k)[/C][C]T-STAT[/C][C]P-value[/C][/ROW]
[ROW][C]1[/C][C]0.969622[/C][C]8.2275[/C][C]0[/C][/ROW]
[ROW][C]2[/C][C]0.928526[/C][C]7.8788[/C][C]0[/C][/ROW]
[ROW][C]3[/C][C]0.886491[/C][C]7.5221[/C][C]0[/C][/ROW]
[ROW][C]4[/C][C]0.836008[/C][C]7.0938[/C][C]0[/C][/ROW]
[ROW][C]5[/C][C]0.780819[/C][C]6.6255[/C][C]0[/C][/ROW]
[ROW][C]6[/C][C]0.723885[/C][C]6.1424[/C][C]0[/C][/ROW]
[ROW][C]7[/C][C]0.667979[/C][C]5.668[/C][C]0[/C][/ROW]
[ROW][C]8[/C][C]0.614783[/C][C]5.2166[/C][C]1e-06[/C][/ROW]
[ROW][C]9[/C][C]0.556595[/C][C]4.7229[/C][C]6e-06[/C][/ROW]
[ROW][C]10[/C][C]0.496708[/C][C]4.2147[/C][C]3.6e-05[/C][/ROW]
[ROW][C]11[/C][C]0.443298[/C][C]3.7615[/C][C]0.000171[/C][/ROW]
[ROW][C]12[/C][C]0.384102[/C][C]3.2592[/C][C]0.000854[/C][/ROW]
[ROW][C]13[/C][C]0.325778[/C][C]2.7643[/C][C]0.00362[/C][/ROW]
[ROW][C]14[/C][C]0.270259[/C][C]2.2932[/C][C]0.012379[/C][/ROW]
[ROW][C]15[/C][C]0.214438[/C][C]1.8196[/C][C]0.036491[/C][/ROW]
[ROW][C]16[/C][C]0.157108[/C][C]1.3331[/C][C]0.09335[/C][/ROW]
[ROW][C]17[/C][C]0.095848[/C][C]0.8133[/C][C]0.209365[/C][/ROW]
[ROW][C]18[/C][C]0.041327[/C][C]0.3507[/C][C]0.363429[/C][/ROW]
[ROW][C]19[/C][C]-0.006157[/C][C]-0.0522[/C][C]0.479238[/C][/ROW]
[ROW][C]20[/C][C]-0.054362[/C][C]-0.4613[/C][C]0.322995[/C][/ROW]
[ROW][C]21[/C][C]-0.095211[/C][C]-0.8079[/C][C]0.210907[/C][/ROW]
[ROW][C]22[/C][C]-0.130614[/C][C]-1.1083[/C][C]0.13571[/C][/ROW]
[ROW][C]23[/C][C]-0.158478[/C][C]-1.3447[/C][C]0.091466[/C][/ROW]
[ROW][C]24[/C][C]-0.178972[/C][C]-1.5186[/C][C]0.066618[/C][/ROW]
[ROW][C]25[/C][C]-0.193327[/C][C]-1.6404[/C][C]0.052639[/C][/ROW]
[ROW][C]26[/C][C]-0.203849[/C][C]-1.7297[/C][C]0.043983[/C][/ROW]
[ROW][C]27[/C][C]-0.207066[/C][C]-1.757[/C][C]0.041583[/C][/ROW]
[ROW][C]28[/C][C]-0.210114[/C][C]-1.7829[/C][C]0.039411[/C][/ROW]
[ROW][C]29[/C][C]-0.21525[/C][C]-1.8265[/C][C]0.035963[/C][/ROW]
[ROW][C]30[/C][C]-0.223453[/C][C]-1.8961[/C][C]0.030982[/C][/ROW]
[ROW][C]31[/C][C]-0.230939[/C][C]-1.9596[/C][C]0.026958[/C][/ROW]
[ROW][C]32[/C][C]-0.235115[/C][C]-1.995[/C][C]0.024913[/C][/ROW]
[ROW][C]33[/C][C]-0.243666[/C][C]-2.0676[/C][C]0.021137[/C][/ROW]
[ROW][C]34[/C][C]-0.252598[/C][C]-2.1434[/C][C]0.017731[/C][/ROW]
[ROW][C]35[/C][C]-0.26139[/C][C]-2.218[/C][C]0.014856[/C][/ROW]
[ROW][C]36[/C][C]-0.270406[/C][C]-2.2945[/C][C]0.012341[/C][/ROW]
[ROW][C]37[/C][C]-0.281934[/C][C]-2.3923[/C][C]0.009678[/C][/ROW]
[ROW][C]38[/C][C]-0.293367[/C][C]-2.4893[/C][C]0.007555[/C][/ROW]
[ROW][C]39[/C][C]-0.302713[/C][C]-2.5686[/C][C]0.006142[/C][/ROW]
[ROW][C]40[/C][C]-0.299282[/C][C]-2.5395[/C][C]0.006631[/C][/ROW]
[ROW][C]41[/C][C]-0.296539[/C][C]-2.5162[/C][C]0.007046[/C][/ROW]
[ROW][C]42[/C][C]-0.295611[/C][C]-2.5083[/C][C]0.007192[/C][/ROW]
[ROW][C]43[/C][C]-0.288351[/C][C]-2.4467[/C][C]0.008429[/C][/ROW]
[ROW][C]44[/C][C]-0.280125[/C][C]-2.3769[/C][C]0.010058[/C][/ROW]
[ROW][C]45[/C][C]-0.273051[/C][C]-2.3169[/C][C]0.011678[/C][/ROW]
[ROW][C]46[/C][C]-0.271025[/C][C]-2.2997[/C][C]0.012183[/C][/ROW]
[ROW][C]47[/C][C]-0.268366[/C][C]-2.2772[/C][C]0.012875[/C][/ROW]
[ROW][C]48[/C][C]-0.264375[/C][C]-2.2433[/C][C]0.013978[/C][/ROW]
[/TABLE]
Source: https://freestatistics.org/blog/index.php?pk=194241&T=1

Globally Unique Identifier (entire table): ba.freestatistics.org/blog/index.php?pk=194241&T=1

As an alternative you can also use a QR Code:  

The GUIDs for individual cells are displayed in the table below:

Autocorrelation Function
Time lag kACF(k)T-STATP-value
10.9696228.22750
20.9285267.87880
30.8864917.52210
40.8360087.09380
50.7808196.62550
60.7238856.14240
70.6679795.6680
80.6147835.21661e-06
90.5565954.72296e-06
100.4967084.21473.6e-05
110.4432983.76150.000171
120.3841023.25920.000854
130.3257782.76430.00362
140.2702592.29320.012379
150.2144381.81960.036491
160.1571081.33310.09335
170.0958480.81330.209365
180.0413270.35070.363429
19-0.006157-0.05220.479238
20-0.054362-0.46130.322995
21-0.095211-0.80790.210907
22-0.130614-1.10830.13571
23-0.158478-1.34470.091466
24-0.178972-1.51860.066618
25-0.193327-1.64040.052639
26-0.203849-1.72970.043983
27-0.207066-1.7570.041583
28-0.210114-1.78290.039411
29-0.21525-1.82650.035963
30-0.223453-1.89610.030982
31-0.230939-1.95960.026958
32-0.235115-1.9950.024913
33-0.243666-2.06760.021137
34-0.252598-2.14340.017731
35-0.26139-2.2180.014856
36-0.270406-2.29450.012341
37-0.281934-2.39230.009678
38-0.293367-2.48930.007555
39-0.302713-2.56860.006142
40-0.299282-2.53950.006631
41-0.296539-2.51620.007046
42-0.295611-2.50830.007192
43-0.288351-2.44670.008429
44-0.280125-2.37690.010058
45-0.273051-2.31690.011678
46-0.271025-2.29970.012183
47-0.268366-2.27720.012875
48-0.264375-2.24330.013978


Partial Autocorrelation Function
Time lag kPACF(k)T-STATP-value
10.9696228.22750
2-0.194559-1.65090.051559
3-0.005986-0.05080.479815
4-0.169144-1.43520.077776
5-0.060587-0.51410.304379
6-0.048201-0.4090.341878
70.0089010.07550.470003
80.0182710.1550.438615
9-0.129377-1.09780.137974
10-0.04117-0.34930.363928
110.0607180.51520.303993
12-0.16336-1.38620.084989
130.0321380.27270.392932
14-0.035596-0.3020.381746
15-0.042078-0.3570.36105
16-0.084703-0.71870.237316
17-0.113326-0.96160.169734
180.1035280.87850.191307
190.0028460.02410.4904
20-0.050564-0.42910.334583
210.0950070.80620.211403
22-0.071992-0.61090.271604
230.1069660.90760.183549
240.018040.15310.439385
250.0573140.48630.314106
26-0.023629-0.20050.420828
270.0279080.23680.406741
28-0.023837-0.20230.420141
29-0.108231-0.91840.180745
30-0.115235-0.97780.165723
310.0548990.46580.321369
32-0.017696-0.15020.440529
33-0.091366-0.77530.22036
34-0.040783-0.34610.365155
35-0.060958-0.51720.303285
36-0.026553-0.22530.411188
37-0.087996-0.74670.228846
380.0007660.00650.497416
39-0.005689-0.04830.480817
400.1939561.64580.052085
41-0.063094-0.53540.297021
42-0.030817-0.26150.397229
430.0506750.430.334243
440.0207460.1760.430381
450.0317740.26960.394116
46-0.134468-1.1410.128826
470.0408380.34650.364981
48-0.024156-0.2050.419085

\begin{tabular}{lllllllll}
\hline
Partial Autocorrelation Function \tabularnewline
Time lag k & PACF(k) & T-STAT & P-value \tabularnewline
1 & 0.969622 & 8.2275 & 0 \tabularnewline
2 & -0.194559 & -1.6509 & 0.051559 \tabularnewline
3 & -0.005986 & -0.0508 & 0.479815 \tabularnewline
4 & -0.169144 & -1.4352 & 0.077776 \tabularnewline
5 & -0.060587 & -0.5141 & 0.304379 \tabularnewline
6 & -0.048201 & -0.409 & 0.341878 \tabularnewline
7 & 0.008901 & 0.0755 & 0.470003 \tabularnewline
8 & 0.018271 & 0.155 & 0.438615 \tabularnewline
9 & -0.129377 & -1.0978 & 0.137974 \tabularnewline
10 & -0.04117 & -0.3493 & 0.363928 \tabularnewline
11 & 0.060718 & 0.5152 & 0.303993 \tabularnewline
12 & -0.16336 & -1.3862 & 0.084989 \tabularnewline
13 & 0.032138 & 0.2727 & 0.392932 \tabularnewline
14 & -0.035596 & -0.302 & 0.381746 \tabularnewline
15 & -0.042078 & -0.357 & 0.36105 \tabularnewline
16 & -0.084703 & -0.7187 & 0.237316 \tabularnewline
17 & -0.113326 & -0.9616 & 0.169734 \tabularnewline
18 & 0.103528 & 0.8785 & 0.191307 \tabularnewline
19 & 0.002846 & 0.0241 & 0.4904 \tabularnewline
20 & -0.050564 & -0.4291 & 0.334583 \tabularnewline
21 & 0.095007 & 0.8062 & 0.211403 \tabularnewline
22 & -0.071992 & -0.6109 & 0.271604 \tabularnewline
23 & 0.106966 & 0.9076 & 0.183549 \tabularnewline
24 & 0.01804 & 0.1531 & 0.439385 \tabularnewline
25 & 0.057314 & 0.4863 & 0.314106 \tabularnewline
26 & -0.023629 & -0.2005 & 0.420828 \tabularnewline
27 & 0.027908 & 0.2368 & 0.406741 \tabularnewline
28 & -0.023837 & -0.2023 & 0.420141 \tabularnewline
29 & -0.108231 & -0.9184 & 0.180745 \tabularnewline
30 & -0.115235 & -0.9778 & 0.165723 \tabularnewline
31 & 0.054899 & 0.4658 & 0.321369 \tabularnewline
32 & -0.017696 & -0.1502 & 0.440529 \tabularnewline
33 & -0.091366 & -0.7753 & 0.22036 \tabularnewline
34 & -0.040783 & -0.3461 & 0.365155 \tabularnewline
35 & -0.060958 & -0.5172 & 0.303285 \tabularnewline
36 & -0.026553 & -0.2253 & 0.411188 \tabularnewline
37 & -0.087996 & -0.7467 & 0.228846 \tabularnewline
38 & 0.000766 & 0.0065 & 0.497416 \tabularnewline
39 & -0.005689 & -0.0483 & 0.480817 \tabularnewline
40 & 0.193956 & 1.6458 & 0.052085 \tabularnewline
41 & -0.063094 & -0.5354 & 0.297021 \tabularnewline
42 & -0.030817 & -0.2615 & 0.397229 \tabularnewline
43 & 0.050675 & 0.43 & 0.334243 \tabularnewline
44 & 0.020746 & 0.176 & 0.430381 \tabularnewline
45 & 0.031774 & 0.2696 & 0.394116 \tabularnewline
46 & -0.134468 & -1.141 & 0.128826 \tabularnewline
47 & 0.040838 & 0.3465 & 0.364981 \tabularnewline
48 & -0.024156 & -0.205 & 0.419085 \tabularnewline
\hline
\end{tabular}
%Source: https://freestatistics.org/blog/index.php?pk=194241&T=2

[TABLE]
[ROW][C]Partial Autocorrelation Function[/C][/ROW]
[ROW][C]Time lag k[/C][C]PACF(k)[/C][C]T-STAT[/C][C]P-value[/C][/ROW]
[ROW][C]1[/C][C]0.969622[/C][C]8.2275[/C][C]0[/C][/ROW]
[ROW][C]2[/C][C]-0.194559[/C][C]-1.6509[/C][C]0.051559[/C][/ROW]
[ROW][C]3[/C][C]-0.005986[/C][C]-0.0508[/C][C]0.479815[/C][/ROW]
[ROW][C]4[/C][C]-0.169144[/C][C]-1.4352[/C][C]0.077776[/C][/ROW]
[ROW][C]5[/C][C]-0.060587[/C][C]-0.5141[/C][C]0.304379[/C][/ROW]
[ROW][C]6[/C][C]-0.048201[/C][C]-0.409[/C][C]0.341878[/C][/ROW]
[ROW][C]7[/C][C]0.008901[/C][C]0.0755[/C][C]0.470003[/C][/ROW]
[ROW][C]8[/C][C]0.018271[/C][C]0.155[/C][C]0.438615[/C][/ROW]
[ROW][C]9[/C][C]-0.129377[/C][C]-1.0978[/C][C]0.137974[/C][/ROW]
[ROW][C]10[/C][C]-0.04117[/C][C]-0.3493[/C][C]0.363928[/C][/ROW]
[ROW][C]11[/C][C]0.060718[/C][C]0.5152[/C][C]0.303993[/C][/ROW]
[ROW][C]12[/C][C]-0.16336[/C][C]-1.3862[/C][C]0.084989[/C][/ROW]
[ROW][C]13[/C][C]0.032138[/C][C]0.2727[/C][C]0.392932[/C][/ROW]
[ROW][C]14[/C][C]-0.035596[/C][C]-0.302[/C][C]0.381746[/C][/ROW]
[ROW][C]15[/C][C]-0.042078[/C][C]-0.357[/C][C]0.36105[/C][/ROW]
[ROW][C]16[/C][C]-0.084703[/C][C]-0.7187[/C][C]0.237316[/C][/ROW]
[ROW][C]17[/C][C]-0.113326[/C][C]-0.9616[/C][C]0.169734[/C][/ROW]
[ROW][C]18[/C][C]0.103528[/C][C]0.8785[/C][C]0.191307[/C][/ROW]
[ROW][C]19[/C][C]0.002846[/C][C]0.0241[/C][C]0.4904[/C][/ROW]
[ROW][C]20[/C][C]-0.050564[/C][C]-0.4291[/C][C]0.334583[/C][/ROW]
[ROW][C]21[/C][C]0.095007[/C][C]0.8062[/C][C]0.211403[/C][/ROW]
[ROW][C]22[/C][C]-0.071992[/C][C]-0.6109[/C][C]0.271604[/C][/ROW]
[ROW][C]23[/C][C]0.106966[/C][C]0.9076[/C][C]0.183549[/C][/ROW]
[ROW][C]24[/C][C]0.01804[/C][C]0.1531[/C][C]0.439385[/C][/ROW]
[ROW][C]25[/C][C]0.057314[/C][C]0.4863[/C][C]0.314106[/C][/ROW]
[ROW][C]26[/C][C]-0.023629[/C][C]-0.2005[/C][C]0.420828[/C][/ROW]
[ROW][C]27[/C][C]0.027908[/C][C]0.2368[/C][C]0.406741[/C][/ROW]
[ROW][C]28[/C][C]-0.023837[/C][C]-0.2023[/C][C]0.420141[/C][/ROW]
[ROW][C]29[/C][C]-0.108231[/C][C]-0.9184[/C][C]0.180745[/C][/ROW]
[ROW][C]30[/C][C]-0.115235[/C][C]-0.9778[/C][C]0.165723[/C][/ROW]
[ROW][C]31[/C][C]0.054899[/C][C]0.4658[/C][C]0.321369[/C][/ROW]
[ROW][C]32[/C][C]-0.017696[/C][C]-0.1502[/C][C]0.440529[/C][/ROW]
[ROW][C]33[/C][C]-0.091366[/C][C]-0.7753[/C][C]0.22036[/C][/ROW]
[ROW][C]34[/C][C]-0.040783[/C][C]-0.3461[/C][C]0.365155[/C][/ROW]
[ROW][C]35[/C][C]-0.060958[/C][C]-0.5172[/C][C]0.303285[/C][/ROW]
[ROW][C]36[/C][C]-0.026553[/C][C]-0.2253[/C][C]0.411188[/C][/ROW]
[ROW][C]37[/C][C]-0.087996[/C][C]-0.7467[/C][C]0.228846[/C][/ROW]
[ROW][C]38[/C][C]0.000766[/C][C]0.0065[/C][C]0.497416[/C][/ROW]
[ROW][C]39[/C][C]-0.005689[/C][C]-0.0483[/C][C]0.480817[/C][/ROW]
[ROW][C]40[/C][C]0.193956[/C][C]1.6458[/C][C]0.052085[/C][/ROW]
[ROW][C]41[/C][C]-0.063094[/C][C]-0.5354[/C][C]0.297021[/C][/ROW]
[ROW][C]42[/C][C]-0.030817[/C][C]-0.2615[/C][C]0.397229[/C][/ROW]
[ROW][C]43[/C][C]0.050675[/C][C]0.43[/C][C]0.334243[/C][/ROW]
[ROW][C]44[/C][C]0.020746[/C][C]0.176[/C][C]0.430381[/C][/ROW]
[ROW][C]45[/C][C]0.031774[/C][C]0.2696[/C][C]0.394116[/C][/ROW]
[ROW][C]46[/C][C]-0.134468[/C][C]-1.141[/C][C]0.128826[/C][/ROW]
[ROW][C]47[/C][C]0.040838[/C][C]0.3465[/C][C]0.364981[/C][/ROW]
[ROW][C]48[/C][C]-0.024156[/C][C]-0.205[/C][C]0.419085[/C][/ROW]
[/TABLE]
Source: https://freestatistics.org/blog/index.php?pk=194241&T=2

Globally Unique Identifier (entire table): ba.freestatistics.org/blog/index.php?pk=194241&T=2

As an alternative you can also use a QR Code:  

The GUIDs for individual cells are displayed in the table below:

Partial Autocorrelation Function
Time lag kPACF(k)T-STATP-value
10.9696228.22750
2-0.194559-1.65090.051559
3-0.005986-0.05080.479815
4-0.169144-1.43520.077776
5-0.060587-0.51410.304379
6-0.048201-0.4090.341878
70.0089010.07550.470003
80.0182710.1550.438615
9-0.129377-1.09780.137974
10-0.04117-0.34930.363928
110.0607180.51520.303993
12-0.16336-1.38620.084989
130.0321380.27270.392932
14-0.035596-0.3020.381746
15-0.042078-0.3570.36105
16-0.084703-0.71870.237316
17-0.113326-0.96160.169734
180.1035280.87850.191307
190.0028460.02410.4904
20-0.050564-0.42910.334583
210.0950070.80620.211403
22-0.071992-0.61090.271604
230.1069660.90760.183549
240.018040.15310.439385
250.0573140.48630.314106
26-0.023629-0.20050.420828
270.0279080.23680.406741
28-0.023837-0.20230.420141
29-0.108231-0.91840.180745
30-0.115235-0.97780.165723
310.0548990.46580.321369
32-0.017696-0.15020.440529
33-0.091366-0.77530.22036
34-0.040783-0.34610.365155
35-0.060958-0.51720.303285
36-0.026553-0.22530.411188
37-0.087996-0.74670.228846
380.0007660.00650.497416
39-0.005689-0.04830.480817
400.1939561.64580.052085
41-0.063094-0.53540.297021
42-0.030817-0.26150.397229
430.0506750.430.334243
440.0207460.1760.430381
450.0317740.26960.394116
46-0.134468-1.1410.128826
470.0408380.34650.364981
48-0.024156-0.2050.419085


Parameters (Session):
par1 = 48 ; par2 = 1 ; par3 = 0 ; par4 = 0 ; par5 = 12 ; par6 = White Noise ; par7 = 0.95 ;
Parameters (R input):
par1 = 48 ; par2 = 1 ; par3 = 0 ; par4 = 0 ; par5 = 12 ; par6 = White Noise ; par7 = 0.95 ; par8 = ;
R code (references can be found in the software module):
if (par1 == 'Default') {
par1 = 10*log10(length(x))
} else {
par1 <- as.numeric(par1)
}
par2 <- as.numeric(par2)
par3 <- as.numeric(par3)
par4 <- as.numeric(par4)
par5 <- as.numeric(par5)
if (par6 == 'White Noise') par6 <- 'white' else par6 <- 'ma'
par7 <- as.numeric(par7)
if (par8 != '') par8 <- as.numeric(par8)
ox <- x
if (par8 == '') {
if (par2 == 0) {
x <- log(x)
} else {
x <- (x ^ par2 - 1) / par2
}
} else {
x <- log(x,base=par8)
}
if (par3 > 0) x <- diff(x,lag=1,difference=par3)
if (par4 > 0) x <- diff(x,lag=par5,difference=par4)
bitmap(file='picts.png')
op <- par(mfrow=c(2,1))
plot(ox,type='l',main='Original Time Series',xlab='time',ylab='value')
if (par8=='') {
mytitle <- paste('Working Time Series (lambda=',par2,', d=',par3,', D=',par4,')',sep='')
mysub <- paste('(lambda=',par2,', d=',par3,', D=',par4,', CI=', par7, ', CI type=',par6,')',sep='')
} else {
mytitle <- paste('Working Time Series (base=',par8,', d=',par3,', D=',par4,')',sep='')
mysub <- paste('(base=',par8,', d=',par3,', D=',par4,', CI=', par7, ', CI type=',par6,')',sep='')
}
plot(x,type='l', main=mytitle,xlab='time',ylab='value')
par(op)
dev.off()
bitmap(file='pic1.png')
racf <- acf(x, par1, main='Autocorrelation', xlab='time lag', ylab='ACF', ci.type=par6, ci=par7, sub=mysub)
dev.off()
bitmap(file='pic2.png')
rpacf <- pacf(x,par1,main='Partial Autocorrelation',xlab='lags',ylab='PACF',sub=mysub)
dev.off()
(myacf <- c(racf$acf))
(mypacf <- c(rpacf$acf))
lengthx <- length(x)
sqrtn <- sqrt(lengthx)
load(file='createtable')
a<-table.start()
a<-table.row.start(a)
a<-table.element(a,'Autocorrelation Function',4,TRUE)
a<-table.row.end(a)
a<-table.row.start(a)
a<-table.element(a,'Time lag k',header=TRUE)
a<-table.element(a,hyperlink('basics.htm','ACF(k)','click here for more information about the Autocorrelation Function'),header=TRUE)
a<-table.element(a,'T-STAT',header=TRUE)
a<-table.element(a,'P-value',header=TRUE)
a<-table.row.end(a)
for (i in 2:(par1+1)) {
a<-table.row.start(a)
a<-table.element(a,i-1,header=TRUE)
a<-table.element(a,round(myacf[i],6))
mytstat <- myacf[i]*sqrtn
a<-table.element(a,round(mytstat,4))
a<-table.element(a,round(1-pt(abs(mytstat),lengthx),6))
a<-table.row.end(a)
}
a<-table.end(a)
table.save(a,file='mytable.tab')
a<-table.start()
a<-table.row.start(a)
a<-table.element(a,'Partial Autocorrelation Function',4,TRUE)
a<-table.row.end(a)
a<-table.row.start(a)
a<-table.element(a,'Time lag k',header=TRUE)
a<-table.element(a,hyperlink('basics.htm','PACF(k)','click here for more information about the Partial Autocorrelation Function'),header=TRUE)
a<-table.element(a,'T-STAT',header=TRUE)
a<-table.element(a,'P-value',header=TRUE)
a<-table.row.end(a)
for (i in 1:par1) {
a<-table.row.start(a)
a<-table.element(a,i,header=TRUE)
a<-table.element(a,round(mypacf[i],6))
mytstat <- mypacf[i]*sqrtn
a<-table.element(a,round(mytstat,4))
a<-table.element(a,round(1-pt(abs(mytstat),lengthx),6))
a<-table.row.end(a)
}
a<-table.end(a)
table.save(a,file='mytable1.tab')