Free Statistics

of Irreproducible Research!

Author's title

Author*Unverified author*
R Software Modulerwasp_autocorrelation.wasp
Title produced by software(Partial) Autocorrelation Function
Date of computationMon, 26 Nov 2012 18:11:33 -0500
Cite this page as followsStatistical Computations at FreeStatistics.org, Office for Research Development and Education, URL https://freestatistics.org/blog/index.php?v=date/2012/Nov/26/t1353971524an2cschrqfycq8s.htm/, Retrieved Tue, 30 Apr 2024 00:38:11 +0000
Statistical Computations at FreeStatistics.org, Office for Research Development and Education, URL https://freestatistics.org/blog/index.php?pk=193718, Retrieved Tue, 30 Apr 2024 00:38:11 +0000
QR Codes:

Original text written by user:
IsPrivate?No (this computation is public)
User-defined keywords
Estimated Impact69
Family? (F = Feedback message, R = changed R code, M = changed R Module, P = changed Parameters, D = changed Data)
-       [(Partial) Autocorrelation Function] [] [2012-11-26 23:11:33] [de59db95ac8fc769a5d40184c39d6048] [Current]
Feedback Forum

Post a new message
Dataseries X:
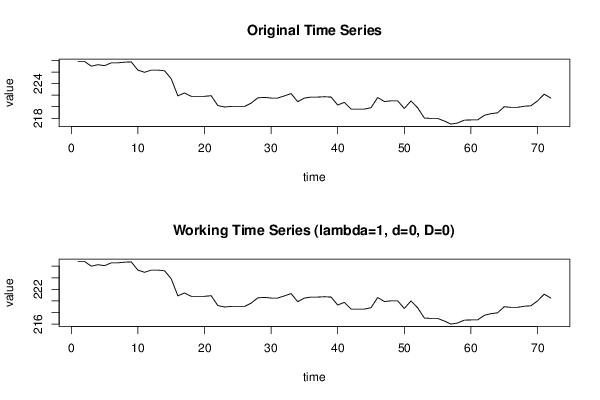
227.81
227.81
227.01
227.26
227.1
227.59
227.59
227.7
227.75
226.33
225.95
226.33
226.33
226.22
224.84
221.88
222.37
221.8
221.8
221.8
221.9
220.2
219.95
220.05
220.05
220.05
220.62
221.53
221.61
221.5
221.5
221.87
222.27
220.86
221.49
221.67
221.67
221.72
221.67
220.29
220.75
219.59
219.59
219.59
219.82
221.59
220.9
221.01
221.01
219.69
221
219.82
218.04
217.97
217.97
217.53
217
217.18
217.68
217.71
217.71
218.5
218.8
218.94
220
219.89
219.89
220.08
220.16
221
222.16
221.5


Summary of computational transaction
Raw Inputview raw input (R code)
Raw Outputview raw output of R engine
Computing time3 seconds
R Server'George Udny Yule' @ yule.wessa.net

\begin{tabular}{lllllllll}
\hline
Summary of computational transaction \tabularnewline
Raw Input & view raw input (R code)  \tabularnewline
Raw Output & view raw output of R engine  \tabularnewline
Computing time & 3 seconds \tabularnewline
R Server & 'George Udny Yule' @ yule.wessa.net \tabularnewline
\hline
\end{tabular}
%Source: https://freestatistics.org/blog/index.php?pk=193718&T=0

[TABLE]
[ROW][C]Summary of computational transaction[/C][/ROW]
[ROW][C]Raw Input[/C][C]view raw input (R code) [/C][/ROW]
[ROW][C]Raw Output[/C][C]view raw output of R engine [/C][/ROW]
[ROW][C]Computing time[/C][C]3 seconds[/C][/ROW]
[ROW][C]R Server[/C][C]'George Udny Yule' @ yule.wessa.net[/C][/ROW]
[/TABLE]
Source: https://freestatistics.org/blog/index.php?pk=193718&T=0

Globally Unique Identifier (entire table): ba.freestatistics.org/blog/index.php?pk=193718&T=0

As an alternative you can also use a QR Code:  

The GUIDs for individual cells are displayed in the table below:

Summary of computational transaction
Raw Inputview raw input (R code)
Raw Outputview raw output of R engine
Computing time3 seconds
R Server'George Udny Yule' @ yule.wessa.net


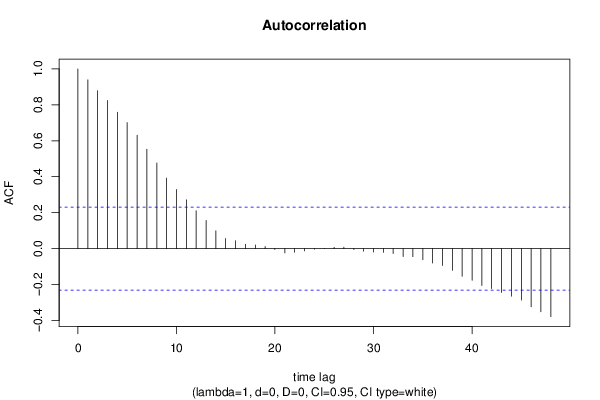
Autocorrelation Function
Time lag kACF(k)T-STATP-value
10.9392077.96940
20.8786667.45570
30.8244466.99570
40.7593956.44370
50.7012615.95040
60.6309125.35350
70.5533444.69536e-06
80.4767684.04556.5e-05
90.3923053.32880.000689
100.3289752.79140.003357
110.2712532.30170.012125
120.2109271.78980.038847
130.156651.32920.093986
140.0989370.83950.201982
150.0554560.47060.319689
160.044220.37520.3543
170.0243770.20680.418357
180.0201850.17130.432245
190.0117810.10.460324
20-0.005405-0.04590.481774
21-0.023661-0.20080.420723
22-0.019688-0.16710.433896
23-0.012626-0.10710.45749
24-0.003007-0.02550.489856
250.0002830.00240.499044
260.0070480.05980.47624
270.0076910.06530.474075
28-0.004928-0.04180.48338
29-0.014158-0.12010.452355
30-0.018941-0.16070.436381
31-0.020951-0.17780.4297
32-0.027285-0.23150.408783
33-0.043535-0.36940.356454
34-0.044818-0.38030.352423
35-0.061946-0.52560.300381
36-0.080309-0.68140.248888
37-0.09454-0.80220.21254
38-0.121038-1.0270.15392
39-0.153578-1.30320.098337
40-0.176301-1.4960.069517
41-0.205218-1.74130.042948
42-0.221829-1.88230.031919
43-0.243999-2.07040.021001
44-0.264764-2.24660.013867
45-0.285828-2.42530.008902
46-0.3241-2.75010.003765
47-0.351803-2.98510.001935
48-0.378746-3.21380.000981

\begin{tabular}{lllllllll}
\hline
Autocorrelation Function \tabularnewline
Time lag k & ACF(k) & T-STAT & P-value \tabularnewline
1 & 0.939207 & 7.9694 & 0 \tabularnewline
2 & 0.878666 & 7.4557 & 0 \tabularnewline
3 & 0.824446 & 6.9957 & 0 \tabularnewline
4 & 0.759395 & 6.4437 & 0 \tabularnewline
5 & 0.701261 & 5.9504 & 0 \tabularnewline
6 & 0.630912 & 5.3535 & 0 \tabularnewline
7 & 0.553344 & 4.6953 & 6e-06 \tabularnewline
8 & 0.476768 & 4.0455 & 6.5e-05 \tabularnewline
9 & 0.392305 & 3.3288 & 0.000689 \tabularnewline
10 & 0.328975 & 2.7914 & 0.003357 \tabularnewline
11 & 0.271253 & 2.3017 & 0.012125 \tabularnewline
12 & 0.210927 & 1.7898 & 0.038847 \tabularnewline
13 & 0.15665 & 1.3292 & 0.093986 \tabularnewline
14 & 0.098937 & 0.8395 & 0.201982 \tabularnewline
15 & 0.055456 & 0.4706 & 0.319689 \tabularnewline
16 & 0.04422 & 0.3752 & 0.3543 \tabularnewline
17 & 0.024377 & 0.2068 & 0.418357 \tabularnewline
18 & 0.020185 & 0.1713 & 0.432245 \tabularnewline
19 & 0.011781 & 0.1 & 0.460324 \tabularnewline
20 & -0.005405 & -0.0459 & 0.481774 \tabularnewline
21 & -0.023661 & -0.2008 & 0.420723 \tabularnewline
22 & -0.019688 & -0.1671 & 0.433896 \tabularnewline
23 & -0.012626 & -0.1071 & 0.45749 \tabularnewline
24 & -0.003007 & -0.0255 & 0.489856 \tabularnewline
25 & 0.000283 & 0.0024 & 0.499044 \tabularnewline
26 & 0.007048 & 0.0598 & 0.47624 \tabularnewline
27 & 0.007691 & 0.0653 & 0.474075 \tabularnewline
28 & -0.004928 & -0.0418 & 0.48338 \tabularnewline
29 & -0.014158 & -0.1201 & 0.452355 \tabularnewline
30 & -0.018941 & -0.1607 & 0.436381 \tabularnewline
31 & -0.020951 & -0.1778 & 0.4297 \tabularnewline
32 & -0.027285 & -0.2315 & 0.408783 \tabularnewline
33 & -0.043535 & -0.3694 & 0.356454 \tabularnewline
34 & -0.044818 & -0.3803 & 0.352423 \tabularnewline
35 & -0.061946 & -0.5256 & 0.300381 \tabularnewline
36 & -0.080309 & -0.6814 & 0.248888 \tabularnewline
37 & -0.09454 & -0.8022 & 0.21254 \tabularnewline
38 & -0.121038 & -1.027 & 0.15392 \tabularnewline
39 & -0.153578 & -1.3032 & 0.098337 \tabularnewline
40 & -0.176301 & -1.496 & 0.069517 \tabularnewline
41 & -0.205218 & -1.7413 & 0.042948 \tabularnewline
42 & -0.221829 & -1.8823 & 0.031919 \tabularnewline
43 & -0.243999 & -2.0704 & 0.021001 \tabularnewline
44 & -0.264764 & -2.2466 & 0.013867 \tabularnewline
45 & -0.285828 & -2.4253 & 0.008902 \tabularnewline
46 & -0.3241 & -2.7501 & 0.003765 \tabularnewline
47 & -0.351803 & -2.9851 & 0.001935 \tabularnewline
48 & -0.378746 & -3.2138 & 0.000981 \tabularnewline
\hline
\end{tabular}
%Source: https://freestatistics.org/blog/index.php?pk=193718&T=1

[TABLE]
[ROW][C]Autocorrelation Function[/C][/ROW]
[ROW][C]Time lag k[/C][C]ACF(k)[/C][C]T-STAT[/C][C]P-value[/C][/ROW]
[ROW][C]1[/C][C]0.939207[/C][C]7.9694[/C][C]0[/C][/ROW]
[ROW][C]2[/C][C]0.878666[/C][C]7.4557[/C][C]0[/C][/ROW]
[ROW][C]3[/C][C]0.824446[/C][C]6.9957[/C][C]0[/C][/ROW]
[ROW][C]4[/C][C]0.759395[/C][C]6.4437[/C][C]0[/C][/ROW]
[ROW][C]5[/C][C]0.701261[/C][C]5.9504[/C][C]0[/C][/ROW]
[ROW][C]6[/C][C]0.630912[/C][C]5.3535[/C][C]0[/C][/ROW]
[ROW][C]7[/C][C]0.553344[/C][C]4.6953[/C][C]6e-06[/C][/ROW]
[ROW][C]8[/C][C]0.476768[/C][C]4.0455[/C][C]6.5e-05[/C][/ROW]
[ROW][C]9[/C][C]0.392305[/C][C]3.3288[/C][C]0.000689[/C][/ROW]
[ROW][C]10[/C][C]0.328975[/C][C]2.7914[/C][C]0.003357[/C][/ROW]
[ROW][C]11[/C][C]0.271253[/C][C]2.3017[/C][C]0.012125[/C][/ROW]
[ROW][C]12[/C][C]0.210927[/C][C]1.7898[/C][C]0.038847[/C][/ROW]
[ROW][C]13[/C][C]0.15665[/C][C]1.3292[/C][C]0.093986[/C][/ROW]
[ROW][C]14[/C][C]0.098937[/C][C]0.8395[/C][C]0.201982[/C][/ROW]
[ROW][C]15[/C][C]0.055456[/C][C]0.4706[/C][C]0.319689[/C][/ROW]
[ROW][C]16[/C][C]0.04422[/C][C]0.3752[/C][C]0.3543[/C][/ROW]
[ROW][C]17[/C][C]0.024377[/C][C]0.2068[/C][C]0.418357[/C][/ROW]
[ROW][C]18[/C][C]0.020185[/C][C]0.1713[/C][C]0.432245[/C][/ROW]
[ROW][C]19[/C][C]0.011781[/C][C]0.1[/C][C]0.460324[/C][/ROW]
[ROW][C]20[/C][C]-0.005405[/C][C]-0.0459[/C][C]0.481774[/C][/ROW]
[ROW][C]21[/C][C]-0.023661[/C][C]-0.2008[/C][C]0.420723[/C][/ROW]
[ROW][C]22[/C][C]-0.019688[/C][C]-0.1671[/C][C]0.433896[/C][/ROW]
[ROW][C]23[/C][C]-0.012626[/C][C]-0.1071[/C][C]0.45749[/C][/ROW]
[ROW][C]24[/C][C]-0.003007[/C][C]-0.0255[/C][C]0.489856[/C][/ROW]
[ROW][C]25[/C][C]0.000283[/C][C]0.0024[/C][C]0.499044[/C][/ROW]
[ROW][C]26[/C][C]0.007048[/C][C]0.0598[/C][C]0.47624[/C][/ROW]
[ROW][C]27[/C][C]0.007691[/C][C]0.0653[/C][C]0.474075[/C][/ROW]
[ROW][C]28[/C][C]-0.004928[/C][C]-0.0418[/C][C]0.48338[/C][/ROW]
[ROW][C]29[/C][C]-0.014158[/C][C]-0.1201[/C][C]0.452355[/C][/ROW]
[ROW][C]30[/C][C]-0.018941[/C][C]-0.1607[/C][C]0.436381[/C][/ROW]
[ROW][C]31[/C][C]-0.020951[/C][C]-0.1778[/C][C]0.4297[/C][/ROW]
[ROW][C]32[/C][C]-0.027285[/C][C]-0.2315[/C][C]0.408783[/C][/ROW]
[ROW][C]33[/C][C]-0.043535[/C][C]-0.3694[/C][C]0.356454[/C][/ROW]
[ROW][C]34[/C][C]-0.044818[/C][C]-0.3803[/C][C]0.352423[/C][/ROW]
[ROW][C]35[/C][C]-0.061946[/C][C]-0.5256[/C][C]0.300381[/C][/ROW]
[ROW][C]36[/C][C]-0.080309[/C][C]-0.6814[/C][C]0.248888[/C][/ROW]
[ROW][C]37[/C][C]-0.09454[/C][C]-0.8022[/C][C]0.21254[/C][/ROW]
[ROW][C]38[/C][C]-0.121038[/C][C]-1.027[/C][C]0.15392[/C][/ROW]
[ROW][C]39[/C][C]-0.153578[/C][C]-1.3032[/C][C]0.098337[/C][/ROW]
[ROW][C]40[/C][C]-0.176301[/C][C]-1.496[/C][C]0.069517[/C][/ROW]
[ROW][C]41[/C][C]-0.205218[/C][C]-1.7413[/C][C]0.042948[/C][/ROW]
[ROW][C]42[/C][C]-0.221829[/C][C]-1.8823[/C][C]0.031919[/C][/ROW]
[ROW][C]43[/C][C]-0.243999[/C][C]-2.0704[/C][C]0.021001[/C][/ROW]
[ROW][C]44[/C][C]-0.264764[/C][C]-2.2466[/C][C]0.013867[/C][/ROW]
[ROW][C]45[/C][C]-0.285828[/C][C]-2.4253[/C][C]0.008902[/C][/ROW]
[ROW][C]46[/C][C]-0.3241[/C][C]-2.7501[/C][C]0.003765[/C][/ROW]
[ROW][C]47[/C][C]-0.351803[/C][C]-2.9851[/C][C]0.001935[/C][/ROW]
[ROW][C]48[/C][C]-0.378746[/C][C]-3.2138[/C][C]0.000981[/C][/ROW]
[/TABLE]
Source: https://freestatistics.org/blog/index.php?pk=193718&T=1

Globally Unique Identifier (entire table): ba.freestatistics.org/blog/index.php?pk=193718&T=1

As an alternative you can also use a QR Code:  

The GUIDs for individual cells are displayed in the table below:

Autocorrelation Function
Time lag kACF(k)T-STATP-value
10.9392077.96940
20.8786667.45570
30.8244466.99570
40.7593956.44370
50.7012615.95040
60.6309125.35350
70.5533444.69536e-06
80.4767684.04556.5e-05
90.3923053.32880.000689
100.3289752.79140.003357
110.2712532.30170.012125
120.2109271.78980.038847
130.156651.32920.093986
140.0989370.83950.201982
150.0554560.47060.319689
160.044220.37520.3543
170.0243770.20680.418357
180.0201850.17130.432245
190.0117810.10.460324
20-0.005405-0.04590.481774
21-0.023661-0.20080.420723
22-0.019688-0.16710.433896
23-0.012626-0.10710.45749
24-0.003007-0.02550.489856
250.0002830.00240.499044
260.0070480.05980.47624
270.0076910.06530.474075
28-0.004928-0.04180.48338
29-0.014158-0.12010.452355
30-0.018941-0.16070.436381
31-0.020951-0.17780.4297
32-0.027285-0.23150.408783
33-0.043535-0.36940.356454
34-0.044818-0.38030.352423
35-0.061946-0.52560.300381
36-0.080309-0.68140.248888
37-0.09454-0.80220.21254
38-0.121038-1.0270.15392
39-0.153578-1.30320.098337
40-0.176301-1.4960.069517
41-0.205218-1.74130.042948
42-0.221829-1.88230.031919
43-0.243999-2.07040.021001
44-0.264764-2.24660.013867
45-0.285828-2.42530.008902
46-0.3241-2.75010.003765
47-0.351803-2.98510.001935
48-0.378746-3.21380.000981


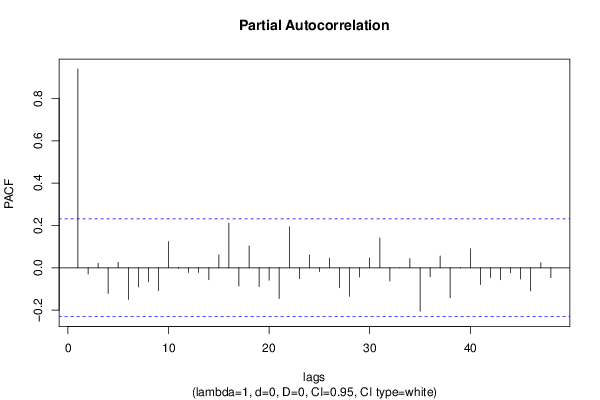
Partial Autocorrelation Function
Time lag kPACF(k)T-STATP-value
10.9392077.96940
2-0.029203-0.24780.402497
30.0214320.18190.428102
4-0.121667-1.03240.152676
50.0253970.21550.414994
6-0.149687-1.27010.104062
7-0.090346-0.76660.22291
8-0.065905-0.55920.288872
9-0.107986-0.91630.181287
100.1234561.04760.149173
11-0.002917-0.02480.490159
12-0.022817-0.19360.423515
13-0.022424-0.19030.424815
14-0.056598-0.48030.316252
150.0600850.50980.305862
160.2105811.78680.039086
17-0.086189-0.73130.233473
180.1034970.87820.191378
19-0.088894-0.75430.226566
20-0.059305-0.50320.308174
21-0.145176-1.23190.111004
220.1935051.64190.052481
23-0.051322-0.43550.332258
240.0601360.51030.30571
25-0.018148-0.1540.439023
260.0456920.38770.349687
27-0.094104-0.79850.213604
28-0.134832-1.14410.128188
29-0.043293-0.36740.357216
300.0462620.39250.347908
310.1403561.1910.118791
32-0.062864-0.53340.297693
33-0.000235-0.0020.499207
340.0431310.3660.357727
35-0.204895-1.73860.04319
36-0.042819-0.36330.358711
370.0559370.47460.31824
38-0.141836-1.20350.116359
39-0.00078-0.00660.497369
400.08920.75690.225793
41-0.079297-0.67290.251595
42-0.046217-0.39220.348049
43-0.056944-0.48320.315215
44-0.023801-0.2020.420258
45-0.052751-0.44760.32789
46-0.109354-0.92790.17828
470.0238040.2020.420251
48-0.046731-0.39650.346445

\begin{tabular}{lllllllll}
\hline
Partial Autocorrelation Function \tabularnewline
Time lag k & PACF(k) & T-STAT & P-value \tabularnewline
1 & 0.939207 & 7.9694 & 0 \tabularnewline
2 & -0.029203 & -0.2478 & 0.402497 \tabularnewline
3 & 0.021432 & 0.1819 & 0.428102 \tabularnewline
4 & -0.121667 & -1.0324 & 0.152676 \tabularnewline
5 & 0.025397 & 0.2155 & 0.414994 \tabularnewline
6 & -0.149687 & -1.2701 & 0.104062 \tabularnewline
7 & -0.090346 & -0.7666 & 0.22291 \tabularnewline
8 & -0.065905 & -0.5592 & 0.288872 \tabularnewline
9 & -0.107986 & -0.9163 & 0.181287 \tabularnewline
10 & 0.123456 & 1.0476 & 0.149173 \tabularnewline
11 & -0.002917 & -0.0248 & 0.490159 \tabularnewline
12 & -0.022817 & -0.1936 & 0.423515 \tabularnewline
13 & -0.022424 & -0.1903 & 0.424815 \tabularnewline
14 & -0.056598 & -0.4803 & 0.316252 \tabularnewline
15 & 0.060085 & 0.5098 & 0.305862 \tabularnewline
16 & 0.210581 & 1.7868 & 0.039086 \tabularnewline
17 & -0.086189 & -0.7313 & 0.233473 \tabularnewline
18 & 0.103497 & 0.8782 & 0.191378 \tabularnewline
19 & -0.088894 & -0.7543 & 0.226566 \tabularnewline
20 & -0.059305 & -0.5032 & 0.308174 \tabularnewline
21 & -0.145176 & -1.2319 & 0.111004 \tabularnewline
22 & 0.193505 & 1.6419 & 0.052481 \tabularnewline
23 & -0.051322 & -0.4355 & 0.332258 \tabularnewline
24 & 0.060136 & 0.5103 & 0.30571 \tabularnewline
25 & -0.018148 & -0.154 & 0.439023 \tabularnewline
26 & 0.045692 & 0.3877 & 0.349687 \tabularnewline
27 & -0.094104 & -0.7985 & 0.213604 \tabularnewline
28 & -0.134832 & -1.1441 & 0.128188 \tabularnewline
29 & -0.043293 & -0.3674 & 0.357216 \tabularnewline
30 & 0.046262 & 0.3925 & 0.347908 \tabularnewline
31 & 0.140356 & 1.191 & 0.118791 \tabularnewline
32 & -0.062864 & -0.5334 & 0.297693 \tabularnewline
33 & -0.000235 & -0.002 & 0.499207 \tabularnewline
34 & 0.043131 & 0.366 & 0.357727 \tabularnewline
35 & -0.204895 & -1.7386 & 0.04319 \tabularnewline
36 & -0.042819 & -0.3633 & 0.358711 \tabularnewline
37 & 0.055937 & 0.4746 & 0.31824 \tabularnewline
38 & -0.141836 & -1.2035 & 0.116359 \tabularnewline
39 & -0.00078 & -0.0066 & 0.497369 \tabularnewline
40 & 0.0892 & 0.7569 & 0.225793 \tabularnewline
41 & -0.079297 & -0.6729 & 0.251595 \tabularnewline
42 & -0.046217 & -0.3922 & 0.348049 \tabularnewline
43 & -0.056944 & -0.4832 & 0.315215 \tabularnewline
44 & -0.023801 & -0.202 & 0.420258 \tabularnewline
45 & -0.052751 & -0.4476 & 0.32789 \tabularnewline
46 & -0.109354 & -0.9279 & 0.17828 \tabularnewline
47 & 0.023804 & 0.202 & 0.420251 \tabularnewline
48 & -0.046731 & -0.3965 & 0.346445 \tabularnewline
\hline
\end{tabular}
%Source: https://freestatistics.org/blog/index.php?pk=193718&T=2

[TABLE]
[ROW][C]Partial Autocorrelation Function[/C][/ROW]
[ROW][C]Time lag k[/C][C]PACF(k)[/C][C]T-STAT[/C][C]P-value[/C][/ROW]
[ROW][C]1[/C][C]0.939207[/C][C]7.9694[/C][C]0[/C][/ROW]
[ROW][C]2[/C][C]-0.029203[/C][C]-0.2478[/C][C]0.402497[/C][/ROW]
[ROW][C]3[/C][C]0.021432[/C][C]0.1819[/C][C]0.428102[/C][/ROW]
[ROW][C]4[/C][C]-0.121667[/C][C]-1.0324[/C][C]0.152676[/C][/ROW]
[ROW][C]5[/C][C]0.025397[/C][C]0.2155[/C][C]0.414994[/C][/ROW]
[ROW][C]6[/C][C]-0.149687[/C][C]-1.2701[/C][C]0.104062[/C][/ROW]
[ROW][C]7[/C][C]-0.090346[/C][C]-0.7666[/C][C]0.22291[/C][/ROW]
[ROW][C]8[/C][C]-0.065905[/C][C]-0.5592[/C][C]0.288872[/C][/ROW]
[ROW][C]9[/C][C]-0.107986[/C][C]-0.9163[/C][C]0.181287[/C][/ROW]
[ROW][C]10[/C][C]0.123456[/C][C]1.0476[/C][C]0.149173[/C][/ROW]
[ROW][C]11[/C][C]-0.002917[/C][C]-0.0248[/C][C]0.490159[/C][/ROW]
[ROW][C]12[/C][C]-0.022817[/C][C]-0.1936[/C][C]0.423515[/C][/ROW]
[ROW][C]13[/C][C]-0.022424[/C][C]-0.1903[/C][C]0.424815[/C][/ROW]
[ROW][C]14[/C][C]-0.056598[/C][C]-0.4803[/C][C]0.316252[/C][/ROW]
[ROW][C]15[/C][C]0.060085[/C][C]0.5098[/C][C]0.305862[/C][/ROW]
[ROW][C]16[/C][C]0.210581[/C][C]1.7868[/C][C]0.039086[/C][/ROW]
[ROW][C]17[/C][C]-0.086189[/C][C]-0.7313[/C][C]0.233473[/C][/ROW]
[ROW][C]18[/C][C]0.103497[/C][C]0.8782[/C][C]0.191378[/C][/ROW]
[ROW][C]19[/C][C]-0.088894[/C][C]-0.7543[/C][C]0.226566[/C][/ROW]
[ROW][C]20[/C][C]-0.059305[/C][C]-0.5032[/C][C]0.308174[/C][/ROW]
[ROW][C]21[/C][C]-0.145176[/C][C]-1.2319[/C][C]0.111004[/C][/ROW]
[ROW][C]22[/C][C]0.193505[/C][C]1.6419[/C][C]0.052481[/C][/ROW]
[ROW][C]23[/C][C]-0.051322[/C][C]-0.4355[/C][C]0.332258[/C][/ROW]
[ROW][C]24[/C][C]0.060136[/C][C]0.5103[/C][C]0.30571[/C][/ROW]
[ROW][C]25[/C][C]-0.018148[/C][C]-0.154[/C][C]0.439023[/C][/ROW]
[ROW][C]26[/C][C]0.045692[/C][C]0.3877[/C][C]0.349687[/C][/ROW]
[ROW][C]27[/C][C]-0.094104[/C][C]-0.7985[/C][C]0.213604[/C][/ROW]
[ROW][C]28[/C][C]-0.134832[/C][C]-1.1441[/C][C]0.128188[/C][/ROW]
[ROW][C]29[/C][C]-0.043293[/C][C]-0.3674[/C][C]0.357216[/C][/ROW]
[ROW][C]30[/C][C]0.046262[/C][C]0.3925[/C][C]0.347908[/C][/ROW]
[ROW][C]31[/C][C]0.140356[/C][C]1.191[/C][C]0.118791[/C][/ROW]
[ROW][C]32[/C][C]-0.062864[/C][C]-0.5334[/C][C]0.297693[/C][/ROW]
[ROW][C]33[/C][C]-0.000235[/C][C]-0.002[/C][C]0.499207[/C][/ROW]
[ROW][C]34[/C][C]0.043131[/C][C]0.366[/C][C]0.357727[/C][/ROW]
[ROW][C]35[/C][C]-0.204895[/C][C]-1.7386[/C][C]0.04319[/C][/ROW]
[ROW][C]36[/C][C]-0.042819[/C][C]-0.3633[/C][C]0.358711[/C][/ROW]
[ROW][C]37[/C][C]0.055937[/C][C]0.4746[/C][C]0.31824[/C][/ROW]
[ROW][C]38[/C][C]-0.141836[/C][C]-1.2035[/C][C]0.116359[/C][/ROW]
[ROW][C]39[/C][C]-0.00078[/C][C]-0.0066[/C][C]0.497369[/C][/ROW]
[ROW][C]40[/C][C]0.0892[/C][C]0.7569[/C][C]0.225793[/C][/ROW]
[ROW][C]41[/C][C]-0.079297[/C][C]-0.6729[/C][C]0.251595[/C][/ROW]
[ROW][C]42[/C][C]-0.046217[/C][C]-0.3922[/C][C]0.348049[/C][/ROW]
[ROW][C]43[/C][C]-0.056944[/C][C]-0.4832[/C][C]0.315215[/C][/ROW]
[ROW][C]44[/C][C]-0.023801[/C][C]-0.202[/C][C]0.420258[/C][/ROW]
[ROW][C]45[/C][C]-0.052751[/C][C]-0.4476[/C][C]0.32789[/C][/ROW]
[ROW][C]46[/C][C]-0.109354[/C][C]-0.9279[/C][C]0.17828[/C][/ROW]
[ROW][C]47[/C][C]0.023804[/C][C]0.202[/C][C]0.420251[/C][/ROW]
[ROW][C]48[/C][C]-0.046731[/C][C]-0.3965[/C][C]0.346445[/C][/ROW]
[/TABLE]
Source: https://freestatistics.org/blog/index.php?pk=193718&T=2

Globally Unique Identifier (entire table): ba.freestatistics.org/blog/index.php?pk=193718&T=2

As an alternative you can also use a QR Code:  

The GUIDs for individual cells are displayed in the table below:

Partial Autocorrelation Function
Time lag kPACF(k)T-STATP-value
10.9392077.96940
2-0.029203-0.24780.402497
30.0214320.18190.428102
4-0.121667-1.03240.152676
50.0253970.21550.414994
6-0.149687-1.27010.104062
7-0.090346-0.76660.22291
8-0.065905-0.55920.288872
9-0.107986-0.91630.181287
100.1234561.04760.149173
11-0.002917-0.02480.490159
12-0.022817-0.19360.423515
13-0.022424-0.19030.424815
14-0.056598-0.48030.316252
150.0600850.50980.305862
160.2105811.78680.039086
17-0.086189-0.73130.233473
180.1034970.87820.191378
19-0.088894-0.75430.226566
20-0.059305-0.50320.308174
21-0.145176-1.23190.111004
220.1935051.64190.052481
23-0.051322-0.43550.332258
240.0601360.51030.30571
25-0.018148-0.1540.439023
260.0456920.38770.349687
27-0.094104-0.79850.213604
28-0.134832-1.14410.128188
29-0.043293-0.36740.357216
300.0462620.39250.347908
310.1403561.1910.118791
32-0.062864-0.53340.297693
33-0.000235-0.0020.499207
340.0431310.3660.357727
35-0.204895-1.73860.04319
36-0.042819-0.36330.358711
370.0559370.47460.31824
38-0.141836-1.20350.116359
39-0.00078-0.00660.497369
400.08920.75690.225793
41-0.079297-0.67290.251595
42-0.046217-0.39220.348049
43-0.056944-0.48320.315215
44-0.023801-0.2020.420258
45-0.052751-0.44760.32789
46-0.109354-0.92790.17828
470.0238040.2020.420251
48-0.046731-0.39650.346445


Parameters (Session):
par1 = 48 ; par2 = 1 ; par3 = 0 ; par4 = 0 ; par5 = 12 ; par6 = White Noise ; par7 = 0.95 ;
Parameters (R input):
par1 = 48 ; par2 = 1 ; par3 = 0 ; par4 = 0 ; par5 = 12 ; par6 = White Noise ; par7 = 0.95 ; par8 = ;
R code (references can be found in the software module):
if (par1 == 'Default') {
par1 = 10*log10(length(x))
} else {
par1 <- as.numeric(par1)
}
par2 <- as.numeric(par2)
par3 <- as.numeric(par3)
par4 <- as.numeric(par4)
par5 <- as.numeric(par5)
if (par6 == 'White Noise') par6 <- 'white' else par6 <- 'ma'
par7 <- as.numeric(par7)
if (par8 != '') par8 <- as.numeric(par8)
ox <- x
if (par8 == '') {
if (par2 == 0) {
x <- log(x)
} else {
x <- (x ^ par2 - 1) / par2
}
} else {
x <- log(x,base=par8)
}
if (par3 > 0) x <- diff(x,lag=1,difference=par3)
if (par4 > 0) x <- diff(x,lag=par5,difference=par4)
bitmap(file='picts.png')
op <- par(mfrow=c(2,1))
plot(ox,type='l',main='Original Time Series',xlab='time',ylab='value')
if (par8=='') {
mytitle <- paste('Working Time Series (lambda=',par2,', d=',par3,', D=',par4,')',sep='')
mysub <- paste('(lambda=',par2,', d=',par3,', D=',par4,', CI=', par7, ', CI type=',par6,')',sep='')
} else {
mytitle <- paste('Working Time Series (base=',par8,', d=',par3,', D=',par4,')',sep='')
mysub <- paste('(base=',par8,', d=',par3,', D=',par4,', CI=', par7, ', CI type=',par6,')',sep='')
}
plot(x,type='l', main=mytitle,xlab='time',ylab='value')
par(op)
dev.off()
bitmap(file='pic1.png')
racf <- acf(x, par1, main='Autocorrelation', xlab='time lag', ylab='ACF', ci.type=par6, ci=par7, sub=mysub)
dev.off()
bitmap(file='pic2.png')
rpacf <- pacf(x,par1,main='Partial Autocorrelation',xlab='lags',ylab='PACF',sub=mysub)
dev.off()
(myacf <- c(racf$acf))
(mypacf <- c(rpacf$acf))
lengthx <- length(x)
sqrtn <- sqrt(lengthx)
load(file='createtable')
a<-table.start()
a<-table.row.start(a)
a<-table.element(a,'Autocorrelation Function',4,TRUE)
a<-table.row.end(a)
a<-table.row.start(a)
a<-table.element(a,'Time lag k',header=TRUE)
a<-table.element(a,hyperlink('basics.htm','ACF(k)','click here for more information about the Autocorrelation Function'),header=TRUE)
a<-table.element(a,'T-STAT',header=TRUE)
a<-table.element(a,'P-value',header=TRUE)
a<-table.row.end(a)
for (i in 2:(par1+1)) {
a<-table.row.start(a)
a<-table.element(a,i-1,header=TRUE)
a<-table.element(a,round(myacf[i],6))
mytstat <- myacf[i]*sqrtn
a<-table.element(a,round(mytstat,4))
a<-table.element(a,round(1-pt(abs(mytstat),lengthx),6))
a<-table.row.end(a)
}
a<-table.end(a)
table.save(a,file='mytable.tab')
a<-table.start()
a<-table.row.start(a)
a<-table.element(a,'Partial Autocorrelation Function',4,TRUE)
a<-table.row.end(a)
a<-table.row.start(a)
a<-table.element(a,'Time lag k',header=TRUE)
a<-table.element(a,hyperlink('basics.htm','PACF(k)','click here for more information about the Partial Autocorrelation Function'),header=TRUE)
a<-table.element(a,'T-STAT',header=TRUE)
a<-table.element(a,'P-value',header=TRUE)
a<-table.row.end(a)
for (i in 1:par1) {
a<-table.row.start(a)
a<-table.element(a,i,header=TRUE)
a<-table.element(a,round(mypacf[i],6))
mytstat <- mypacf[i]*sqrtn
a<-table.element(a,round(mytstat,4))
a<-table.element(a,round(1-pt(abs(mytstat),lengthx),6))
a<-table.row.end(a)
}
a<-table.end(a)
table.save(a,file='mytable1.tab')