Free Statistics

of Irreproducible Research!

Author's title

Author*Unverified author*
R Software Modulerwasp_autocorrelation.wasp
Title produced by software(Partial) Autocorrelation Function
Date of computationMon, 26 Nov 2012 18:09:04 -0500
Cite this page as followsStatistical Computations at FreeStatistics.org, Office for Research Development and Education, URL https://freestatistics.org/blog/index.php?v=date/2012/Nov/26/t1353971370ydojyupw6nxe13y.htm/, Retrieved Tue, 30 Apr 2024 01:09:42 +0000
Statistical Computations at FreeStatistics.org, Office for Research Development and Education, URL https://freestatistics.org/blog/index.php?pk=193717, Retrieved Tue, 30 Apr 2024 01:09:42 +0000
QR Codes:

Original text written by user:
IsPrivate?No (this computation is public)
User-defined keywords
Estimated Impact55
Family? (F = Feedback message, R = changed R code, M = changed R Module, P = changed Parameters, D = changed Data)
-       [(Partial) Autocorrelation Function] [] [2012-11-26 23:09:04] [de59db95ac8fc769a5d40184c39d6048] [Current]
Feedback Forum

Post a new message
Dataseries X:
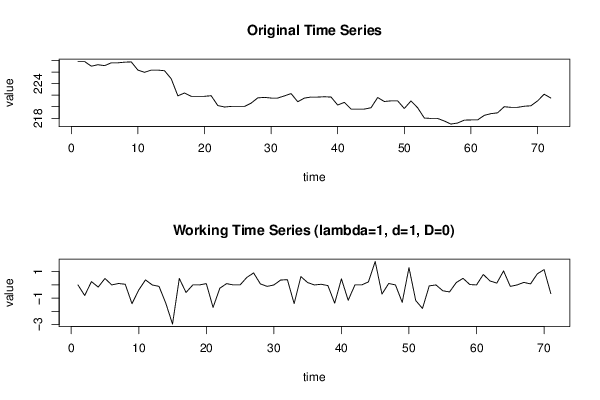
227,81
227,81
227,01
227,26
227,1
227,59
227,59
227,7
227,75
226,33
225,95
226,33
226,33
226,22
224,84
221,88
222,37
221,8
221,8
221,8
221,9
220,2
219,95
220,05
220,05
220,05
220,62
221,53
221,61
221,5
221,5
221,87
222,27
220,86
221,49
221,67
221,67
221,72
221,67
220,29
220,75
219,59
219,59
219,59
219,82
221,59
220,9
221,01
221,01
219,69
221
219,82
218,04
217,97
217,97
217,53
217
217,18
217,68
217,71
217,71
218,5
218,8
218,94
220
219,89
219,89
220,08
220,16
221
222,16
221,5


Summary of computational transaction
Raw Inputview raw input (R code)
Raw Outputview raw output of R engine
Computing time4 seconds
R Server'Sir Ronald Aylmer Fisher' @ fisher.wessa.net

\begin{tabular}{lllllllll}
\hline
Summary of computational transaction \tabularnewline
Raw Input & view raw input (R code)  \tabularnewline
Raw Output & view raw output of R engine  \tabularnewline
Computing time & 4 seconds \tabularnewline
R Server & 'Sir Ronald Aylmer Fisher' @ fisher.wessa.net \tabularnewline
\hline
\end{tabular}
%Source: https://freestatistics.org/blog/index.php?pk=193717&T=0

[TABLE]
[ROW][C]Summary of computational transaction[/C][/ROW]
[ROW][C]Raw Input[/C][C]view raw input (R code) [/C][/ROW]
[ROW][C]Raw Output[/C][C]view raw output of R engine [/C][/ROW]
[ROW][C]Computing time[/C][C]4 seconds[/C][/ROW]
[ROW][C]R Server[/C][C]'Sir Ronald Aylmer Fisher' @ fisher.wessa.net[/C][/ROW]
[/TABLE]
Source: https://freestatistics.org/blog/index.php?pk=193717&T=0

Globally Unique Identifier (entire table): ba.freestatistics.org/blog/index.php?pk=193717&T=0

As an alternative you can also use a QR Code:  

The GUIDs for individual cells are displayed in the table below:

Summary of computational transaction
Raw Inputview raw input (R code)
Raw Outputview raw output of R engine
Computing time4 seconds
R Server'Sir Ronald Aylmer Fisher' @ fisher.wessa.net


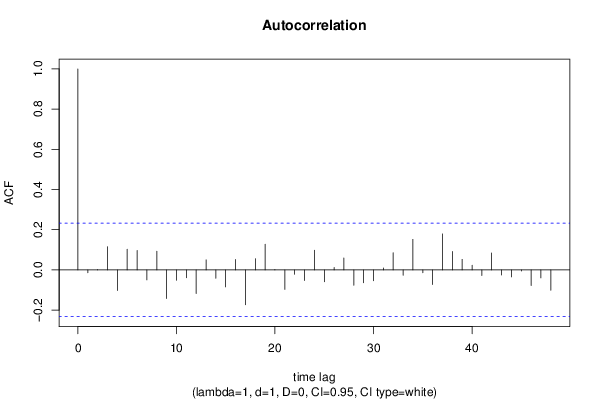
Autocorrelation Function
Time lag kACF(k)T-STATP-value
1-0.013785-0.11620.453931
20.0010640.0090.496437
30.1155120.97330.166849
4-0.102265-0.86170.195877
50.1025730.86430.195167
60.0969430.81690.208372
7-0.049723-0.4190.338249
80.0930920.78440.217705
9-0.142321-1.19920.117215
10-0.05156-0.43450.332639
11-0.039256-0.33080.370894
12-0.117042-0.98620.163689
130.0499770.42110.337473
14-0.041294-0.3480.364454
15-0.084469-0.71170.239477
160.0521820.43970.330748
17-0.173358-1.46070.074249
180.0551940.46510.32165
190.128081.07920.142072
200.000830.0070.497218
21-0.096942-0.81690.208373
22-0.021766-0.18340.427502
23-0.052638-0.44350.329364
240.0980210.82590.205803
25-0.058596-0.49370.311507
260.0119960.10110.459885
270.0589110.49640.310576
28-0.076459-0.64430.260743
29-0.063932-0.53870.295889
30-0.053959-0.45470.325369
310.0097210.08190.467475
320.0855840.72110.236594
33-0.026342-0.2220.412491
340.1518691.27970.102413
35-0.014159-0.11930.452685
36-0.072592-0.61170.271355
370.179171.50970.067777
380.0919340.77460.22056
390.0525140.44250.329741
400.0228650.19270.423886
41-0.027514-0.23180.408667
420.0843940.71110.23967
43-0.025789-0.21730.414299
44-0.034648-0.29190.385589
45-0.005274-0.04440.482338
46-0.077844-0.65590.256996
47-0.039588-0.33360.369842
48-0.101464-0.8550.197727

\begin{tabular}{lllllllll}
\hline
Autocorrelation Function \tabularnewline
Time lag k & ACF(k) & T-STAT & P-value \tabularnewline
1 & -0.013785 & -0.1162 & 0.453931 \tabularnewline
2 & 0.001064 & 0.009 & 0.496437 \tabularnewline
3 & 0.115512 & 0.9733 & 0.166849 \tabularnewline
4 & -0.102265 & -0.8617 & 0.195877 \tabularnewline
5 & 0.102573 & 0.8643 & 0.195167 \tabularnewline
6 & 0.096943 & 0.8169 & 0.208372 \tabularnewline
7 & -0.049723 & -0.419 & 0.338249 \tabularnewline
8 & 0.093092 & 0.7844 & 0.217705 \tabularnewline
9 & -0.142321 & -1.1992 & 0.117215 \tabularnewline
10 & -0.05156 & -0.4345 & 0.332639 \tabularnewline
11 & -0.039256 & -0.3308 & 0.370894 \tabularnewline
12 & -0.117042 & -0.9862 & 0.163689 \tabularnewline
13 & 0.049977 & 0.4211 & 0.337473 \tabularnewline
14 & -0.041294 & -0.348 & 0.364454 \tabularnewline
15 & -0.084469 & -0.7117 & 0.239477 \tabularnewline
16 & 0.052182 & 0.4397 & 0.330748 \tabularnewline
17 & -0.173358 & -1.4607 & 0.074249 \tabularnewline
18 & 0.055194 & 0.4651 & 0.32165 \tabularnewline
19 & 0.12808 & 1.0792 & 0.142072 \tabularnewline
20 & 0.00083 & 0.007 & 0.497218 \tabularnewline
21 & -0.096942 & -0.8169 & 0.208373 \tabularnewline
22 & -0.021766 & -0.1834 & 0.427502 \tabularnewline
23 & -0.052638 & -0.4435 & 0.329364 \tabularnewline
24 & 0.098021 & 0.8259 & 0.205803 \tabularnewline
25 & -0.058596 & -0.4937 & 0.311507 \tabularnewline
26 & 0.011996 & 0.1011 & 0.459885 \tabularnewline
27 & 0.058911 & 0.4964 & 0.310576 \tabularnewline
28 & -0.076459 & -0.6443 & 0.260743 \tabularnewline
29 & -0.063932 & -0.5387 & 0.295889 \tabularnewline
30 & -0.053959 & -0.4547 & 0.325369 \tabularnewline
31 & 0.009721 & 0.0819 & 0.467475 \tabularnewline
32 & 0.085584 & 0.7211 & 0.236594 \tabularnewline
33 & -0.026342 & -0.222 & 0.412491 \tabularnewline
34 & 0.151869 & 1.2797 & 0.102413 \tabularnewline
35 & -0.014159 & -0.1193 & 0.452685 \tabularnewline
36 & -0.072592 & -0.6117 & 0.271355 \tabularnewline
37 & 0.17917 & 1.5097 & 0.067777 \tabularnewline
38 & 0.091934 & 0.7746 & 0.22056 \tabularnewline
39 & 0.052514 & 0.4425 & 0.329741 \tabularnewline
40 & 0.022865 & 0.1927 & 0.423886 \tabularnewline
41 & -0.027514 & -0.2318 & 0.408667 \tabularnewline
42 & 0.084394 & 0.7111 & 0.23967 \tabularnewline
43 & -0.025789 & -0.2173 & 0.414299 \tabularnewline
44 & -0.034648 & -0.2919 & 0.385589 \tabularnewline
45 & -0.005274 & -0.0444 & 0.482338 \tabularnewline
46 & -0.077844 & -0.6559 & 0.256996 \tabularnewline
47 & -0.039588 & -0.3336 & 0.369842 \tabularnewline
48 & -0.101464 & -0.855 & 0.197727 \tabularnewline
\hline
\end{tabular}
%Source: https://freestatistics.org/blog/index.php?pk=193717&T=1

[TABLE]
[ROW][C]Autocorrelation Function[/C][/ROW]
[ROW][C]Time lag k[/C][C]ACF(k)[/C][C]T-STAT[/C][C]P-value[/C][/ROW]
[ROW][C]1[/C][C]-0.013785[/C][C]-0.1162[/C][C]0.453931[/C][/ROW]
[ROW][C]2[/C][C]0.001064[/C][C]0.009[/C][C]0.496437[/C][/ROW]
[ROW][C]3[/C][C]0.115512[/C][C]0.9733[/C][C]0.166849[/C][/ROW]
[ROW][C]4[/C][C]-0.102265[/C][C]-0.8617[/C][C]0.195877[/C][/ROW]
[ROW][C]5[/C][C]0.102573[/C][C]0.8643[/C][C]0.195167[/C][/ROW]
[ROW][C]6[/C][C]0.096943[/C][C]0.8169[/C][C]0.208372[/C][/ROW]
[ROW][C]7[/C][C]-0.049723[/C][C]-0.419[/C][C]0.338249[/C][/ROW]
[ROW][C]8[/C][C]0.093092[/C][C]0.7844[/C][C]0.217705[/C][/ROW]
[ROW][C]9[/C][C]-0.142321[/C][C]-1.1992[/C][C]0.117215[/C][/ROW]
[ROW][C]10[/C][C]-0.05156[/C][C]-0.4345[/C][C]0.332639[/C][/ROW]
[ROW][C]11[/C][C]-0.039256[/C][C]-0.3308[/C][C]0.370894[/C][/ROW]
[ROW][C]12[/C][C]-0.117042[/C][C]-0.9862[/C][C]0.163689[/C][/ROW]
[ROW][C]13[/C][C]0.049977[/C][C]0.4211[/C][C]0.337473[/C][/ROW]
[ROW][C]14[/C][C]-0.041294[/C][C]-0.348[/C][C]0.364454[/C][/ROW]
[ROW][C]15[/C][C]-0.084469[/C][C]-0.7117[/C][C]0.239477[/C][/ROW]
[ROW][C]16[/C][C]0.052182[/C][C]0.4397[/C][C]0.330748[/C][/ROW]
[ROW][C]17[/C][C]-0.173358[/C][C]-1.4607[/C][C]0.074249[/C][/ROW]
[ROW][C]18[/C][C]0.055194[/C][C]0.4651[/C][C]0.32165[/C][/ROW]
[ROW][C]19[/C][C]0.12808[/C][C]1.0792[/C][C]0.142072[/C][/ROW]
[ROW][C]20[/C][C]0.00083[/C][C]0.007[/C][C]0.497218[/C][/ROW]
[ROW][C]21[/C][C]-0.096942[/C][C]-0.8169[/C][C]0.208373[/C][/ROW]
[ROW][C]22[/C][C]-0.021766[/C][C]-0.1834[/C][C]0.427502[/C][/ROW]
[ROW][C]23[/C][C]-0.052638[/C][C]-0.4435[/C][C]0.329364[/C][/ROW]
[ROW][C]24[/C][C]0.098021[/C][C]0.8259[/C][C]0.205803[/C][/ROW]
[ROW][C]25[/C][C]-0.058596[/C][C]-0.4937[/C][C]0.311507[/C][/ROW]
[ROW][C]26[/C][C]0.011996[/C][C]0.1011[/C][C]0.459885[/C][/ROW]
[ROW][C]27[/C][C]0.058911[/C][C]0.4964[/C][C]0.310576[/C][/ROW]
[ROW][C]28[/C][C]-0.076459[/C][C]-0.6443[/C][C]0.260743[/C][/ROW]
[ROW][C]29[/C][C]-0.063932[/C][C]-0.5387[/C][C]0.295889[/C][/ROW]
[ROW][C]30[/C][C]-0.053959[/C][C]-0.4547[/C][C]0.325369[/C][/ROW]
[ROW][C]31[/C][C]0.009721[/C][C]0.0819[/C][C]0.467475[/C][/ROW]
[ROW][C]32[/C][C]0.085584[/C][C]0.7211[/C][C]0.236594[/C][/ROW]
[ROW][C]33[/C][C]-0.026342[/C][C]-0.222[/C][C]0.412491[/C][/ROW]
[ROW][C]34[/C][C]0.151869[/C][C]1.2797[/C][C]0.102413[/C][/ROW]
[ROW][C]35[/C][C]-0.014159[/C][C]-0.1193[/C][C]0.452685[/C][/ROW]
[ROW][C]36[/C][C]-0.072592[/C][C]-0.6117[/C][C]0.271355[/C][/ROW]
[ROW][C]37[/C][C]0.17917[/C][C]1.5097[/C][C]0.067777[/C][/ROW]
[ROW][C]38[/C][C]0.091934[/C][C]0.7746[/C][C]0.22056[/C][/ROW]
[ROW][C]39[/C][C]0.052514[/C][C]0.4425[/C][C]0.329741[/C][/ROW]
[ROW][C]40[/C][C]0.022865[/C][C]0.1927[/C][C]0.423886[/C][/ROW]
[ROW][C]41[/C][C]-0.027514[/C][C]-0.2318[/C][C]0.408667[/C][/ROW]
[ROW][C]42[/C][C]0.084394[/C][C]0.7111[/C][C]0.23967[/C][/ROW]
[ROW][C]43[/C][C]-0.025789[/C][C]-0.2173[/C][C]0.414299[/C][/ROW]
[ROW][C]44[/C][C]-0.034648[/C][C]-0.2919[/C][C]0.385589[/C][/ROW]
[ROW][C]45[/C][C]-0.005274[/C][C]-0.0444[/C][C]0.482338[/C][/ROW]
[ROW][C]46[/C][C]-0.077844[/C][C]-0.6559[/C][C]0.256996[/C][/ROW]
[ROW][C]47[/C][C]-0.039588[/C][C]-0.3336[/C][C]0.369842[/C][/ROW]
[ROW][C]48[/C][C]-0.101464[/C][C]-0.855[/C][C]0.197727[/C][/ROW]
[/TABLE]
Source: https://freestatistics.org/blog/index.php?pk=193717&T=1

Globally Unique Identifier (entire table): ba.freestatistics.org/blog/index.php?pk=193717&T=1

As an alternative you can also use a QR Code:  

The GUIDs for individual cells are displayed in the table below:

Autocorrelation Function
Time lag kACF(k)T-STATP-value
1-0.013785-0.11620.453931
20.0010640.0090.496437
30.1155120.97330.166849
4-0.102265-0.86170.195877
50.1025730.86430.195167
60.0969430.81690.208372
7-0.049723-0.4190.338249
80.0930920.78440.217705
9-0.142321-1.19920.117215
10-0.05156-0.43450.332639
11-0.039256-0.33080.370894
12-0.117042-0.98620.163689
130.0499770.42110.337473
14-0.041294-0.3480.364454
15-0.084469-0.71170.239477
160.0521820.43970.330748
17-0.173358-1.46070.074249
180.0551940.46510.32165
190.128081.07920.142072
200.000830.0070.497218
21-0.096942-0.81690.208373
22-0.021766-0.18340.427502
23-0.052638-0.44350.329364
240.0980210.82590.205803
25-0.058596-0.49370.311507
260.0119960.10110.459885
270.0589110.49640.310576
28-0.076459-0.64430.260743
29-0.063932-0.53870.295889
30-0.053959-0.45470.325369
310.0097210.08190.467475
320.0855840.72110.236594
33-0.026342-0.2220.412491
340.1518691.27970.102413
35-0.014159-0.11930.452685
36-0.072592-0.61170.271355
370.179171.50970.067777
380.0919340.77460.22056
390.0525140.44250.329741
400.0228650.19270.423886
41-0.027514-0.23180.408667
420.0843940.71110.23967
43-0.025789-0.21730.414299
44-0.034648-0.29190.385589
45-0.005274-0.04440.482338
46-0.077844-0.65590.256996
47-0.039588-0.33360.369842
48-0.101464-0.8550.197727


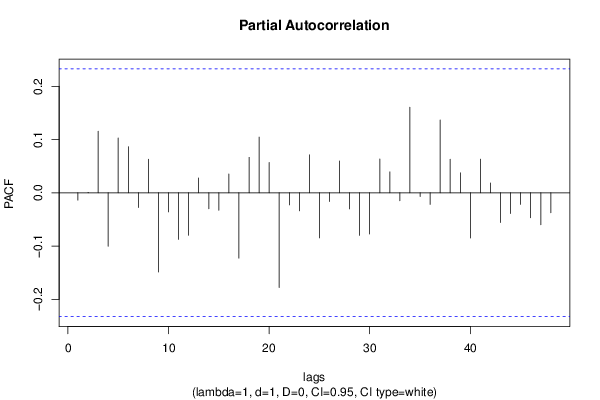
Partial Autocorrelation Function
Time lag kPACF(k)T-STATP-value
1-0.013785-0.11620.453931
20.0008740.00740.497073
30.1155610.97370.166748
4-0.100432-0.84630.200127
50.1029410.86740.194325
60.0864870.72880.234274
7-0.027528-0.2320.408619
80.0630210.5310.298529
9-0.148745-1.25340.107095
10-0.035798-0.30160.381904
11-0.087463-0.7370.231784
12-0.079813-0.67250.251719
130.0279270.23530.40732
14-0.03004-0.25310.400452
15-0.032731-0.27580.391754
160.0352510.2970.383654
17-0.122729-1.03410.152292
180.0665410.56070.28839
190.104550.8810.190657
200.056970.480.316338
21-0.177962-1.49950.069084
22-0.022765-0.19180.424216
23-0.033898-0.28560.387996
240.0712590.60040.275063
25-0.084742-0.7140.23877
26-0.016487-0.13890.444953
270.0596620.50270.308358
28-0.030265-0.2550.399723
29-0.080051-0.67450.251085
30-0.077512-0.65310.257891
310.0635560.53550.296977
320.0393810.33180.370499
33-0.014869-0.12530.450324
340.160791.35480.089882
35-0.006842-0.05760.477095
36-0.021733-0.18310.427611
370.1366451.15140.126716
380.0629540.53050.298724
390.0373960.31510.376803
40-0.085045-0.71660.237985
410.0632060.53260.297992
420.0182940.15420.438964
43-0.055884-0.47090.319583
44-0.038896-0.32770.372034
45-0.021688-0.18270.42776
46-0.046854-0.39480.347088
47-0.060001-0.50560.307359
48-0.037396-0.31510.376805

\begin{tabular}{lllllllll}
\hline
Partial Autocorrelation Function \tabularnewline
Time lag k & PACF(k) & T-STAT & P-value \tabularnewline
1 & -0.013785 & -0.1162 & 0.453931 \tabularnewline
2 & 0.000874 & 0.0074 & 0.497073 \tabularnewline
3 & 0.115561 & 0.9737 & 0.166748 \tabularnewline
4 & -0.100432 & -0.8463 & 0.200127 \tabularnewline
5 & 0.102941 & 0.8674 & 0.194325 \tabularnewline
6 & 0.086487 & 0.7288 & 0.234274 \tabularnewline
7 & -0.027528 & -0.232 & 0.408619 \tabularnewline
8 & 0.063021 & 0.531 & 0.298529 \tabularnewline
9 & -0.148745 & -1.2534 & 0.107095 \tabularnewline
10 & -0.035798 & -0.3016 & 0.381904 \tabularnewline
11 & -0.087463 & -0.737 & 0.231784 \tabularnewline
12 & -0.079813 & -0.6725 & 0.251719 \tabularnewline
13 & 0.027927 & 0.2353 & 0.40732 \tabularnewline
14 & -0.03004 & -0.2531 & 0.400452 \tabularnewline
15 & -0.032731 & -0.2758 & 0.391754 \tabularnewline
16 & 0.035251 & 0.297 & 0.383654 \tabularnewline
17 & -0.122729 & -1.0341 & 0.152292 \tabularnewline
18 & 0.066541 & 0.5607 & 0.28839 \tabularnewline
19 & 0.10455 & 0.881 & 0.190657 \tabularnewline
20 & 0.05697 & 0.48 & 0.316338 \tabularnewline
21 & -0.177962 & -1.4995 & 0.069084 \tabularnewline
22 & -0.022765 & -0.1918 & 0.424216 \tabularnewline
23 & -0.033898 & -0.2856 & 0.387996 \tabularnewline
24 & 0.071259 & 0.6004 & 0.275063 \tabularnewline
25 & -0.084742 & -0.714 & 0.23877 \tabularnewline
26 & -0.016487 & -0.1389 & 0.444953 \tabularnewline
27 & 0.059662 & 0.5027 & 0.308358 \tabularnewline
28 & -0.030265 & -0.255 & 0.399723 \tabularnewline
29 & -0.080051 & -0.6745 & 0.251085 \tabularnewline
30 & -0.077512 & -0.6531 & 0.257891 \tabularnewline
31 & 0.063556 & 0.5355 & 0.296977 \tabularnewline
32 & 0.039381 & 0.3318 & 0.370499 \tabularnewline
33 & -0.014869 & -0.1253 & 0.450324 \tabularnewline
34 & 0.16079 & 1.3548 & 0.089882 \tabularnewline
35 & -0.006842 & -0.0576 & 0.477095 \tabularnewline
36 & -0.021733 & -0.1831 & 0.427611 \tabularnewline
37 & 0.136645 & 1.1514 & 0.126716 \tabularnewline
38 & 0.062954 & 0.5305 & 0.298724 \tabularnewline
39 & 0.037396 & 0.3151 & 0.376803 \tabularnewline
40 & -0.085045 & -0.7166 & 0.237985 \tabularnewline
41 & 0.063206 & 0.5326 & 0.297992 \tabularnewline
42 & 0.018294 & 0.1542 & 0.438964 \tabularnewline
43 & -0.055884 & -0.4709 & 0.319583 \tabularnewline
44 & -0.038896 & -0.3277 & 0.372034 \tabularnewline
45 & -0.021688 & -0.1827 & 0.42776 \tabularnewline
46 & -0.046854 & -0.3948 & 0.347088 \tabularnewline
47 & -0.060001 & -0.5056 & 0.307359 \tabularnewline
48 & -0.037396 & -0.3151 & 0.376805 \tabularnewline
\hline
\end{tabular}
%Source: https://freestatistics.org/blog/index.php?pk=193717&T=2

[TABLE]
[ROW][C]Partial Autocorrelation Function[/C][/ROW]
[ROW][C]Time lag k[/C][C]PACF(k)[/C][C]T-STAT[/C][C]P-value[/C][/ROW]
[ROW][C]1[/C][C]-0.013785[/C][C]-0.1162[/C][C]0.453931[/C][/ROW]
[ROW][C]2[/C][C]0.000874[/C][C]0.0074[/C][C]0.497073[/C][/ROW]
[ROW][C]3[/C][C]0.115561[/C][C]0.9737[/C][C]0.166748[/C][/ROW]
[ROW][C]4[/C][C]-0.100432[/C][C]-0.8463[/C][C]0.200127[/C][/ROW]
[ROW][C]5[/C][C]0.102941[/C][C]0.8674[/C][C]0.194325[/C][/ROW]
[ROW][C]6[/C][C]0.086487[/C][C]0.7288[/C][C]0.234274[/C][/ROW]
[ROW][C]7[/C][C]-0.027528[/C][C]-0.232[/C][C]0.408619[/C][/ROW]
[ROW][C]8[/C][C]0.063021[/C][C]0.531[/C][C]0.298529[/C][/ROW]
[ROW][C]9[/C][C]-0.148745[/C][C]-1.2534[/C][C]0.107095[/C][/ROW]
[ROW][C]10[/C][C]-0.035798[/C][C]-0.3016[/C][C]0.381904[/C][/ROW]
[ROW][C]11[/C][C]-0.087463[/C][C]-0.737[/C][C]0.231784[/C][/ROW]
[ROW][C]12[/C][C]-0.079813[/C][C]-0.6725[/C][C]0.251719[/C][/ROW]
[ROW][C]13[/C][C]0.027927[/C][C]0.2353[/C][C]0.40732[/C][/ROW]
[ROW][C]14[/C][C]-0.03004[/C][C]-0.2531[/C][C]0.400452[/C][/ROW]
[ROW][C]15[/C][C]-0.032731[/C][C]-0.2758[/C][C]0.391754[/C][/ROW]
[ROW][C]16[/C][C]0.035251[/C][C]0.297[/C][C]0.383654[/C][/ROW]
[ROW][C]17[/C][C]-0.122729[/C][C]-1.0341[/C][C]0.152292[/C][/ROW]
[ROW][C]18[/C][C]0.066541[/C][C]0.5607[/C][C]0.28839[/C][/ROW]
[ROW][C]19[/C][C]0.10455[/C][C]0.881[/C][C]0.190657[/C][/ROW]
[ROW][C]20[/C][C]0.05697[/C][C]0.48[/C][C]0.316338[/C][/ROW]
[ROW][C]21[/C][C]-0.177962[/C][C]-1.4995[/C][C]0.069084[/C][/ROW]
[ROW][C]22[/C][C]-0.022765[/C][C]-0.1918[/C][C]0.424216[/C][/ROW]
[ROW][C]23[/C][C]-0.033898[/C][C]-0.2856[/C][C]0.387996[/C][/ROW]
[ROW][C]24[/C][C]0.071259[/C][C]0.6004[/C][C]0.275063[/C][/ROW]
[ROW][C]25[/C][C]-0.084742[/C][C]-0.714[/C][C]0.23877[/C][/ROW]
[ROW][C]26[/C][C]-0.016487[/C][C]-0.1389[/C][C]0.444953[/C][/ROW]
[ROW][C]27[/C][C]0.059662[/C][C]0.5027[/C][C]0.308358[/C][/ROW]
[ROW][C]28[/C][C]-0.030265[/C][C]-0.255[/C][C]0.399723[/C][/ROW]
[ROW][C]29[/C][C]-0.080051[/C][C]-0.6745[/C][C]0.251085[/C][/ROW]
[ROW][C]30[/C][C]-0.077512[/C][C]-0.6531[/C][C]0.257891[/C][/ROW]
[ROW][C]31[/C][C]0.063556[/C][C]0.5355[/C][C]0.296977[/C][/ROW]
[ROW][C]32[/C][C]0.039381[/C][C]0.3318[/C][C]0.370499[/C][/ROW]
[ROW][C]33[/C][C]-0.014869[/C][C]-0.1253[/C][C]0.450324[/C][/ROW]
[ROW][C]34[/C][C]0.16079[/C][C]1.3548[/C][C]0.089882[/C][/ROW]
[ROW][C]35[/C][C]-0.006842[/C][C]-0.0576[/C][C]0.477095[/C][/ROW]
[ROW][C]36[/C][C]-0.021733[/C][C]-0.1831[/C][C]0.427611[/C][/ROW]
[ROW][C]37[/C][C]0.136645[/C][C]1.1514[/C][C]0.126716[/C][/ROW]
[ROW][C]38[/C][C]0.062954[/C][C]0.5305[/C][C]0.298724[/C][/ROW]
[ROW][C]39[/C][C]0.037396[/C][C]0.3151[/C][C]0.376803[/C][/ROW]
[ROW][C]40[/C][C]-0.085045[/C][C]-0.7166[/C][C]0.237985[/C][/ROW]
[ROW][C]41[/C][C]0.063206[/C][C]0.5326[/C][C]0.297992[/C][/ROW]
[ROW][C]42[/C][C]0.018294[/C][C]0.1542[/C][C]0.438964[/C][/ROW]
[ROW][C]43[/C][C]-0.055884[/C][C]-0.4709[/C][C]0.319583[/C][/ROW]
[ROW][C]44[/C][C]-0.038896[/C][C]-0.3277[/C][C]0.372034[/C][/ROW]
[ROW][C]45[/C][C]-0.021688[/C][C]-0.1827[/C][C]0.42776[/C][/ROW]
[ROW][C]46[/C][C]-0.046854[/C][C]-0.3948[/C][C]0.347088[/C][/ROW]
[ROW][C]47[/C][C]-0.060001[/C][C]-0.5056[/C][C]0.307359[/C][/ROW]
[ROW][C]48[/C][C]-0.037396[/C][C]-0.3151[/C][C]0.376805[/C][/ROW]
[/TABLE]
Source: https://freestatistics.org/blog/index.php?pk=193717&T=2

Globally Unique Identifier (entire table): ba.freestatistics.org/blog/index.php?pk=193717&T=2

As an alternative you can also use a QR Code:  

The GUIDs for individual cells are displayed in the table below:

Partial Autocorrelation Function
Time lag kPACF(k)T-STATP-value
1-0.013785-0.11620.453931
20.0008740.00740.497073
30.1155610.97370.166748
4-0.100432-0.84630.200127
50.1029410.86740.194325
60.0864870.72880.234274
7-0.027528-0.2320.408619
80.0630210.5310.298529
9-0.148745-1.25340.107095
10-0.035798-0.30160.381904
11-0.087463-0.7370.231784
12-0.079813-0.67250.251719
130.0279270.23530.40732
14-0.03004-0.25310.400452
15-0.032731-0.27580.391754
160.0352510.2970.383654
17-0.122729-1.03410.152292
180.0665410.56070.28839
190.104550.8810.190657
200.056970.480.316338
21-0.177962-1.49950.069084
22-0.022765-0.19180.424216
23-0.033898-0.28560.387996
240.0712590.60040.275063
25-0.084742-0.7140.23877
26-0.016487-0.13890.444953
270.0596620.50270.308358
28-0.030265-0.2550.399723
29-0.080051-0.67450.251085
30-0.077512-0.65310.257891
310.0635560.53550.296977
320.0393810.33180.370499
33-0.014869-0.12530.450324
340.160791.35480.089882
35-0.006842-0.05760.477095
36-0.021733-0.18310.427611
370.1366451.15140.126716
380.0629540.53050.298724
390.0373960.31510.376803
40-0.085045-0.71660.237985
410.0632060.53260.297992
420.0182940.15420.438964
43-0.055884-0.47090.319583
44-0.038896-0.32770.372034
45-0.021688-0.18270.42776
46-0.046854-0.39480.347088
47-0.060001-0.50560.307359
48-0.037396-0.31510.376805


Parameters (Session):
par1 = 48 ; par2 = 1 ; par3 = 1 ; par4 = 0 ; par5 = 12 ; par6 = White Noise ; par7 = 0.95 ;
Parameters (R input):
par1 = 48 ; par2 = 1 ; par3 = 1 ; par4 = 0 ; par5 = 12 ; par6 = White Noise ; par7 = 0.95 ; par8 = ;
R code (references can be found in the software module):
if (par1 == 'Default') {
par1 = 10*log10(length(x))
} else {
par1 <- as.numeric(par1)
}
par2 <- as.numeric(par2)
par3 <- as.numeric(par3)
par4 <- as.numeric(par4)
par5 <- as.numeric(par5)
if (par6 == 'White Noise') par6 <- 'white' else par6 <- 'ma'
par7 <- as.numeric(par7)
if (par8 != '') par8 <- as.numeric(par8)
ox <- x
if (par8 == '') {
if (par2 == 0) {
x <- log(x)
} else {
x <- (x ^ par2 - 1) / par2
}
} else {
x <- log(x,base=par8)
}
if (par3 > 0) x <- diff(x,lag=1,difference=par3)
if (par4 > 0) x <- diff(x,lag=par5,difference=par4)
bitmap(file='picts.png')
op <- par(mfrow=c(2,1))
plot(ox,type='l',main='Original Time Series',xlab='time',ylab='value')
if (par8=='') {
mytitle <- paste('Working Time Series (lambda=',par2,', d=',par3,', D=',par4,')',sep='')
mysub <- paste('(lambda=',par2,', d=',par3,', D=',par4,', CI=', par7, ', CI type=',par6,')',sep='')
} else {
mytitle <- paste('Working Time Series (base=',par8,', d=',par3,', D=',par4,')',sep='')
mysub <- paste('(base=',par8,', d=',par3,', D=',par4,', CI=', par7, ', CI type=',par6,')',sep='')
}
plot(x,type='l', main=mytitle,xlab='time',ylab='value')
par(op)
dev.off()
bitmap(file='pic1.png')
racf <- acf(x, par1, main='Autocorrelation', xlab='time lag', ylab='ACF', ci.type=par6, ci=par7, sub=mysub)
dev.off()
bitmap(file='pic2.png')
rpacf <- pacf(x,par1,main='Partial Autocorrelation',xlab='lags',ylab='PACF',sub=mysub)
dev.off()
(myacf <- c(racf$acf))
(mypacf <- c(rpacf$acf))
lengthx <- length(x)
sqrtn <- sqrt(lengthx)
load(file='createtable')
a<-table.start()
a<-table.row.start(a)
a<-table.element(a,'Autocorrelation Function',4,TRUE)
a<-table.row.end(a)
a<-table.row.start(a)
a<-table.element(a,'Time lag k',header=TRUE)
a<-table.element(a,hyperlink('basics.htm','ACF(k)','click here for more information about the Autocorrelation Function'),header=TRUE)
a<-table.element(a,'T-STAT',header=TRUE)
a<-table.element(a,'P-value',header=TRUE)
a<-table.row.end(a)
for (i in 2:(par1+1)) {
a<-table.row.start(a)
a<-table.element(a,i-1,header=TRUE)
a<-table.element(a,round(myacf[i],6))
mytstat <- myacf[i]*sqrtn
a<-table.element(a,round(mytstat,4))
a<-table.element(a,round(1-pt(abs(mytstat),lengthx),6))
a<-table.row.end(a)
}
a<-table.end(a)
table.save(a,file='mytable.tab')
a<-table.start()
a<-table.row.start(a)
a<-table.element(a,'Partial Autocorrelation Function',4,TRUE)
a<-table.row.end(a)
a<-table.row.start(a)
a<-table.element(a,'Time lag k',header=TRUE)
a<-table.element(a,hyperlink('basics.htm','PACF(k)','click here for more information about the Partial Autocorrelation Function'),header=TRUE)
a<-table.element(a,'T-STAT',header=TRUE)
a<-table.element(a,'P-value',header=TRUE)
a<-table.row.end(a)
for (i in 1:par1) {
a<-table.row.start(a)
a<-table.element(a,i,header=TRUE)
a<-table.element(a,round(mypacf[i],6))
mytstat <- mypacf[i]*sqrtn
a<-table.element(a,round(mytstat,4))
a<-table.element(a,round(1-pt(abs(mytstat),lengthx),6))
a<-table.row.end(a)
}
a<-table.end(a)
table.save(a,file='mytable1.tab')