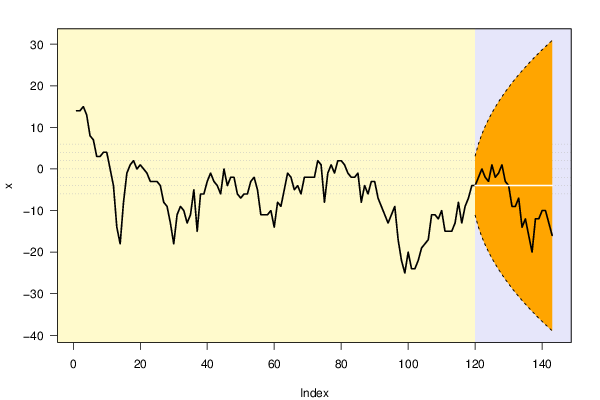
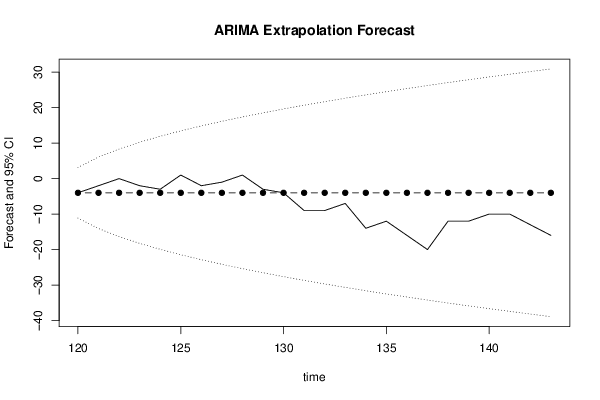
| Univariate ARIMA Extrapolation Forecast | ||||||||
| time | Y[t] | F[t] | 95% LB | 95% UB | p-value (H0: Y[t] = F[t]) | P(F[t]>Y[t-1]) | P(F[t]>Y[t-s]) | P(F[t]>Y[119]) |
| 115 | -8 | - | - | - | - | - | - | - |
| 116 | -13 | - | - | - | - | - | - | - |
| 117 | -9 | - | - | - | - | - | - | - |
| 118 | -7 | - | - | - | - | - | - | - |
| 119 | -4 | - | - | - | - | - | - | - |
| 120 | -4 | -4 | -11.1265 | 3.1265 | 0.5 | 0.5 | 0.9933 | 0.5 |
| 121 | -2 | -4 | -14.0784 | 6.0784 | 0.3487 | 0.5 | 0.8346 | 0.5 |
| 122 | 0 | -4 | -16.3435 | 8.3435 | 0.2627 | 0.3754 | 0.6831 | 0.5 |
| 123 | -2 | -4 | -18.253 | 10.253 | 0.3916 | 0.2911 | 0.5 | 0.5 |
| 124 | -3 | -4 | -19.9354 | 11.9354 | 0.4511 | 0.4028 | 0.5 | 0.5 |
| 125 | 1 | -4 | -21.4563 | 13.4563 | 0.2873 | 0.4553 | 0.4112 | 0.5 |
| 126 | -2 | -4 | -22.855 | 14.855 | 0.4177 | 0.3016 | 0.3388 | 0.5 |
| 127 | -1 | -4 | -24.1568 | 16.1568 | 0.3853 | 0.4229 | 0.4229 | 0.5 |
| 128 | 1 | -4 | -25.3796 | 17.3796 | 0.3233 | 0.3916 | 0.4635 | 0.5 |
| 129 | -3 | -4 | -26.536 | 18.536 | 0.4653 | 0.3318 | 0.3318 | 0.5 |
| 130 | -4 | -4 | -27.636 | 19.636 | 0.5 | 0.467 | 0.4341 | 0.5 |
| 131 | -9 | -4 | -28.687 | 20.687 | 0.3457 | 0.5 | 0.4059 | 0.5 |
| 132 | -9 | -4 | -29.695 | 21.695 | 0.3515 | 0.6485 | 0.3515 | 0.5 |
| 133 | -7 | -4 | -30.665 | 22.665 | 0.4127 | 0.6434 | 0.4707 | 0.5 |
| 134 | -14 | -4 | -31.6009 | 23.6009 | 0.2388 | 0.5844 | 0.5 | 0.5 |
| 135 | -12 | -4 | -32.5061 | 24.5061 | 0.2911 | 0.7541 | 0.6345 | 0.5 |
| 136 | -16 | -4 | -33.3834 | 25.3834 | 0.2117 | 0.7032 | 0.6306 | 0.5 |
| 137 | -20 | -4 | -34.2353 | 26.2353 | 0.1498 | 0.7817 | 0.5771 | 0.5 |
| 138 | -12 | -4 | -35.0638 | 27.0638 | 0.3069 | 0.8436 | 0.736 | 0.5 |
| 139 | -12 | -4 | -35.8708 | 27.8708 | 0.3114 | 0.6886 | 0.6886 | 0.5 |
| 140 | -10 | -4 | -36.6578 | 28.6578 | 0.3594 | 0.6844 | 0.7643 | 0.5 |
| 141 | -10 | -4 | -37.4263 | 29.4263 | 0.3625 | 0.6375 | 0.8259 | 0.5 |
| 142 | -13 | -4 | -38.1776 | 30.1776 | 0.3029 | 0.6346 | 0.6768 | 0.5 |
| 143 | -16 | -4 | -38.9127 | 30.9127 | 0.2503 | 0.6933 | 0.6733 | 0.5 |
| Univariate ARIMA Extrapolation Forecast Performance | ||||||
| time | % S.E. | PE | MAPE | Sq.E | MSE | RMSE |
| 120 | -0.909 | 0 | 0 | 0 | 0 | 0 |
| 121 | -1.2855 | -0.5 | 0.25 | 4 | 2 | 1.4142 |
| 122 | -1.5744 | -1 | 0.5 | 16 | 6.6667 | 2.582 |
| 123 | -1.818 | -0.5 | 0.5 | 4 | 6 | 2.4495 |
| 124 | -2.0326 | -0.25 | 0.45 | 1 | 5 | 2.2361 |
| 125 | -2.2266 | -1.25 | 0.5833 | 25 | 8.3333 | 2.8868 |
| 126 | -2.405 | -0.5 | 0.5714 | 4 | 7.7143 | 2.7775 |
| 127 | -2.571 | -0.75 | 0.5938 | 9 | 7.875 | 2.8062 |
| 128 | -2.727 | -1.25 | 0.6667 | 25 | 9.7778 | 3.1269 |
| 129 | -2.8745 | -0.25 | 0.625 | 1 | 8.9 | 2.9833 |
| 130 | -3.0148 | 0 | 0.5682 | 0 | 8.0909 | 2.8445 |
| 131 | -3.1488 | 1.25 | 0.625 | 25 | 9.5 | 3.0822 |
| 132 | -3.2774 | 1.25 | 0.6731 | 25 | 10.6923 | 3.2699 |
| 133 | -3.4011 | 0.75 | 0.6786 | 9 | 10.5714 | 3.2514 |
| 134 | -3.5205 | 2.5 | 0.8 | 100 | 16.5333 | 4.0661 |
| 135 | -3.636 | 2 | 0.875 | 64 | 19.5 | 4.4159 |
| 136 | -3.7479 | 3 | 1 | 144 | 26.8235 | 5.1791 |
| 137 | -3.8565 | 4 | 1.1667 | 256 | 39.5556 | 6.2893 |
| 138 | -3.9622 | 2 | 1.2105 | 64 | 40.8421 | 6.3908 |
| 139 | -4.0651 | 2 | 1.25 | 64 | 42 | 6.4807 |
| 140 | -4.1655 | 1.5 | 1.2619 | 36 | 41.7143 | 6.4587 |
| 141 | -4.2636 | 1.5 | 1.2727 | 36 | 41.4545 | 6.4385 |
| 142 | -4.3594 | 2.25 | 1.3152 | 81 | 43.1739 | 6.5707 |
| 143 | -4.4531 | 3 | 1.3854 | 144 | 47.375 | 6.8829 |