Free Statistics

of Irreproducible Research!

Author's title

Author*Unverified author*
R Software Modulerwasp_autocorrelation.wasp
Title produced by software(Partial) Autocorrelation Function
Date of computationMon, 26 Nov 2012 13:13:04 -0500
Cite this page as followsStatistical Computations at FreeStatistics.org, Office for Research Development and Education, URL https://freestatistics.org/blog/index.php?v=date/2012/Nov/26/t1353953701t6z3p67p6m43u4m.htm/, Retrieved Tue, 30 Apr 2024 07:13:14 +0000
Statistical Computations at FreeStatistics.org, Office for Research Development and Education, URL https://freestatistics.org/blog/index.php?pk=193435, Retrieved Tue, 30 Apr 2024 07:13:14 +0000
QR Codes:

Original text written by user:
IsPrivate?No (this computation is public)
User-defined keywords
Estimated Impact79
Family? (F = Feedback message, R = changed R code, M = changed R Module, P = changed Parameters, D = changed Data)
-       [(Partial) Autocorrelation Function] [sigaretten: autoc...] [2012-11-26 18:13:04] [4ab20b1300d6ce8ed8a6f2d2c22a072d] [Current]
Feedback Forum

Post a new message
Dataseries X:
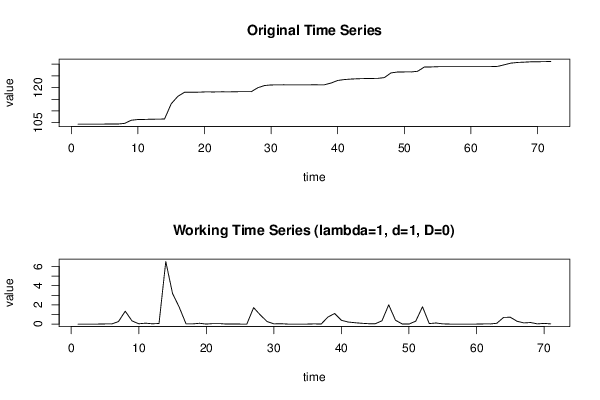
104.4
104.4
104.4
104.4
104.4
104.41
104.42
104.68
106.02
106.35
106.38
106.47
106.5
106.56
113.07
116.26
118
118.02
118.04
118.12
118.12
118.17
118.22
118.22
118.23
118.23
118.23
119.94
120.88
121.14
121.16
121.2
121.2
121.2
121.2
121.2
121.22
121.22
121.95
123.05
123.44
123.65
123.79
123.87
123.91
123.94
124.28
126.28
126.68
126.69
126.69
126.99
128.79
128.84
128.95
128.97
128.97
128.97
128.97
128.97
128.97
128.98
128.99
129.07
129.76
130.47
130.76
130.88
131.04
131.06
131.13
131.15


Summary of computational transaction
Raw Inputview raw input (R code)
Raw Outputview raw output of R engine
Computing time3 seconds
R Server'Gertrude Mary Cox' @ cox.wessa.net

\begin{tabular}{lllllllll}
\hline
Summary of computational transaction \tabularnewline
Raw Input & view raw input (R code)  \tabularnewline
Raw Output & view raw output of R engine  \tabularnewline
Computing time & 3 seconds \tabularnewline
R Server & 'Gertrude Mary Cox' @ cox.wessa.net \tabularnewline
\hline
\end{tabular}
%Source: https://freestatistics.org/blog/index.php?pk=193435&T=0

[TABLE]
[ROW][C]Summary of computational transaction[/C][/ROW]
[ROW][C]Raw Input[/C][C]view raw input (R code) [/C][/ROW]
[ROW][C]Raw Output[/C][C]view raw output of R engine [/C][/ROW]
[ROW][C]Computing time[/C][C]3 seconds[/C][/ROW]
[ROW][C]R Server[/C][C]'Gertrude Mary Cox' @ cox.wessa.net[/C][/ROW]
[/TABLE]
Source: https://freestatistics.org/blog/index.php?pk=193435&T=0

Globally Unique Identifier (entire table): ba.freestatistics.org/blog/index.php?pk=193435&T=0

As an alternative you can also use a QR Code:  

The GUIDs for individual cells are displayed in the table below:

Summary of computational transaction
Raw Inputview raw input (R code)
Raw Outputview raw output of R engine
Computing time3 seconds
R Server'Gertrude Mary Cox' @ cox.wessa.net


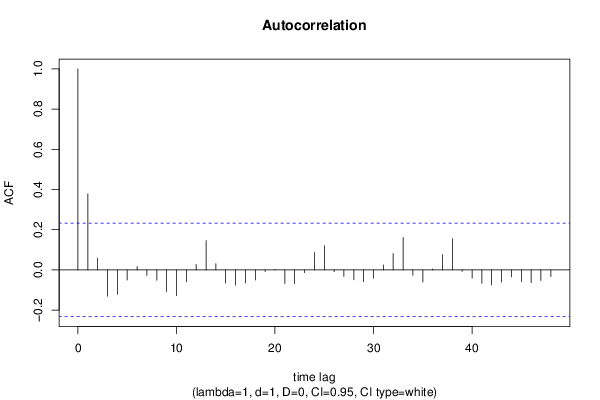
Autocorrelation Function
Time lag kACF(k)T-STATP-value
10.3785963.19010.001059
20.0581250.48980.312903
3-0.131086-1.10460.136541
4-0.121109-1.02050.155481
5-0.050505-0.42560.335856
60.0172740.14560.442342
7-0.027692-0.23330.408085
8-0.051815-0.43660.331862
9-0.107386-0.90490.184302
10-0.127922-1.07790.142366
11-0.059323-0.49990.309358
120.0270820.22820.410075
130.145761.22820.111715
140.0307960.25950.398002
15-0.065521-0.55210.29131
16-0.07581-0.63880.262509
17-0.064208-0.5410.295092
18-0.050235-0.42330.336683
19-0.00797-0.06720.473321
200.0007550.00640.497472
21-0.067324-0.56730.286155
22-0.068736-0.57920.282152
23-0.013755-0.11590.454028
240.0870630.73360.232802
250.1201881.01270.157317
26-0.008555-0.07210.471367
27-0.033168-0.27950.390346
28-0.04892-0.41220.340714
29-0.059402-0.50050.309126
30-0.040854-0.34420.36584
310.0247280.20840.417772
320.0815660.68730.247069
330.1616111.36180.088789
34-0.026453-0.22290.412127
35-0.060668-0.51120.3054
360.0042260.03560.485846
370.0762320.64230.26136
380.1551931.30770.097601
39-0.007322-0.06170.47549
40-0.04085-0.34420.365855
41-0.066183-0.55770.289412
42-0.074532-0.6280.266003
43-0.060472-0.50950.305975
44-0.03456-0.29120.385871
45-0.057442-0.4840.314931
46-0.063235-0.53280.297908
47-0.052639-0.44350.32936
48-0.03324-0.28010.390114

\begin{tabular}{lllllllll}
\hline
Autocorrelation Function \tabularnewline
Time lag k & ACF(k) & T-STAT & P-value \tabularnewline
1 & 0.378596 & 3.1901 & 0.001059 \tabularnewline
2 & 0.058125 & 0.4898 & 0.312903 \tabularnewline
3 & -0.131086 & -1.1046 & 0.136541 \tabularnewline
4 & -0.121109 & -1.0205 & 0.155481 \tabularnewline
5 & -0.050505 & -0.4256 & 0.335856 \tabularnewline
6 & 0.017274 & 0.1456 & 0.442342 \tabularnewline
7 & -0.027692 & -0.2333 & 0.408085 \tabularnewline
8 & -0.051815 & -0.4366 & 0.331862 \tabularnewline
9 & -0.107386 & -0.9049 & 0.184302 \tabularnewline
10 & -0.127922 & -1.0779 & 0.142366 \tabularnewline
11 & -0.059323 & -0.4999 & 0.309358 \tabularnewline
12 & 0.027082 & 0.2282 & 0.410075 \tabularnewline
13 & 0.14576 & 1.2282 & 0.111715 \tabularnewline
14 & 0.030796 & 0.2595 & 0.398002 \tabularnewline
15 & -0.065521 & -0.5521 & 0.29131 \tabularnewline
16 & -0.07581 & -0.6388 & 0.262509 \tabularnewline
17 & -0.064208 & -0.541 & 0.295092 \tabularnewline
18 & -0.050235 & -0.4233 & 0.336683 \tabularnewline
19 & -0.00797 & -0.0672 & 0.473321 \tabularnewline
20 & 0.000755 & 0.0064 & 0.497472 \tabularnewline
21 & -0.067324 & -0.5673 & 0.286155 \tabularnewline
22 & -0.068736 & -0.5792 & 0.282152 \tabularnewline
23 & -0.013755 & -0.1159 & 0.454028 \tabularnewline
24 & 0.087063 & 0.7336 & 0.232802 \tabularnewline
25 & 0.120188 & 1.0127 & 0.157317 \tabularnewline
26 & -0.008555 & -0.0721 & 0.471367 \tabularnewline
27 & -0.033168 & -0.2795 & 0.390346 \tabularnewline
28 & -0.04892 & -0.4122 & 0.340714 \tabularnewline
29 & -0.059402 & -0.5005 & 0.309126 \tabularnewline
30 & -0.040854 & -0.3442 & 0.36584 \tabularnewline
31 & 0.024728 & 0.2084 & 0.417772 \tabularnewline
32 & 0.081566 & 0.6873 & 0.247069 \tabularnewline
33 & 0.161611 & 1.3618 & 0.088789 \tabularnewline
34 & -0.026453 & -0.2229 & 0.412127 \tabularnewline
35 & -0.060668 & -0.5112 & 0.3054 \tabularnewline
36 & 0.004226 & 0.0356 & 0.485846 \tabularnewline
37 & 0.076232 & 0.6423 & 0.26136 \tabularnewline
38 & 0.155193 & 1.3077 & 0.097601 \tabularnewline
39 & -0.007322 & -0.0617 & 0.47549 \tabularnewline
40 & -0.04085 & -0.3442 & 0.365855 \tabularnewline
41 & -0.066183 & -0.5577 & 0.289412 \tabularnewline
42 & -0.074532 & -0.628 & 0.266003 \tabularnewline
43 & -0.060472 & -0.5095 & 0.305975 \tabularnewline
44 & -0.03456 & -0.2912 & 0.385871 \tabularnewline
45 & -0.057442 & -0.484 & 0.314931 \tabularnewline
46 & -0.063235 & -0.5328 & 0.297908 \tabularnewline
47 & -0.052639 & -0.4435 & 0.32936 \tabularnewline
48 & -0.03324 & -0.2801 & 0.390114 \tabularnewline
\hline
\end{tabular}
%Source: https://freestatistics.org/blog/index.php?pk=193435&T=1

[TABLE]
[ROW][C]Autocorrelation Function[/C][/ROW]
[ROW][C]Time lag k[/C][C]ACF(k)[/C][C]T-STAT[/C][C]P-value[/C][/ROW]
[ROW][C]1[/C][C]0.378596[/C][C]3.1901[/C][C]0.001059[/C][/ROW]
[ROW][C]2[/C][C]0.058125[/C][C]0.4898[/C][C]0.312903[/C][/ROW]
[ROW][C]3[/C][C]-0.131086[/C][C]-1.1046[/C][C]0.136541[/C][/ROW]
[ROW][C]4[/C][C]-0.121109[/C][C]-1.0205[/C][C]0.155481[/C][/ROW]
[ROW][C]5[/C][C]-0.050505[/C][C]-0.4256[/C][C]0.335856[/C][/ROW]
[ROW][C]6[/C][C]0.017274[/C][C]0.1456[/C][C]0.442342[/C][/ROW]
[ROW][C]7[/C][C]-0.027692[/C][C]-0.2333[/C][C]0.408085[/C][/ROW]
[ROW][C]8[/C][C]-0.051815[/C][C]-0.4366[/C][C]0.331862[/C][/ROW]
[ROW][C]9[/C][C]-0.107386[/C][C]-0.9049[/C][C]0.184302[/C][/ROW]
[ROW][C]10[/C][C]-0.127922[/C][C]-1.0779[/C][C]0.142366[/C][/ROW]
[ROW][C]11[/C][C]-0.059323[/C][C]-0.4999[/C][C]0.309358[/C][/ROW]
[ROW][C]12[/C][C]0.027082[/C][C]0.2282[/C][C]0.410075[/C][/ROW]
[ROW][C]13[/C][C]0.14576[/C][C]1.2282[/C][C]0.111715[/C][/ROW]
[ROW][C]14[/C][C]0.030796[/C][C]0.2595[/C][C]0.398002[/C][/ROW]
[ROW][C]15[/C][C]-0.065521[/C][C]-0.5521[/C][C]0.29131[/C][/ROW]
[ROW][C]16[/C][C]-0.07581[/C][C]-0.6388[/C][C]0.262509[/C][/ROW]
[ROW][C]17[/C][C]-0.064208[/C][C]-0.541[/C][C]0.295092[/C][/ROW]
[ROW][C]18[/C][C]-0.050235[/C][C]-0.4233[/C][C]0.336683[/C][/ROW]
[ROW][C]19[/C][C]-0.00797[/C][C]-0.0672[/C][C]0.473321[/C][/ROW]
[ROW][C]20[/C][C]0.000755[/C][C]0.0064[/C][C]0.497472[/C][/ROW]
[ROW][C]21[/C][C]-0.067324[/C][C]-0.5673[/C][C]0.286155[/C][/ROW]
[ROW][C]22[/C][C]-0.068736[/C][C]-0.5792[/C][C]0.282152[/C][/ROW]
[ROW][C]23[/C][C]-0.013755[/C][C]-0.1159[/C][C]0.454028[/C][/ROW]
[ROW][C]24[/C][C]0.087063[/C][C]0.7336[/C][C]0.232802[/C][/ROW]
[ROW][C]25[/C][C]0.120188[/C][C]1.0127[/C][C]0.157317[/C][/ROW]
[ROW][C]26[/C][C]-0.008555[/C][C]-0.0721[/C][C]0.471367[/C][/ROW]
[ROW][C]27[/C][C]-0.033168[/C][C]-0.2795[/C][C]0.390346[/C][/ROW]
[ROW][C]28[/C][C]-0.04892[/C][C]-0.4122[/C][C]0.340714[/C][/ROW]
[ROW][C]29[/C][C]-0.059402[/C][C]-0.5005[/C][C]0.309126[/C][/ROW]
[ROW][C]30[/C][C]-0.040854[/C][C]-0.3442[/C][C]0.36584[/C][/ROW]
[ROW][C]31[/C][C]0.024728[/C][C]0.2084[/C][C]0.417772[/C][/ROW]
[ROW][C]32[/C][C]0.081566[/C][C]0.6873[/C][C]0.247069[/C][/ROW]
[ROW][C]33[/C][C]0.161611[/C][C]1.3618[/C][C]0.088789[/C][/ROW]
[ROW][C]34[/C][C]-0.026453[/C][C]-0.2229[/C][C]0.412127[/C][/ROW]
[ROW][C]35[/C][C]-0.060668[/C][C]-0.5112[/C][C]0.3054[/C][/ROW]
[ROW][C]36[/C][C]0.004226[/C][C]0.0356[/C][C]0.485846[/C][/ROW]
[ROW][C]37[/C][C]0.076232[/C][C]0.6423[/C][C]0.26136[/C][/ROW]
[ROW][C]38[/C][C]0.155193[/C][C]1.3077[/C][C]0.097601[/C][/ROW]
[ROW][C]39[/C][C]-0.007322[/C][C]-0.0617[/C][C]0.47549[/C][/ROW]
[ROW][C]40[/C][C]-0.04085[/C][C]-0.3442[/C][C]0.365855[/C][/ROW]
[ROW][C]41[/C][C]-0.066183[/C][C]-0.5577[/C][C]0.289412[/C][/ROW]
[ROW][C]42[/C][C]-0.074532[/C][C]-0.628[/C][C]0.266003[/C][/ROW]
[ROW][C]43[/C][C]-0.060472[/C][C]-0.5095[/C][C]0.305975[/C][/ROW]
[ROW][C]44[/C][C]-0.03456[/C][C]-0.2912[/C][C]0.385871[/C][/ROW]
[ROW][C]45[/C][C]-0.057442[/C][C]-0.484[/C][C]0.314931[/C][/ROW]
[ROW][C]46[/C][C]-0.063235[/C][C]-0.5328[/C][C]0.297908[/C][/ROW]
[ROW][C]47[/C][C]-0.052639[/C][C]-0.4435[/C][C]0.32936[/C][/ROW]
[ROW][C]48[/C][C]-0.03324[/C][C]-0.2801[/C][C]0.390114[/C][/ROW]
[/TABLE]
Source: https://freestatistics.org/blog/index.php?pk=193435&T=1

Globally Unique Identifier (entire table): ba.freestatistics.org/blog/index.php?pk=193435&T=1

As an alternative you can also use a QR Code:  

The GUIDs for individual cells are displayed in the table below:

Autocorrelation Function
Time lag kACF(k)T-STATP-value
10.3785963.19010.001059
20.0581250.48980.312903
3-0.131086-1.10460.136541
4-0.121109-1.02050.155481
5-0.050505-0.42560.335856
60.0172740.14560.442342
7-0.027692-0.23330.408085
8-0.051815-0.43660.331862
9-0.107386-0.90490.184302
10-0.127922-1.07790.142366
11-0.059323-0.49990.309358
120.0270820.22820.410075
130.145761.22820.111715
140.0307960.25950.398002
15-0.065521-0.55210.29131
16-0.07581-0.63880.262509
17-0.064208-0.5410.295092
18-0.050235-0.42330.336683
19-0.00797-0.06720.473321
200.0007550.00640.497472
21-0.067324-0.56730.286155
22-0.068736-0.57920.282152
23-0.013755-0.11590.454028
240.0870630.73360.232802
250.1201881.01270.157317
26-0.008555-0.07210.471367
27-0.033168-0.27950.390346
28-0.04892-0.41220.340714
29-0.059402-0.50050.309126
30-0.040854-0.34420.36584
310.0247280.20840.417772
320.0815660.68730.247069
330.1616111.36180.088789
34-0.026453-0.22290.412127
35-0.060668-0.51120.3054
360.0042260.03560.485846
370.0762320.64230.26136
380.1551931.30770.097601
39-0.007322-0.06170.47549
40-0.04085-0.34420.365855
41-0.066183-0.55770.289412
42-0.074532-0.6280.266003
43-0.060472-0.50950.305975
44-0.03456-0.29120.385871
45-0.057442-0.4840.314931
46-0.063235-0.53280.297908
47-0.052639-0.44350.32936
48-0.03324-0.28010.390114


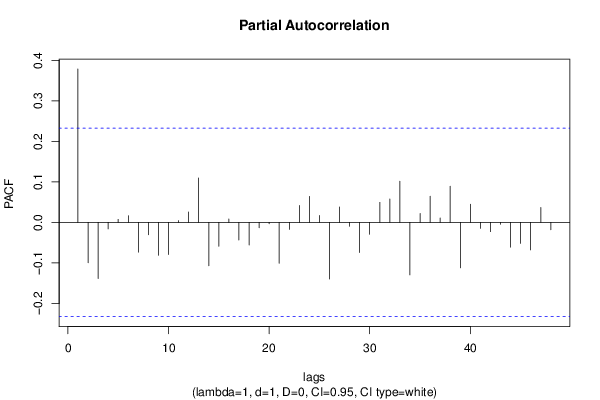
Partial Autocorrelation Function
Time lag kPACF(k)T-STATP-value
10.3785963.19010.001059
2-0.099466-0.83810.202388
3-0.138676-1.16850.123256
4-0.016137-0.1360.446114
50.0074520.06280.475054
60.016210.13660.445872
7-0.073376-0.61830.269185
8-0.030397-0.25610.399294
9-0.080914-0.68180.248795
10-0.079091-0.66640.253648
110.0043570.03670.485409
120.0256110.21580.41488
130.1096970.92430.179223
14-0.107108-0.90250.184919
15-0.058996-0.49710.310323
160.0085370.07190.471428
17-0.043406-0.36570.35782
18-0.055778-0.470.319899
19-0.013132-0.11070.456103
20-0.003589-0.03020.487979
21-0.100815-0.84950.199235
22-0.017229-0.14520.442491
230.0417550.35180.363002
240.0641020.54010.295397
250.0168780.14220.443657
26-0.139676-1.17690.121577
270.0381320.32130.374461
28-0.009619-0.08110.467815
29-0.074486-0.62760.266131
30-0.029253-0.24650.403006
310.0494510.41670.339085
320.0578410.48740.313747
330.1013730.85420.197938
34-0.12961-1.09210.139237
350.0218150.18380.427341
360.0644480.5430.294399
370.0108950.09180.463558
380.0892320.75190.227304
39-0.112192-0.94530.173845
400.0447490.37710.353625
41-0.014723-0.12410.45081
42-0.022817-0.19230.424045
43-0.004621-0.03890.484525
44-0.061062-0.51450.304245
45-0.051753-0.43610.332052
46-0.067882-0.5720.284569
470.0365410.30790.37953
48-0.018369-0.15480.438717

\begin{tabular}{lllllllll}
\hline
Partial Autocorrelation Function \tabularnewline
Time lag k & PACF(k) & T-STAT & P-value \tabularnewline
1 & 0.378596 & 3.1901 & 0.001059 \tabularnewline
2 & -0.099466 & -0.8381 & 0.202388 \tabularnewline
3 & -0.138676 & -1.1685 & 0.123256 \tabularnewline
4 & -0.016137 & -0.136 & 0.446114 \tabularnewline
5 & 0.007452 & 0.0628 & 0.475054 \tabularnewline
6 & 0.01621 & 0.1366 & 0.445872 \tabularnewline
7 & -0.073376 & -0.6183 & 0.269185 \tabularnewline
8 & -0.030397 & -0.2561 & 0.399294 \tabularnewline
9 & -0.080914 & -0.6818 & 0.248795 \tabularnewline
10 & -0.079091 & -0.6664 & 0.253648 \tabularnewline
11 & 0.004357 & 0.0367 & 0.485409 \tabularnewline
12 & 0.025611 & 0.2158 & 0.41488 \tabularnewline
13 & 0.109697 & 0.9243 & 0.179223 \tabularnewline
14 & -0.107108 & -0.9025 & 0.184919 \tabularnewline
15 & -0.058996 & -0.4971 & 0.310323 \tabularnewline
16 & 0.008537 & 0.0719 & 0.471428 \tabularnewline
17 & -0.043406 & -0.3657 & 0.35782 \tabularnewline
18 & -0.055778 & -0.47 & 0.319899 \tabularnewline
19 & -0.013132 & -0.1107 & 0.456103 \tabularnewline
20 & -0.003589 & -0.0302 & 0.487979 \tabularnewline
21 & -0.100815 & -0.8495 & 0.199235 \tabularnewline
22 & -0.017229 & -0.1452 & 0.442491 \tabularnewline
23 & 0.041755 & 0.3518 & 0.363002 \tabularnewline
24 & 0.064102 & 0.5401 & 0.295397 \tabularnewline
25 & 0.016878 & 0.1422 & 0.443657 \tabularnewline
26 & -0.139676 & -1.1769 & 0.121577 \tabularnewline
27 & 0.038132 & 0.3213 & 0.374461 \tabularnewline
28 & -0.009619 & -0.0811 & 0.467815 \tabularnewline
29 & -0.074486 & -0.6276 & 0.266131 \tabularnewline
30 & -0.029253 & -0.2465 & 0.403006 \tabularnewline
31 & 0.049451 & 0.4167 & 0.339085 \tabularnewline
32 & 0.057841 & 0.4874 & 0.313747 \tabularnewline
33 & 0.101373 & 0.8542 & 0.197938 \tabularnewline
34 & -0.12961 & -1.0921 & 0.139237 \tabularnewline
35 & 0.021815 & 0.1838 & 0.427341 \tabularnewline
36 & 0.064448 & 0.543 & 0.294399 \tabularnewline
37 & 0.010895 & 0.0918 & 0.463558 \tabularnewline
38 & 0.089232 & 0.7519 & 0.227304 \tabularnewline
39 & -0.112192 & -0.9453 & 0.173845 \tabularnewline
40 & 0.044749 & 0.3771 & 0.353625 \tabularnewline
41 & -0.014723 & -0.1241 & 0.45081 \tabularnewline
42 & -0.022817 & -0.1923 & 0.424045 \tabularnewline
43 & -0.004621 & -0.0389 & 0.484525 \tabularnewline
44 & -0.061062 & -0.5145 & 0.304245 \tabularnewline
45 & -0.051753 & -0.4361 & 0.332052 \tabularnewline
46 & -0.067882 & -0.572 & 0.284569 \tabularnewline
47 & 0.036541 & 0.3079 & 0.37953 \tabularnewline
48 & -0.018369 & -0.1548 & 0.438717 \tabularnewline
\hline
\end{tabular}
%Source: https://freestatistics.org/blog/index.php?pk=193435&T=2

[TABLE]
[ROW][C]Partial Autocorrelation Function[/C][/ROW]
[ROW][C]Time lag k[/C][C]PACF(k)[/C][C]T-STAT[/C][C]P-value[/C][/ROW]
[ROW][C]1[/C][C]0.378596[/C][C]3.1901[/C][C]0.001059[/C][/ROW]
[ROW][C]2[/C][C]-0.099466[/C][C]-0.8381[/C][C]0.202388[/C][/ROW]
[ROW][C]3[/C][C]-0.138676[/C][C]-1.1685[/C][C]0.123256[/C][/ROW]
[ROW][C]4[/C][C]-0.016137[/C][C]-0.136[/C][C]0.446114[/C][/ROW]
[ROW][C]5[/C][C]0.007452[/C][C]0.0628[/C][C]0.475054[/C][/ROW]
[ROW][C]6[/C][C]0.01621[/C][C]0.1366[/C][C]0.445872[/C][/ROW]
[ROW][C]7[/C][C]-0.073376[/C][C]-0.6183[/C][C]0.269185[/C][/ROW]
[ROW][C]8[/C][C]-0.030397[/C][C]-0.2561[/C][C]0.399294[/C][/ROW]
[ROW][C]9[/C][C]-0.080914[/C][C]-0.6818[/C][C]0.248795[/C][/ROW]
[ROW][C]10[/C][C]-0.079091[/C][C]-0.6664[/C][C]0.253648[/C][/ROW]
[ROW][C]11[/C][C]0.004357[/C][C]0.0367[/C][C]0.485409[/C][/ROW]
[ROW][C]12[/C][C]0.025611[/C][C]0.2158[/C][C]0.41488[/C][/ROW]
[ROW][C]13[/C][C]0.109697[/C][C]0.9243[/C][C]0.179223[/C][/ROW]
[ROW][C]14[/C][C]-0.107108[/C][C]-0.9025[/C][C]0.184919[/C][/ROW]
[ROW][C]15[/C][C]-0.058996[/C][C]-0.4971[/C][C]0.310323[/C][/ROW]
[ROW][C]16[/C][C]0.008537[/C][C]0.0719[/C][C]0.471428[/C][/ROW]
[ROW][C]17[/C][C]-0.043406[/C][C]-0.3657[/C][C]0.35782[/C][/ROW]
[ROW][C]18[/C][C]-0.055778[/C][C]-0.47[/C][C]0.319899[/C][/ROW]
[ROW][C]19[/C][C]-0.013132[/C][C]-0.1107[/C][C]0.456103[/C][/ROW]
[ROW][C]20[/C][C]-0.003589[/C][C]-0.0302[/C][C]0.487979[/C][/ROW]
[ROW][C]21[/C][C]-0.100815[/C][C]-0.8495[/C][C]0.199235[/C][/ROW]
[ROW][C]22[/C][C]-0.017229[/C][C]-0.1452[/C][C]0.442491[/C][/ROW]
[ROW][C]23[/C][C]0.041755[/C][C]0.3518[/C][C]0.363002[/C][/ROW]
[ROW][C]24[/C][C]0.064102[/C][C]0.5401[/C][C]0.295397[/C][/ROW]
[ROW][C]25[/C][C]0.016878[/C][C]0.1422[/C][C]0.443657[/C][/ROW]
[ROW][C]26[/C][C]-0.139676[/C][C]-1.1769[/C][C]0.121577[/C][/ROW]
[ROW][C]27[/C][C]0.038132[/C][C]0.3213[/C][C]0.374461[/C][/ROW]
[ROW][C]28[/C][C]-0.009619[/C][C]-0.0811[/C][C]0.467815[/C][/ROW]
[ROW][C]29[/C][C]-0.074486[/C][C]-0.6276[/C][C]0.266131[/C][/ROW]
[ROW][C]30[/C][C]-0.029253[/C][C]-0.2465[/C][C]0.403006[/C][/ROW]
[ROW][C]31[/C][C]0.049451[/C][C]0.4167[/C][C]0.339085[/C][/ROW]
[ROW][C]32[/C][C]0.057841[/C][C]0.4874[/C][C]0.313747[/C][/ROW]
[ROW][C]33[/C][C]0.101373[/C][C]0.8542[/C][C]0.197938[/C][/ROW]
[ROW][C]34[/C][C]-0.12961[/C][C]-1.0921[/C][C]0.139237[/C][/ROW]
[ROW][C]35[/C][C]0.021815[/C][C]0.1838[/C][C]0.427341[/C][/ROW]
[ROW][C]36[/C][C]0.064448[/C][C]0.543[/C][C]0.294399[/C][/ROW]
[ROW][C]37[/C][C]0.010895[/C][C]0.0918[/C][C]0.463558[/C][/ROW]
[ROW][C]38[/C][C]0.089232[/C][C]0.7519[/C][C]0.227304[/C][/ROW]
[ROW][C]39[/C][C]-0.112192[/C][C]-0.9453[/C][C]0.173845[/C][/ROW]
[ROW][C]40[/C][C]0.044749[/C][C]0.3771[/C][C]0.353625[/C][/ROW]
[ROW][C]41[/C][C]-0.014723[/C][C]-0.1241[/C][C]0.45081[/C][/ROW]
[ROW][C]42[/C][C]-0.022817[/C][C]-0.1923[/C][C]0.424045[/C][/ROW]
[ROW][C]43[/C][C]-0.004621[/C][C]-0.0389[/C][C]0.484525[/C][/ROW]
[ROW][C]44[/C][C]-0.061062[/C][C]-0.5145[/C][C]0.304245[/C][/ROW]
[ROW][C]45[/C][C]-0.051753[/C][C]-0.4361[/C][C]0.332052[/C][/ROW]
[ROW][C]46[/C][C]-0.067882[/C][C]-0.572[/C][C]0.284569[/C][/ROW]
[ROW][C]47[/C][C]0.036541[/C][C]0.3079[/C][C]0.37953[/C][/ROW]
[ROW][C]48[/C][C]-0.018369[/C][C]-0.1548[/C][C]0.438717[/C][/ROW]
[/TABLE]
Source: https://freestatistics.org/blog/index.php?pk=193435&T=2

Globally Unique Identifier (entire table): ba.freestatistics.org/blog/index.php?pk=193435&T=2

As an alternative you can also use a QR Code:  

The GUIDs for individual cells are displayed in the table below:

Partial Autocorrelation Function
Time lag kPACF(k)T-STATP-value
10.3785963.19010.001059
2-0.099466-0.83810.202388
3-0.138676-1.16850.123256
4-0.016137-0.1360.446114
50.0074520.06280.475054
60.016210.13660.445872
7-0.073376-0.61830.269185
8-0.030397-0.25610.399294
9-0.080914-0.68180.248795
10-0.079091-0.66640.253648
110.0043570.03670.485409
120.0256110.21580.41488
130.1096970.92430.179223
14-0.107108-0.90250.184919
15-0.058996-0.49710.310323
160.0085370.07190.471428
17-0.043406-0.36570.35782
18-0.055778-0.470.319899
19-0.013132-0.11070.456103
20-0.003589-0.03020.487979
21-0.100815-0.84950.199235
22-0.017229-0.14520.442491
230.0417550.35180.363002
240.0641020.54010.295397
250.0168780.14220.443657
26-0.139676-1.17690.121577
270.0381320.32130.374461
28-0.009619-0.08110.467815
29-0.074486-0.62760.266131
30-0.029253-0.24650.403006
310.0494510.41670.339085
320.0578410.48740.313747
330.1013730.85420.197938
34-0.12961-1.09210.139237
350.0218150.18380.427341
360.0644480.5430.294399
370.0108950.09180.463558
380.0892320.75190.227304
39-0.112192-0.94530.173845
400.0447490.37710.353625
41-0.014723-0.12410.45081
42-0.022817-0.19230.424045
43-0.004621-0.03890.484525
44-0.061062-0.51450.304245
45-0.051753-0.43610.332052
46-0.067882-0.5720.284569
470.0365410.30790.37953
48-0.018369-0.15480.438717


Parameters (Session):
par1 = 48 ; par2 = 1 ; par3 = 1 ; par4 = 0 ; par5 = 12 ; par6 = White Noise ; par7 = 0.95 ;
Parameters (R input):
par1 = 48 ; par2 = 1 ; par3 = 1 ; par4 = 0 ; par5 = 12 ; par6 = White Noise ; par7 = 0.95 ; par8 = ;
R code (references can be found in the software module):
par8 <- ''
par7 <- '0.95'
par6 <- 'White Noise'
par5 <- '12'
par4 <- '0'
par3 <- '1'
par2 <- '1'
par1 <- '48'
if (par1 == 'Default') {
par1 = 10*log10(length(x))
} else {
par1 <- as.numeric(par1)
}
par2 <- as.numeric(par2)
par3 <- as.numeric(par3)
par4 <- as.numeric(par4)
par5 <- as.numeric(par5)
if (par6 == 'White Noise') par6 <- 'white' else par6 <- 'ma'
par7 <- as.numeric(par7)
if (par8 != '') par8 <- as.numeric(par8)
ox <- x
if (par8 == '') {
if (par2 == 0) {
x <- log(x)
} else {
x <- (x ^ par2 - 1) / par2
}
} else {
x <- log(x,base=par8)
}
if (par3 > 0) x <- diff(x,lag=1,difference=par3)
if (par4 > 0) x <- diff(x,lag=par5,difference=par4)
bitmap(file='picts.png')
op <- par(mfrow=c(2,1))
plot(ox,type='l',main='Original Time Series',xlab='time',ylab='value')
if (par8=='') {
mytitle <- paste('Working Time Series (lambda=',par2,', d=',par3,', D=',par4,')',sep='')
mysub <- paste('(lambda=',par2,', d=',par3,', D=',par4,', CI=', par7, ', CI type=',par6,')',sep='')
} else {
mytitle <- paste('Working Time Series (base=',par8,', d=',par3,', D=',par4,')',sep='')
mysub <- paste('(base=',par8,', d=',par3,', D=',par4,', CI=', par7, ', CI type=',par6,')',sep='')
}
plot(x,type='l', main=mytitle,xlab='time',ylab='value')
par(op)
dev.off()
bitmap(file='pic1.png')
racf <- acf(x, par1, main='Autocorrelation', xlab='time lag', ylab='ACF', ci.type=par6, ci=par7, sub=mysub)
dev.off()
bitmap(file='pic2.png')
rpacf <- pacf(x,par1,main='Partial Autocorrelation',xlab='lags',ylab='PACF',sub=mysub)
dev.off()
(myacf <- c(racf$acf))
(mypacf <- c(rpacf$acf))
lengthx <- length(x)
sqrtn <- sqrt(lengthx)
load(file='createtable')
a<-table.start()
a<-table.row.start(a)
a<-table.element(a,'Autocorrelation Function',4,TRUE)
a<-table.row.end(a)
a<-table.row.start(a)
a<-table.element(a,'Time lag k',header=TRUE)
a<-table.element(a,hyperlink('basics.htm','ACF(k)','click here for more information about the Autocorrelation Function'),header=TRUE)
a<-table.element(a,'T-STAT',header=TRUE)
a<-table.element(a,'P-value',header=TRUE)
a<-table.row.end(a)
for (i in 2:(par1+1)) {
a<-table.row.start(a)
a<-table.element(a,i-1,header=TRUE)
a<-table.element(a,round(myacf[i],6))
mytstat <- myacf[i]*sqrtn
a<-table.element(a,round(mytstat,4))
a<-table.element(a,round(1-pt(abs(mytstat),lengthx),6))
a<-table.row.end(a)
}
a<-table.end(a)
table.save(a,file='mytable.tab')
a<-table.start()
a<-table.row.start(a)
a<-table.element(a,'Partial Autocorrelation Function',4,TRUE)
a<-table.row.end(a)
a<-table.row.start(a)
a<-table.element(a,'Time lag k',header=TRUE)
a<-table.element(a,hyperlink('basics.htm','PACF(k)','click here for more information about the Partial Autocorrelation Function'),header=TRUE)
a<-table.element(a,'T-STAT',header=TRUE)
a<-table.element(a,'P-value',header=TRUE)
a<-table.row.end(a)
for (i in 1:par1) {
a<-table.row.start(a)
a<-table.element(a,i,header=TRUE)
a<-table.element(a,round(mypacf[i],6))
mytstat <- mypacf[i]*sqrtn
a<-table.element(a,round(mytstat,4))
a<-table.element(a,round(1-pt(abs(mytstat),lengthx),6))
a<-table.row.end(a)
}
a<-table.end(a)
table.save(a,file='mytable1.tab')