Free Statistics

of Irreproducible Research!

Author's title

Author*Unverified author*
R Software Modulerwasp_autocorrelation.wasp
Title produced by software(Partial) Autocorrelation Function
Date of computationMon, 26 Nov 2012 13:10:10 -0500
Cite this page as followsStatistical Computations at FreeStatistics.org, Office for Research Development and Education, URL https://freestatistics.org/blog/index.php?v=date/2012/Nov/26/t1353953460jpwi43xjyjr9rl3.htm/, Retrieved Tue, 30 Apr 2024 05:12:42 +0000
Statistical Computations at FreeStatistics.org, Office for Research Development and Education, URL https://freestatistics.org/blog/index.php?pk=193432, Retrieved Tue, 30 Apr 2024 05:12:42 +0000
QR Codes:

Original text written by user:
IsPrivate?No (this computation is public)
User-defined keywords
Estimated Impact68
Family? (F = Feedback message, R = changed R code, M = changed R Module, P = changed Parameters, D = changed Data)
-       [(Partial) Autocorrelation Function] [sigaretten: autoc...] [2012-11-26 18:10:10] [4ab20b1300d6ce8ed8a6f2d2c22a072d] [Current]
Feedback Forum

Post a new message
Dataseries X:
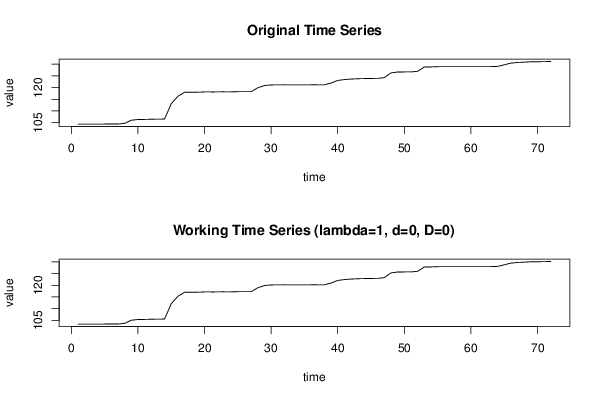
104,4
104,4
104,4
104,4
104,4
104,41
104,42
104,68
106,02
106,35
106,38
106,47
106,5
106,56
113,07
116,26
118
118,02
118,04
118,12
118,12
118,17
118,22
118,22
118,23
118,23
118,23
119,94
120,88
121,14
121,16
121,2
121,2
121,2
121,2
121,2
121,22
121,22
121,95
123,05
123,44
123,65
123,79
123,87
123,91
123,94
124,28
126,28
126,68
126,69
126,69
126,99
128,79
128,84
128,95
128,97
128,97
128,97
128,97
128,97
128,97
128,98
128,99
129,07
129,76
130,47
130,76
130,88
131,04
131,06
131,13
131,15


Summary of computational transaction
Raw Inputview raw input (R code)
Raw Outputview raw output of R engine
Computing time3 seconds
R Server'Sir Ronald Aylmer Fisher' @ fisher.wessa.net

\begin{tabular}{lllllllll}
\hline
Summary of computational transaction \tabularnewline
Raw Input & view raw input (R code)  \tabularnewline
Raw Output & view raw output of R engine  \tabularnewline
Computing time & 3 seconds \tabularnewline
R Server & 'Sir Ronald Aylmer Fisher' @ fisher.wessa.net \tabularnewline
\hline
\end{tabular}
%Source: https://freestatistics.org/blog/index.php?pk=193432&T=0

[TABLE]
[ROW][C]Summary of computational transaction[/C][/ROW]
[ROW][C]Raw Input[/C][C]view raw input (R code) [/C][/ROW]
[ROW][C]Raw Output[/C][C]view raw output of R engine [/C][/ROW]
[ROW][C]Computing time[/C][C]3 seconds[/C][/ROW]
[ROW][C]R Server[/C][C]'Sir Ronald Aylmer Fisher' @ fisher.wessa.net[/C][/ROW]
[/TABLE]
Source: https://freestatistics.org/blog/index.php?pk=193432&T=0

Globally Unique Identifier (entire table): ba.freestatistics.org/blog/index.php?pk=193432&T=0

As an alternative you can also use a QR Code:  

The GUIDs for individual cells are displayed in the table below:

Summary of computational transaction
Raw Inputview raw input (R code)
Raw Outputview raw output of R engine
Computing time3 seconds
R Server'Sir Ronald Aylmer Fisher' @ fisher.wessa.net


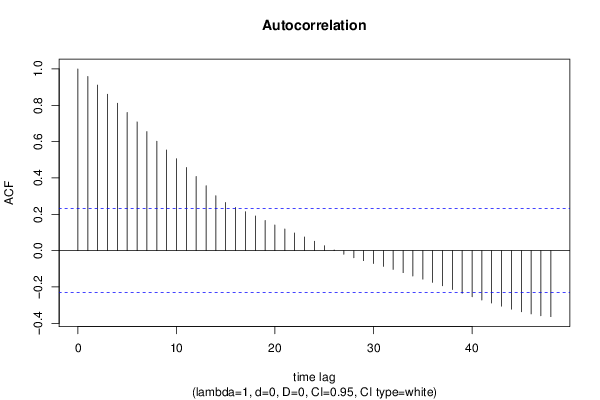
Autocorrelation Function
Time lag kACF(k)T-STATP-value
10.9587128.13490
20.9111977.73180
30.8612327.30780
40.8108756.88050
50.7602736.45110
60.7085456.01220
70.6552425.55990
80.6025045.11241e-06
90.5539094.70016e-06
100.5058754.29252.7e-05
110.4575793.88270.000113
120.4083913.46530.000448
130.357093.030.001698
140.3023752.56570.006189
150.2652522.25070.013728
160.2371192.0120.02398
170.2138641.81470.036868
180.1902361.61420.055429
190.1662351.41050.081342
200.1414151.19990.117047
210.1190131.00990.157972
220.0969830.82290.206632
230.0747220.6340.264032
240.0514410.43650.331894
250.0267820.22730.410435
260.0036270.03080.487767
27-0.01984-0.16830.433391
28-0.038751-0.32880.371625
29-0.055161-0.46810.320579
30-0.070901-0.60160.27466
31-0.086798-0.73650.231909
32-0.103417-0.87750.19156
33-0.121177-1.02820.153643
34-0.13954-1.1840.120147
35-0.157045-1.33260.093437
36-0.174776-1.4830.071217
37-0.193403-1.64110.052571
38-0.213885-1.81490.036854
39-0.234929-1.99340.025002
40-0.253504-2.15110.017414
41-0.271342-2.30240.012103
42-0.288618-2.4490.00838
43-0.305498-2.59220.00577
44-0.321851-2.7310.003968
45-0.336701-2.8570.002793
46-0.348189-2.95450.002115
47-0.358723-3.04390.00163
48-0.363356-3.08320.001451

\begin{tabular}{lllllllll}
\hline
Autocorrelation Function \tabularnewline
Time lag k & ACF(k) & T-STAT & P-value \tabularnewline
1 & 0.958712 & 8.1349 & 0 \tabularnewline
2 & 0.911197 & 7.7318 & 0 \tabularnewline
3 & 0.861232 & 7.3078 & 0 \tabularnewline
4 & 0.810875 & 6.8805 & 0 \tabularnewline
5 & 0.760273 & 6.4511 & 0 \tabularnewline
6 & 0.708545 & 6.0122 & 0 \tabularnewline
7 & 0.655242 & 5.5599 & 0 \tabularnewline
8 & 0.602504 & 5.1124 & 1e-06 \tabularnewline
9 & 0.553909 & 4.7001 & 6e-06 \tabularnewline
10 & 0.505875 & 4.2925 & 2.7e-05 \tabularnewline
11 & 0.457579 & 3.8827 & 0.000113 \tabularnewline
12 & 0.408391 & 3.4653 & 0.000448 \tabularnewline
13 & 0.35709 & 3.03 & 0.001698 \tabularnewline
14 & 0.302375 & 2.5657 & 0.006189 \tabularnewline
15 & 0.265252 & 2.2507 & 0.013728 \tabularnewline
16 & 0.237119 & 2.012 & 0.02398 \tabularnewline
17 & 0.213864 & 1.8147 & 0.036868 \tabularnewline
18 & 0.190236 & 1.6142 & 0.055429 \tabularnewline
19 & 0.166235 & 1.4105 & 0.081342 \tabularnewline
20 & 0.141415 & 1.1999 & 0.117047 \tabularnewline
21 & 0.119013 & 1.0099 & 0.157972 \tabularnewline
22 & 0.096983 & 0.8229 & 0.206632 \tabularnewline
23 & 0.074722 & 0.634 & 0.264032 \tabularnewline
24 & 0.051441 & 0.4365 & 0.331894 \tabularnewline
25 & 0.026782 & 0.2273 & 0.410435 \tabularnewline
26 & 0.003627 & 0.0308 & 0.487767 \tabularnewline
27 & -0.01984 & -0.1683 & 0.433391 \tabularnewline
28 & -0.038751 & -0.3288 & 0.371625 \tabularnewline
29 & -0.055161 & -0.4681 & 0.320579 \tabularnewline
30 & -0.070901 & -0.6016 & 0.27466 \tabularnewline
31 & -0.086798 & -0.7365 & 0.231909 \tabularnewline
32 & -0.103417 & -0.8775 & 0.19156 \tabularnewline
33 & -0.121177 & -1.0282 & 0.153643 \tabularnewline
34 & -0.13954 & -1.184 & 0.120147 \tabularnewline
35 & -0.157045 & -1.3326 & 0.093437 \tabularnewline
36 & -0.174776 & -1.483 & 0.071217 \tabularnewline
37 & -0.193403 & -1.6411 & 0.052571 \tabularnewline
38 & -0.213885 & -1.8149 & 0.036854 \tabularnewline
39 & -0.234929 & -1.9934 & 0.025002 \tabularnewline
40 & -0.253504 & -2.1511 & 0.017414 \tabularnewline
41 & -0.271342 & -2.3024 & 0.012103 \tabularnewline
42 & -0.288618 & -2.449 & 0.00838 \tabularnewline
43 & -0.305498 & -2.5922 & 0.00577 \tabularnewline
44 & -0.321851 & -2.731 & 0.003968 \tabularnewline
45 & -0.336701 & -2.857 & 0.002793 \tabularnewline
46 & -0.348189 & -2.9545 & 0.002115 \tabularnewline
47 & -0.358723 & -3.0439 & 0.00163 \tabularnewline
48 & -0.363356 & -3.0832 & 0.001451 \tabularnewline
\hline
\end{tabular}
%Source: https://freestatistics.org/blog/index.php?pk=193432&T=1

[TABLE]
[ROW][C]Autocorrelation Function[/C][/ROW]
[ROW][C]Time lag k[/C][C]ACF(k)[/C][C]T-STAT[/C][C]P-value[/C][/ROW]
[ROW][C]1[/C][C]0.958712[/C][C]8.1349[/C][C]0[/C][/ROW]
[ROW][C]2[/C][C]0.911197[/C][C]7.7318[/C][C]0[/C][/ROW]
[ROW][C]3[/C][C]0.861232[/C][C]7.3078[/C][C]0[/C][/ROW]
[ROW][C]4[/C][C]0.810875[/C][C]6.8805[/C][C]0[/C][/ROW]
[ROW][C]5[/C][C]0.760273[/C][C]6.4511[/C][C]0[/C][/ROW]
[ROW][C]6[/C][C]0.708545[/C][C]6.0122[/C][C]0[/C][/ROW]
[ROW][C]7[/C][C]0.655242[/C][C]5.5599[/C][C]0[/C][/ROW]
[ROW][C]8[/C][C]0.602504[/C][C]5.1124[/C][C]1e-06[/C][/ROW]
[ROW][C]9[/C][C]0.553909[/C][C]4.7001[/C][C]6e-06[/C][/ROW]
[ROW][C]10[/C][C]0.505875[/C][C]4.2925[/C][C]2.7e-05[/C][/ROW]
[ROW][C]11[/C][C]0.457579[/C][C]3.8827[/C][C]0.000113[/C][/ROW]
[ROW][C]12[/C][C]0.408391[/C][C]3.4653[/C][C]0.000448[/C][/ROW]
[ROW][C]13[/C][C]0.35709[/C][C]3.03[/C][C]0.001698[/C][/ROW]
[ROW][C]14[/C][C]0.302375[/C][C]2.5657[/C][C]0.006189[/C][/ROW]
[ROW][C]15[/C][C]0.265252[/C][C]2.2507[/C][C]0.013728[/C][/ROW]
[ROW][C]16[/C][C]0.237119[/C][C]2.012[/C][C]0.02398[/C][/ROW]
[ROW][C]17[/C][C]0.213864[/C][C]1.8147[/C][C]0.036868[/C][/ROW]
[ROW][C]18[/C][C]0.190236[/C][C]1.6142[/C][C]0.055429[/C][/ROW]
[ROW][C]19[/C][C]0.166235[/C][C]1.4105[/C][C]0.081342[/C][/ROW]
[ROW][C]20[/C][C]0.141415[/C][C]1.1999[/C][C]0.117047[/C][/ROW]
[ROW][C]21[/C][C]0.119013[/C][C]1.0099[/C][C]0.157972[/C][/ROW]
[ROW][C]22[/C][C]0.096983[/C][C]0.8229[/C][C]0.206632[/C][/ROW]
[ROW][C]23[/C][C]0.074722[/C][C]0.634[/C][C]0.264032[/C][/ROW]
[ROW][C]24[/C][C]0.051441[/C][C]0.4365[/C][C]0.331894[/C][/ROW]
[ROW][C]25[/C][C]0.026782[/C][C]0.2273[/C][C]0.410435[/C][/ROW]
[ROW][C]26[/C][C]0.003627[/C][C]0.0308[/C][C]0.487767[/C][/ROW]
[ROW][C]27[/C][C]-0.01984[/C][C]-0.1683[/C][C]0.433391[/C][/ROW]
[ROW][C]28[/C][C]-0.038751[/C][C]-0.3288[/C][C]0.371625[/C][/ROW]
[ROW][C]29[/C][C]-0.055161[/C][C]-0.4681[/C][C]0.320579[/C][/ROW]
[ROW][C]30[/C][C]-0.070901[/C][C]-0.6016[/C][C]0.27466[/C][/ROW]
[ROW][C]31[/C][C]-0.086798[/C][C]-0.7365[/C][C]0.231909[/C][/ROW]
[ROW][C]32[/C][C]-0.103417[/C][C]-0.8775[/C][C]0.19156[/C][/ROW]
[ROW][C]33[/C][C]-0.121177[/C][C]-1.0282[/C][C]0.153643[/C][/ROW]
[ROW][C]34[/C][C]-0.13954[/C][C]-1.184[/C][C]0.120147[/C][/ROW]
[ROW][C]35[/C][C]-0.157045[/C][C]-1.3326[/C][C]0.093437[/C][/ROW]
[ROW][C]36[/C][C]-0.174776[/C][C]-1.483[/C][C]0.071217[/C][/ROW]
[ROW][C]37[/C][C]-0.193403[/C][C]-1.6411[/C][C]0.052571[/C][/ROW]
[ROW][C]38[/C][C]-0.213885[/C][C]-1.8149[/C][C]0.036854[/C][/ROW]
[ROW][C]39[/C][C]-0.234929[/C][C]-1.9934[/C][C]0.025002[/C][/ROW]
[ROW][C]40[/C][C]-0.253504[/C][C]-2.1511[/C][C]0.017414[/C][/ROW]
[ROW][C]41[/C][C]-0.271342[/C][C]-2.3024[/C][C]0.012103[/C][/ROW]
[ROW][C]42[/C][C]-0.288618[/C][C]-2.449[/C][C]0.00838[/C][/ROW]
[ROW][C]43[/C][C]-0.305498[/C][C]-2.5922[/C][C]0.00577[/C][/ROW]
[ROW][C]44[/C][C]-0.321851[/C][C]-2.731[/C][C]0.003968[/C][/ROW]
[ROW][C]45[/C][C]-0.336701[/C][C]-2.857[/C][C]0.002793[/C][/ROW]
[ROW][C]46[/C][C]-0.348189[/C][C]-2.9545[/C][C]0.002115[/C][/ROW]
[ROW][C]47[/C][C]-0.358723[/C][C]-3.0439[/C][C]0.00163[/C][/ROW]
[ROW][C]48[/C][C]-0.363356[/C][C]-3.0832[/C][C]0.001451[/C][/ROW]
[/TABLE]
Source: https://freestatistics.org/blog/index.php?pk=193432&T=1

Globally Unique Identifier (entire table): ba.freestatistics.org/blog/index.php?pk=193432&T=1

As an alternative you can also use a QR Code:  

The GUIDs for individual cells are displayed in the table below:

Autocorrelation Function
Time lag kACF(k)T-STATP-value
10.9587128.13490
20.9111977.73180
30.8612327.30780
40.8108756.88050
50.7602736.45110
60.7085456.01220
70.6552425.55990
80.6025045.11241e-06
90.5539094.70016e-06
100.5058754.29252.7e-05
110.4575793.88270.000113
120.4083913.46530.000448
130.357093.030.001698
140.3023752.56570.006189
150.2652522.25070.013728
160.2371192.0120.02398
170.2138641.81470.036868
180.1902361.61420.055429
190.1662351.41050.081342
200.1414151.19990.117047
210.1190131.00990.157972
220.0969830.82290.206632
230.0747220.6340.264032
240.0514410.43650.331894
250.0267820.22730.410435
260.0036270.03080.487767
27-0.01984-0.16830.433391
28-0.038751-0.32880.371625
29-0.055161-0.46810.320579
30-0.070901-0.60160.27466
31-0.086798-0.73650.231909
32-0.103417-0.87750.19156
33-0.121177-1.02820.153643
34-0.13954-1.1840.120147
35-0.157045-1.33260.093437
36-0.174776-1.4830.071217
37-0.193403-1.64110.052571
38-0.213885-1.81490.036854
39-0.234929-1.99340.025002
40-0.253504-2.15110.017414
41-0.271342-2.30240.012103
42-0.288618-2.4490.00838
43-0.305498-2.59220.00577
44-0.321851-2.7310.003968
45-0.336701-2.8570.002793
46-0.348189-2.95450.002115
47-0.358723-3.04390.00163
48-0.363356-3.08320.001451


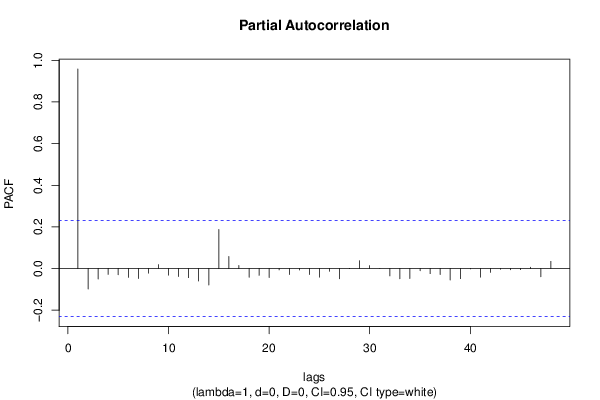
Partial Autocorrelation Function
Time lag kPACF(k)T-STATP-value
10.9587128.13490
2-0.098066-0.83210.204047
3-0.049872-0.42320.336713
4-0.027862-0.23640.406891
5-0.02979-0.25280.40058
6-0.042406-0.35980.360016
7-0.048083-0.4080.342244
8-0.021935-0.18610.426435
90.0190010.16120.436184
10-0.031624-0.26830.394603
11-0.038132-0.32360.373603
12-0.043719-0.3710.355877
13-0.059916-0.50840.306362
14-0.078782-0.66850.25298
150.187311.58940.058178
160.0582570.49430.311289
170.0148980.12640.44988
18-0.042148-0.35760.360829
19-0.032621-0.27680.391363
20-0.043344-0.36780.357056
21-0.006314-0.05360.478709
22-0.028901-0.24520.403488
23-0.007275-0.06170.475476
24-0.028721-0.24370.404076
25-0.041312-0.35050.363476
26-0.012623-0.10710.457501
27-0.04904-0.41610.33928
28-0.000833-0.00710.497191
290.0375750.31880.375387
300.0140660.11940.452664
31-0.000389-0.00330.498689
32-0.035373-0.30020.382463
33-0.048831-0.41430.339926
34-0.047824-0.40580.343048
35-0.010292-0.08730.465326
36-0.024402-0.20710.418275
37-0.028607-0.24270.404449
38-0.054626-0.46350.322196
39-0.048428-0.41090.341173
40-0.001539-0.01310.49481
41-0.04123-0.34980.363736
42-0.018217-0.15460.438793
43-0.003449-0.02930.488365
44-0.005569-0.04730.481222
45-0.005033-0.04270.483025
460.0062760.05330.478839
47-0.039502-0.33520.369229
480.0344440.29230.385461

\begin{tabular}{lllllllll}
\hline
Partial Autocorrelation Function \tabularnewline
Time lag k & PACF(k) & T-STAT & P-value \tabularnewline
1 & 0.958712 & 8.1349 & 0 \tabularnewline
2 & -0.098066 & -0.8321 & 0.204047 \tabularnewline
3 & -0.049872 & -0.4232 & 0.336713 \tabularnewline
4 & -0.027862 & -0.2364 & 0.406891 \tabularnewline
5 & -0.02979 & -0.2528 & 0.40058 \tabularnewline
6 & -0.042406 & -0.3598 & 0.360016 \tabularnewline
7 & -0.048083 & -0.408 & 0.342244 \tabularnewline
8 & -0.021935 & -0.1861 & 0.426435 \tabularnewline
9 & 0.019001 & 0.1612 & 0.436184 \tabularnewline
10 & -0.031624 & -0.2683 & 0.394603 \tabularnewline
11 & -0.038132 & -0.3236 & 0.373603 \tabularnewline
12 & -0.043719 & -0.371 & 0.355877 \tabularnewline
13 & -0.059916 & -0.5084 & 0.306362 \tabularnewline
14 & -0.078782 & -0.6685 & 0.25298 \tabularnewline
15 & 0.18731 & 1.5894 & 0.058178 \tabularnewline
16 & 0.058257 & 0.4943 & 0.311289 \tabularnewline
17 & 0.014898 & 0.1264 & 0.44988 \tabularnewline
18 & -0.042148 & -0.3576 & 0.360829 \tabularnewline
19 & -0.032621 & -0.2768 & 0.391363 \tabularnewline
20 & -0.043344 & -0.3678 & 0.357056 \tabularnewline
21 & -0.006314 & -0.0536 & 0.478709 \tabularnewline
22 & -0.028901 & -0.2452 & 0.403488 \tabularnewline
23 & -0.007275 & -0.0617 & 0.475476 \tabularnewline
24 & -0.028721 & -0.2437 & 0.404076 \tabularnewline
25 & -0.041312 & -0.3505 & 0.363476 \tabularnewline
26 & -0.012623 & -0.1071 & 0.457501 \tabularnewline
27 & -0.04904 & -0.4161 & 0.33928 \tabularnewline
28 & -0.000833 & -0.0071 & 0.497191 \tabularnewline
29 & 0.037575 & 0.3188 & 0.375387 \tabularnewline
30 & 0.014066 & 0.1194 & 0.452664 \tabularnewline
31 & -0.000389 & -0.0033 & 0.498689 \tabularnewline
32 & -0.035373 & -0.3002 & 0.382463 \tabularnewline
33 & -0.048831 & -0.4143 & 0.339926 \tabularnewline
34 & -0.047824 & -0.4058 & 0.343048 \tabularnewline
35 & -0.010292 & -0.0873 & 0.465326 \tabularnewline
36 & -0.024402 & -0.2071 & 0.418275 \tabularnewline
37 & -0.028607 & -0.2427 & 0.404449 \tabularnewline
38 & -0.054626 & -0.4635 & 0.322196 \tabularnewline
39 & -0.048428 & -0.4109 & 0.341173 \tabularnewline
40 & -0.001539 & -0.0131 & 0.49481 \tabularnewline
41 & -0.04123 & -0.3498 & 0.363736 \tabularnewline
42 & -0.018217 & -0.1546 & 0.438793 \tabularnewline
43 & -0.003449 & -0.0293 & 0.488365 \tabularnewline
44 & -0.005569 & -0.0473 & 0.481222 \tabularnewline
45 & -0.005033 & -0.0427 & 0.483025 \tabularnewline
46 & 0.006276 & 0.0533 & 0.478839 \tabularnewline
47 & -0.039502 & -0.3352 & 0.369229 \tabularnewline
48 & 0.034444 & 0.2923 & 0.385461 \tabularnewline
\hline
\end{tabular}
%Source: https://freestatistics.org/blog/index.php?pk=193432&T=2

[TABLE]
[ROW][C]Partial Autocorrelation Function[/C][/ROW]
[ROW][C]Time lag k[/C][C]PACF(k)[/C][C]T-STAT[/C][C]P-value[/C][/ROW]
[ROW][C]1[/C][C]0.958712[/C][C]8.1349[/C][C]0[/C][/ROW]
[ROW][C]2[/C][C]-0.098066[/C][C]-0.8321[/C][C]0.204047[/C][/ROW]
[ROW][C]3[/C][C]-0.049872[/C][C]-0.4232[/C][C]0.336713[/C][/ROW]
[ROW][C]4[/C][C]-0.027862[/C][C]-0.2364[/C][C]0.406891[/C][/ROW]
[ROW][C]5[/C][C]-0.02979[/C][C]-0.2528[/C][C]0.40058[/C][/ROW]
[ROW][C]6[/C][C]-0.042406[/C][C]-0.3598[/C][C]0.360016[/C][/ROW]
[ROW][C]7[/C][C]-0.048083[/C][C]-0.408[/C][C]0.342244[/C][/ROW]
[ROW][C]8[/C][C]-0.021935[/C][C]-0.1861[/C][C]0.426435[/C][/ROW]
[ROW][C]9[/C][C]0.019001[/C][C]0.1612[/C][C]0.436184[/C][/ROW]
[ROW][C]10[/C][C]-0.031624[/C][C]-0.2683[/C][C]0.394603[/C][/ROW]
[ROW][C]11[/C][C]-0.038132[/C][C]-0.3236[/C][C]0.373603[/C][/ROW]
[ROW][C]12[/C][C]-0.043719[/C][C]-0.371[/C][C]0.355877[/C][/ROW]
[ROW][C]13[/C][C]-0.059916[/C][C]-0.5084[/C][C]0.306362[/C][/ROW]
[ROW][C]14[/C][C]-0.078782[/C][C]-0.6685[/C][C]0.25298[/C][/ROW]
[ROW][C]15[/C][C]0.18731[/C][C]1.5894[/C][C]0.058178[/C][/ROW]
[ROW][C]16[/C][C]0.058257[/C][C]0.4943[/C][C]0.311289[/C][/ROW]
[ROW][C]17[/C][C]0.014898[/C][C]0.1264[/C][C]0.44988[/C][/ROW]
[ROW][C]18[/C][C]-0.042148[/C][C]-0.3576[/C][C]0.360829[/C][/ROW]
[ROW][C]19[/C][C]-0.032621[/C][C]-0.2768[/C][C]0.391363[/C][/ROW]
[ROW][C]20[/C][C]-0.043344[/C][C]-0.3678[/C][C]0.357056[/C][/ROW]
[ROW][C]21[/C][C]-0.006314[/C][C]-0.0536[/C][C]0.478709[/C][/ROW]
[ROW][C]22[/C][C]-0.028901[/C][C]-0.2452[/C][C]0.403488[/C][/ROW]
[ROW][C]23[/C][C]-0.007275[/C][C]-0.0617[/C][C]0.475476[/C][/ROW]
[ROW][C]24[/C][C]-0.028721[/C][C]-0.2437[/C][C]0.404076[/C][/ROW]
[ROW][C]25[/C][C]-0.041312[/C][C]-0.3505[/C][C]0.363476[/C][/ROW]
[ROW][C]26[/C][C]-0.012623[/C][C]-0.1071[/C][C]0.457501[/C][/ROW]
[ROW][C]27[/C][C]-0.04904[/C][C]-0.4161[/C][C]0.33928[/C][/ROW]
[ROW][C]28[/C][C]-0.000833[/C][C]-0.0071[/C][C]0.497191[/C][/ROW]
[ROW][C]29[/C][C]0.037575[/C][C]0.3188[/C][C]0.375387[/C][/ROW]
[ROW][C]30[/C][C]0.014066[/C][C]0.1194[/C][C]0.452664[/C][/ROW]
[ROW][C]31[/C][C]-0.000389[/C][C]-0.0033[/C][C]0.498689[/C][/ROW]
[ROW][C]32[/C][C]-0.035373[/C][C]-0.3002[/C][C]0.382463[/C][/ROW]
[ROW][C]33[/C][C]-0.048831[/C][C]-0.4143[/C][C]0.339926[/C][/ROW]
[ROW][C]34[/C][C]-0.047824[/C][C]-0.4058[/C][C]0.343048[/C][/ROW]
[ROW][C]35[/C][C]-0.010292[/C][C]-0.0873[/C][C]0.465326[/C][/ROW]
[ROW][C]36[/C][C]-0.024402[/C][C]-0.2071[/C][C]0.418275[/C][/ROW]
[ROW][C]37[/C][C]-0.028607[/C][C]-0.2427[/C][C]0.404449[/C][/ROW]
[ROW][C]38[/C][C]-0.054626[/C][C]-0.4635[/C][C]0.322196[/C][/ROW]
[ROW][C]39[/C][C]-0.048428[/C][C]-0.4109[/C][C]0.341173[/C][/ROW]
[ROW][C]40[/C][C]-0.001539[/C][C]-0.0131[/C][C]0.49481[/C][/ROW]
[ROW][C]41[/C][C]-0.04123[/C][C]-0.3498[/C][C]0.363736[/C][/ROW]
[ROW][C]42[/C][C]-0.018217[/C][C]-0.1546[/C][C]0.438793[/C][/ROW]
[ROW][C]43[/C][C]-0.003449[/C][C]-0.0293[/C][C]0.488365[/C][/ROW]
[ROW][C]44[/C][C]-0.005569[/C][C]-0.0473[/C][C]0.481222[/C][/ROW]
[ROW][C]45[/C][C]-0.005033[/C][C]-0.0427[/C][C]0.483025[/C][/ROW]
[ROW][C]46[/C][C]0.006276[/C][C]0.0533[/C][C]0.478839[/C][/ROW]
[ROW][C]47[/C][C]-0.039502[/C][C]-0.3352[/C][C]0.369229[/C][/ROW]
[ROW][C]48[/C][C]0.034444[/C][C]0.2923[/C][C]0.385461[/C][/ROW]
[/TABLE]
Source: https://freestatistics.org/blog/index.php?pk=193432&T=2

Globally Unique Identifier (entire table): ba.freestatistics.org/blog/index.php?pk=193432&T=2

As an alternative you can also use a QR Code:  

The GUIDs for individual cells are displayed in the table below:

Partial Autocorrelation Function
Time lag kPACF(k)T-STATP-value
10.9587128.13490
2-0.098066-0.83210.204047
3-0.049872-0.42320.336713
4-0.027862-0.23640.406891
5-0.02979-0.25280.40058
6-0.042406-0.35980.360016
7-0.048083-0.4080.342244
8-0.021935-0.18610.426435
90.0190010.16120.436184
10-0.031624-0.26830.394603
11-0.038132-0.32360.373603
12-0.043719-0.3710.355877
13-0.059916-0.50840.306362
14-0.078782-0.66850.25298
150.187311.58940.058178
160.0582570.49430.311289
170.0148980.12640.44988
18-0.042148-0.35760.360829
19-0.032621-0.27680.391363
20-0.043344-0.36780.357056
21-0.006314-0.05360.478709
22-0.028901-0.24520.403488
23-0.007275-0.06170.475476
24-0.028721-0.24370.404076
25-0.041312-0.35050.363476
26-0.012623-0.10710.457501
27-0.04904-0.41610.33928
28-0.000833-0.00710.497191
290.0375750.31880.375387
300.0140660.11940.452664
31-0.000389-0.00330.498689
32-0.035373-0.30020.382463
33-0.048831-0.41430.339926
34-0.047824-0.40580.343048
35-0.010292-0.08730.465326
36-0.024402-0.20710.418275
37-0.028607-0.24270.404449
38-0.054626-0.46350.322196
39-0.048428-0.41090.341173
40-0.001539-0.01310.49481
41-0.04123-0.34980.363736
42-0.018217-0.15460.438793
43-0.003449-0.02930.488365
44-0.005569-0.04730.481222
45-0.005033-0.04270.483025
460.0062760.05330.478839
47-0.039502-0.33520.369229
480.0344440.29230.385461


Parameters (Session):
par1 = 48 ; par2 = 1 ; par3 = 0 ; par4 = 0 ; par5 = 12 ; par6 = White Noise ; par7 = 0.95 ;
Parameters (R input):
par1 = 48 ; par2 = 1 ; par3 = 0 ; par4 = 0 ; par5 = 12 ; par6 = White Noise ; par7 = 0.95 ; par8 = ;
R code (references can be found in the software module):
if (par1 == 'Default') {
par1 = 10*log10(length(x))
} else {
par1 <- as.numeric(par1)
}
par2 <- as.numeric(par2)
par3 <- as.numeric(par3)
par4 <- as.numeric(par4)
par5 <- as.numeric(par5)
if (par6 == 'White Noise') par6 <- 'white' else par6 <- 'ma'
par7 <- as.numeric(par7)
if (par8 != '') par8 <- as.numeric(par8)
ox <- x
if (par8 == '') {
if (par2 == 0) {
x <- log(x)
} else {
x <- (x ^ par2 - 1) / par2
}
} else {
x <- log(x,base=par8)
}
if (par3 > 0) x <- diff(x,lag=1,difference=par3)
if (par4 > 0) x <- diff(x,lag=par5,difference=par4)
bitmap(file='picts.png')
op <- par(mfrow=c(2,1))
plot(ox,type='l',main='Original Time Series',xlab='time',ylab='value')
if (par8=='') {
mytitle <- paste('Working Time Series (lambda=',par2,', d=',par3,', D=',par4,')',sep='')
mysub <- paste('(lambda=',par2,', d=',par3,', D=',par4,', CI=', par7, ', CI type=',par6,')',sep='')
} else {
mytitle <- paste('Working Time Series (base=',par8,', d=',par3,', D=',par4,')',sep='')
mysub <- paste('(base=',par8,', d=',par3,', D=',par4,', CI=', par7, ', CI type=',par6,')',sep='')
}
plot(x,type='l', main=mytitle,xlab='time',ylab='value')
par(op)
dev.off()
bitmap(file='pic1.png')
racf <- acf(x, par1, main='Autocorrelation', xlab='time lag', ylab='ACF', ci.type=par6, ci=par7, sub=mysub)
dev.off()
bitmap(file='pic2.png')
rpacf <- pacf(x,par1,main='Partial Autocorrelation',xlab='lags',ylab='PACF',sub=mysub)
dev.off()
(myacf <- c(racf$acf))
(mypacf <- c(rpacf$acf))
lengthx <- length(x)
sqrtn <- sqrt(lengthx)
load(file='createtable')
a<-table.start()
a<-table.row.start(a)
a<-table.element(a,'Autocorrelation Function',4,TRUE)
a<-table.row.end(a)
a<-table.row.start(a)
a<-table.element(a,'Time lag k',header=TRUE)
a<-table.element(a,hyperlink('basics.htm','ACF(k)','click here for more information about the Autocorrelation Function'),header=TRUE)
a<-table.element(a,'T-STAT',header=TRUE)
a<-table.element(a,'P-value',header=TRUE)
a<-table.row.end(a)
for (i in 2:(par1+1)) {
a<-table.row.start(a)
a<-table.element(a,i-1,header=TRUE)
a<-table.element(a,round(myacf[i],6))
mytstat <- myacf[i]*sqrtn
a<-table.element(a,round(mytstat,4))
a<-table.element(a,round(1-pt(abs(mytstat),lengthx),6))
a<-table.row.end(a)
}
a<-table.end(a)
table.save(a,file='mytable.tab')
a<-table.start()
a<-table.row.start(a)
a<-table.element(a,'Partial Autocorrelation Function',4,TRUE)
a<-table.row.end(a)
a<-table.row.start(a)
a<-table.element(a,'Time lag k',header=TRUE)
a<-table.element(a,hyperlink('basics.htm','PACF(k)','click here for more information about the Partial Autocorrelation Function'),header=TRUE)
a<-table.element(a,'T-STAT',header=TRUE)
a<-table.element(a,'P-value',header=TRUE)
a<-table.row.end(a)
for (i in 1:par1) {
a<-table.row.start(a)
a<-table.element(a,i,header=TRUE)
a<-table.element(a,round(mypacf[i],6))
mytstat <- mypacf[i]*sqrtn
a<-table.element(a,round(mytstat,4))
a<-table.element(a,round(1-pt(abs(mytstat),lengthx),6))
a<-table.row.end(a)
}
a<-table.end(a)
table.save(a,file='mytable1.tab')