Free Statistics

of Irreproducible Research!

Author's title

Author*The author of this computation has been verified*
R Software Modulerwasp_smp.wasp
Title produced by softwareStandard Deviation-Mean Plot
Date of computationMon, 26 Nov 2012 12:27:16 -0500
Cite this page as followsStatistical Computations at FreeStatistics.org, Office for Research Development and Education, URL https://freestatistics.org/blog/index.php?v=date/2012/Nov/26/t1353950861v6aipi9uwxovz4y.htm/, Retrieved Tue, 30 Apr 2024 07:05:23 +0000
Statistical Computations at FreeStatistics.org, Office for Research Development and Education, URL https://freestatistics.org/blog/index.php?pk=193377, Retrieved Tue, 30 Apr 2024 07:05:23 +0000
QR Codes:

Original text written by user:
IsPrivate?No (this computation is public)
User-defined keywords
Estimated Impact84
Family? (F = Feedback message, R = changed R code, M = changed R Module, P = changed Parameters, D = changed Data)
-     [Univariate Explorative Data Analysis] [Run Sequence gebo...] [2008-12-12 13:32:37] [76963dc1903f0f612b6153510a3818cf]
- R  D  [Univariate Explorative Data Analysis] [Run Sequence gebo...] [2008-12-17 12:14:40] [76963dc1903f0f612b6153510a3818cf]
-         [Univariate Explorative Data Analysis] [Run Sequence Plot...] [2008-12-22 18:19:51] [1ce0d16c8f4225c977b42c8fa93bc163]
- RMP       [Univariate Data Series] [Identifying Integ...] [2009-11-22 12:08:06] [b98453cac15ba1066b407e146608df68]
- RMP         [Spectral Analysis] [Births] [2010-11-29 09:38:20] [b98453cac15ba1066b407e146608df68]
- RMPD            [Standard Deviation-Mean Plot] [WS 9 SDMP] [2012-11-26 17:27:16] [5bcb27a14a37b739141501b3993fea08] [Current]
Feedback Forum

Post a new message
Dataseries X:
9676
8642
9402
9610
9294
9448
10319
9548
9801
9596
8923
9746
9829
9125
9782
9441
9162
9915
10444
10209
9985
9842
9429
10132
9849
9172
10313
9819
9955
10048
10082
10541
10208
10233
9439
9963
10158
9225
10474
9757
10490
10281
10444
10640
10695
10786
9832
9747
10411
9511
10402
9701
10540
10112
10915
11183
10384
10834
9886
10216
10943
9867
10203
10837
10573
10647
11502
10656
10866
10835
9945
10331
10718
9462
10579
10633
10346
10757
11207
11013
11015
10765
10042
10661


Summary of computational transaction
Raw Inputview raw input (R code)
Raw Outputview raw output of R engine
Computing time2 seconds
R Server'George Udny Yule' @ yule.wessa.net

\begin{tabular}{lllllllll}
\hline
Summary of computational transaction \tabularnewline
Raw Input & view raw input (R code)  \tabularnewline
Raw Output & view raw output of R engine  \tabularnewline
Computing time & 2 seconds \tabularnewline
R Server & 'George Udny Yule' @ yule.wessa.net \tabularnewline
\hline
\end{tabular}
%Source: https://freestatistics.org/blog/index.php?pk=193377&T=0

[TABLE]
[ROW][C]Summary of computational transaction[/C][/ROW]
[ROW][C]Raw Input[/C][C]view raw input (R code) [/C][/ROW]
[ROW][C]Raw Output[/C][C]view raw output of R engine [/C][/ROW]
[ROW][C]Computing time[/C][C]2 seconds[/C][/ROW]
[ROW][C]R Server[/C][C]'George Udny Yule' @ yule.wessa.net[/C][/ROW]
[/TABLE]
Source: https://freestatistics.org/blog/index.php?pk=193377&T=0

Globally Unique Identifier (entire table): ba.freestatistics.org/blog/index.php?pk=193377&T=0

As an alternative you can also use a QR Code:  

The GUIDs for individual cells are displayed in the table below:

Summary of computational transaction
Raw Inputview raw input (R code)
Raw Outputview raw output of R engine
Computing time2 seconds
R Server'George Udny Yule' @ yule.wessa.net


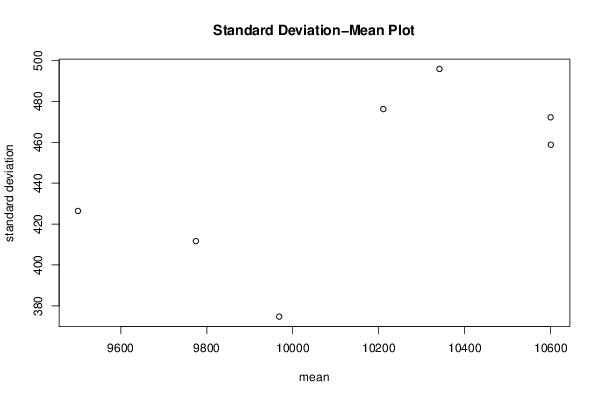
Standard Deviation-Mean Plot
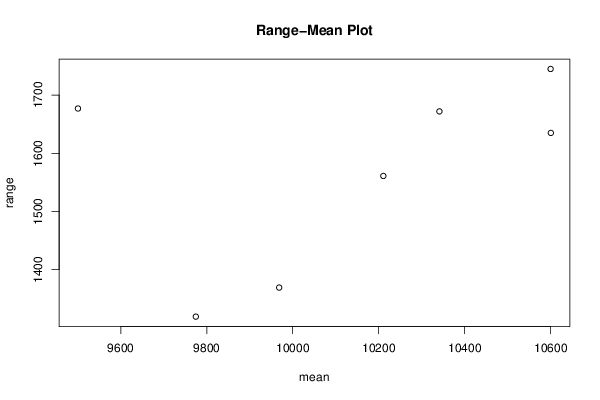
SectionMeanStandard DeviationRange
19500.41666666667426.434362067031677
29774.58333333333411.6550759011131319
39968.5374.7223214352441369
410210.75476.2713369116771561
510341.25495.9059890745421672
610600.4166666667458.8284405731491635
710599.8333333333472.249516739411745

\begin{tabular}{lllllllll}
\hline
Standard Deviation-Mean Plot \tabularnewline
Section & Mean & Standard Deviation & Range \tabularnewline
1 & 9500.41666666667 & 426.43436206703 & 1677 \tabularnewline
2 & 9774.58333333333 & 411.655075901113 & 1319 \tabularnewline
3 & 9968.5 & 374.722321435244 & 1369 \tabularnewline
4 & 10210.75 & 476.271336911677 & 1561 \tabularnewline
5 & 10341.25 & 495.905989074542 & 1672 \tabularnewline
6 & 10600.4166666667 & 458.828440573149 & 1635 \tabularnewline
7 & 10599.8333333333 & 472.24951673941 & 1745 \tabularnewline
\hline
\end{tabular}
%Source: https://freestatistics.org/blog/index.php?pk=193377&T=1

[TABLE]
[ROW][C]Standard Deviation-Mean Plot[/C][/ROW]
[ROW][C]Section[/C][C]Mean[/C][C]Standard Deviation[/C][C]Range[/C][/ROW]
[ROW][C]1[/C][C]9500.41666666667[/C][C]426.43436206703[/C][C]1677[/C][/ROW]
[ROW][C]2[/C][C]9774.58333333333[/C][C]411.655075901113[/C][C]1319[/C][/ROW]
[ROW][C]3[/C][C]9968.5[/C][C]374.722321435244[/C][C]1369[/C][/ROW]
[ROW][C]4[/C][C]10210.75[/C][C]476.271336911677[/C][C]1561[/C][/ROW]
[ROW][C]5[/C][C]10341.25[/C][C]495.905989074542[/C][C]1672[/C][/ROW]
[ROW][C]6[/C][C]10600.4166666667[/C][C]458.828440573149[/C][C]1635[/C][/ROW]
[ROW][C]7[/C][C]10599.8333333333[/C][C]472.24951673941[/C][C]1745[/C][/ROW]
[/TABLE]
Source: https://freestatistics.org/blog/index.php?pk=193377&T=1

Globally Unique Identifier (entire table): ba.freestatistics.org/blog/index.php?pk=193377&T=1

As an alternative you can also use a QR Code:  

The GUIDs for individual cells are displayed in the table below:

Standard Deviation-Mean Plot
SectionMeanStandard DeviationRange
19500.41666666667426.434362067031677
29774.58333333333411.6550759011131319
39968.5374.7223214352441369
410210.75476.2713369116771561
510341.25495.9059890745421672
610600.4166666667458.8284405731491635
710599.8333333333472.249516739411745


Regression: S.E.(k) = alpha + beta * Mean(k)
alpha-212.188660820224
beta0.0648121566212588
S.D.0.0354104045050433
T-STAT1.83031392968211
p-value0.126716482760976

\begin{tabular}{lllllllll}
\hline
Regression: S.E.(k) = alpha + beta * Mean(k) \tabularnewline
alpha & -212.188660820224 \tabularnewline
beta & 0.0648121566212588 \tabularnewline
S.D. & 0.0354104045050433 \tabularnewline
T-STAT & 1.83031392968211 \tabularnewline
p-value & 0.126716482760976 \tabularnewline
\hline
\end{tabular}
%Source: https://freestatistics.org/blog/index.php?pk=193377&T=2

[TABLE]
[ROW][C]Regression: S.E.(k) = alpha + beta * Mean(k)[/C][/ROW]
[ROW][C]alpha[/C][C]-212.188660820224[/C][/ROW]
[ROW][C]beta[/C][C]0.0648121566212588[/C][/ROW]
[ROW][C]S.D.[/C][C]0.0354104045050433[/C][/ROW]
[ROW][C]T-STAT[/C][C]1.83031392968211[/C][/ROW]
[ROW][C]p-value[/C][C]0.126716482760976[/C][/ROW]
[/TABLE]
Source: https://freestatistics.org/blog/index.php?pk=193377&T=2

Globally Unique Identifier (entire table): ba.freestatistics.org/blog/index.php?pk=193377&T=2

As an alternative you can also use a QR Code:  

The GUIDs for individual cells are displayed in the table below:

Regression: S.E.(k) = alpha + beta * Mean(k)
alpha-212.188660820224
beta0.0648121566212588
S.D.0.0354104045050433
T-STAT1.83031392968211
p-value0.126716482760976


Regression: ln S.E.(k) = alpha + beta * ln Mean(k)
alpha-7.532582349243
beta1.47737570720841
S.D.0.83515890973627
T-STAT1.76897556858364
p-value0.137128453565914
Lambda-0.477375707208408

\begin{tabular}{lllllllll}
\hline
Regression: ln S.E.(k) = alpha + beta * ln Mean(k) \tabularnewline
alpha & -7.532582349243 \tabularnewline
beta & 1.47737570720841 \tabularnewline
S.D. & 0.83515890973627 \tabularnewline
T-STAT & 1.76897556858364 \tabularnewline
p-value & 0.137128453565914 \tabularnewline
Lambda & -0.477375707208408 \tabularnewline
\hline
\end{tabular}
%Source: https://freestatistics.org/blog/index.php?pk=193377&T=3

[TABLE]
[ROW][C]Regression: ln S.E.(k) = alpha + beta * ln Mean(k)[/C][/ROW]
[ROW][C]alpha[/C][C]-7.532582349243[/C][/ROW]
[ROW][C]beta[/C][C]1.47737570720841[/C][/ROW]
[ROW][C]S.D.[/C][C]0.83515890973627[/C][/ROW]
[ROW][C]T-STAT[/C][C]1.76897556858364[/C][/ROW]
[ROW][C]p-value[/C][C]0.137128453565914[/C][/ROW]
[ROW][C]Lambda[/C][C]-0.477375707208408[/C][/ROW]
[/TABLE]
Source: https://freestatistics.org/blog/index.php?pk=193377&T=3

Globally Unique Identifier (entire table): ba.freestatistics.org/blog/index.php?pk=193377&T=3

As an alternative you can also use a QR Code:  

The GUIDs for individual cells are displayed in the table below:

Regression: ln S.E.(k) = alpha + beta * ln Mean(k)
alpha-7.532582349243
beta1.47737570720841
S.D.0.83515890973627
T-STAT1.76897556858364
p-value0.137128453565914
Lambda-0.477375707208408


Parameters (Session):
par1 = 12 ;
Parameters (R input):
par1 = 12 ;
R code (references can be found in the software module):
par1 <- as.numeric(par1)
(n <- length(x))
(np <- floor(n / par1))
arr <- array(NA,dim=c(par1,np))
j <- 0
k <- 1
for (i in 1:(np*par1))
{
j = j + 1
arr[j,k] <- x[i]
if (j == par1) {
j = 0
k=k+1
}
}
arr
arr.mean <- array(NA,dim=np)
arr.sd <- array(NA,dim=np)
arr.range <- array(NA,dim=np)
for (j in 1:np)
{
arr.mean[j] <- mean(arr[,j],na.rm=TRUE)
arr.sd[j] <- sd(arr[,j],na.rm=TRUE)
arr.range[j] <- max(arr[,j],na.rm=TRUE) - min(arr[,j],na.rm=TRUE)
}
arr.mean
arr.sd
arr.range
(lm1 <- lm(arr.sd~arr.mean))
(lnlm1 <- lm(log(arr.sd)~log(arr.mean)))
(lm2 <- lm(arr.range~arr.mean))
bitmap(file='test1.png')
plot(arr.mean,arr.sd,main='Standard Deviation-Mean Plot',xlab='mean',ylab='standard deviation')
dev.off()
bitmap(file='test2.png')
plot(arr.mean,arr.range,main='Range-Mean Plot',xlab='mean',ylab='range')
dev.off()
load(file='createtable')
a<-table.start()
a<-table.row.start(a)
a<-table.element(a,'Standard Deviation-Mean Plot',4,TRUE)
a<-table.row.end(a)
a<-table.row.start(a)
a<-table.element(a,'Section',header=TRUE)
a<-table.element(a,'Mean',header=TRUE)
a<-table.element(a,'Standard Deviation',header=TRUE)
a<-table.element(a,'Range',header=TRUE)
a<-table.row.end(a)
for (j in 1:np) {
a<-table.row.start(a)
a<-table.element(a,j,header=TRUE)
a<-table.element(a,arr.mean[j])
a<-table.element(a,arr.sd[j] )
a<-table.element(a,arr.range[j] )
a<-table.row.end(a)
}
a<-table.end(a)
table.save(a,file='mytable.tab')
a<-table.start()
a<-table.row.start(a)
a<-table.element(a,'Regression: S.E.(k) = alpha + beta * Mean(k)',2,TRUE)
a<-table.row.end(a)
a<-table.row.start(a)
a<-table.element(a,'alpha',header=TRUE)
a<-table.element(a,lm1$coefficients[[1]])
a<-table.row.end(a)
a<-table.row.start(a)
a<-table.element(a,'beta',header=TRUE)
a<-table.element(a,lm1$coefficients[[2]])
a<-table.row.end(a)
a<-table.row.start(a)
a<-table.element(a,'S.D.',header=TRUE)
a<-table.element(a,summary(lm1)$coefficients[2,2])
a<-table.row.end(a)
a<-table.row.start(a)
a<-table.element(a,'T-STAT',header=TRUE)
a<-table.element(a,summary(lm1)$coefficients[2,3])
a<-table.row.end(a)
a<-table.row.start(a)
a<-table.element(a,'p-value',header=TRUE)
a<-table.element(a,summary(lm1)$coefficients[2,4])
a<-table.row.end(a)
a<-table.end(a)
table.save(a,file='mytable1.tab')
a<-table.start()
a<-table.row.start(a)
a<-table.element(a,'Regression: ln S.E.(k) = alpha + beta * ln Mean(k)',2,TRUE)
a<-table.row.end(a)
a<-table.row.start(a)
a<-table.element(a,'alpha',header=TRUE)
a<-table.element(a,lnlm1$coefficients[[1]])
a<-table.row.end(a)
a<-table.row.start(a)
a<-table.element(a,'beta',header=TRUE)
a<-table.element(a,lnlm1$coefficients[[2]])
a<-table.row.end(a)
a<-table.row.start(a)
a<-table.element(a,'S.D.',header=TRUE)
a<-table.element(a,summary(lnlm1)$coefficients[2,2])
a<-table.row.end(a)
a<-table.row.start(a)
a<-table.element(a,'T-STAT',header=TRUE)
a<-table.element(a,summary(lnlm1)$coefficients[2,3])
a<-table.row.end(a)
a<-table.row.start(a)
a<-table.element(a,'p-value',header=TRUE)
a<-table.element(a,summary(lnlm1)$coefficients[2,4])
a<-table.row.end(a)
a<-table.row.start(a)
a<-table.element(a,'Lambda',header=TRUE)
a<-table.element(a,1-lnlm1$coefficients[[2]])
a<-table.row.end(a)
a<-table.end(a)
table.save(a,file='mytable2.tab')