Free Statistics

of Irreproducible Research!

Author's title

Author*The author of this computation has been verified*
R Software Modulerwasp_autocorrelation.wasp
Title produced by software(Partial) Autocorrelation Function
Date of computationMon, 26 Nov 2012 06:45:34 -0500
Cite this page as followsStatistical Computations at FreeStatistics.org, Office for Research Development and Education, URL https://freestatistics.org/blog/index.php?v=date/2012/Nov/26/t135393036958i7msrst4eslik.htm/, Retrieved Tue, 30 Apr 2024 01:06:43 +0000
Statistical Computations at FreeStatistics.org, Office for Research Development and Education, URL https://freestatistics.org/blog/index.php?pk=193050, Retrieved Tue, 30 Apr 2024 01:06:43 +0000
QR Codes:

Original text written by user:
IsPrivate?No (this computation is public)
User-defined keywords
Estimated Impact76
Family? (F = Feedback message, R = changed R code, M = changed R Module, P = changed Parameters, D = changed Data)
-       [(Partial) Autocorrelation Function] [WS 9 ACF] [2012-11-26 11:45:34] [5bcb27a14a37b739141501b3993fea08] [Current]
Feedback Forum

Post a new message
Dataseries X:
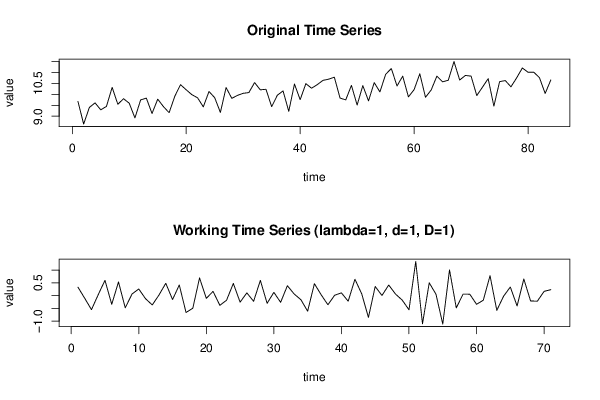
9.676
8.642
9.402
9.610
9.294
9.448
10.319
9.548
9.801
9.596
8.923
9.746
9.829
9.125
9.782
9.441
9.162
9.915
10.444
10.209
9.985
9.842
9.429
10.132
9.849
9.172
10.313
9.819
9.955
10.048
10.082
10.541
10.208
10.233
9.439
9.963
10.158
9.225
10.474
9.757
10.490
10.281
10.444
10.640
10.695
10.786
9.832
9.747
10.411
9.511
10.402
9.701
10.540
10.112
10.915
11.183
10.384
10.834
9.886
10.216
10.943
9.867
10.203
10.837
10.573
10.647
11.502
10.656
10.866
10.835
9.945
10.331
10.718
9.462
10.579
10.633
10.346
10.757
11.207
11.013
11.015
10.765
10.042
10.661


Summary of computational transaction
Raw Inputview raw input (R code)
Raw Outputview raw output of R engine
Computing time2 seconds
R Server'Gwilym Jenkins' @ jenkins.wessa.net

\begin{tabular}{lllllllll}
\hline
Summary of computational transaction \tabularnewline
Raw Input & view raw input (R code)  \tabularnewline
Raw Output & view raw output of R engine  \tabularnewline
Computing time & 2 seconds \tabularnewline
R Server & 'Gwilym Jenkins' @ jenkins.wessa.net \tabularnewline
\hline
\end{tabular}
%Source: https://freestatistics.org/blog/index.php?pk=193050&T=0

[TABLE]
[ROW][C]Summary of computational transaction[/C][/ROW]
[ROW][C]Raw Input[/C][C]view raw input (R code) [/C][/ROW]
[ROW][C]Raw Output[/C][C]view raw output of R engine [/C][/ROW]
[ROW][C]Computing time[/C][C]2 seconds[/C][/ROW]
[ROW][C]R Server[/C][C]'Gwilym Jenkins' @ jenkins.wessa.net[/C][/ROW]
[/TABLE]
Source: https://freestatistics.org/blog/index.php?pk=193050&T=0

Globally Unique Identifier (entire table): ba.freestatistics.org/blog/index.php?pk=193050&T=0

As an alternative you can also use a QR Code:  

The GUIDs for individual cells are displayed in the table below:

Summary of computational transaction
Raw Inputview raw input (R code)
Raw Outputview raw output of R engine
Computing time2 seconds
R Server'Gwilym Jenkins' @ jenkins.wessa.net


Autocorrelation Function
Time lag kACF(k)T-STATP-value
1-0.533115-4.49211.3e-05
2-0.027899-0.23510.407412
30.1447811.21990.11326
4-0.237271-1.99930.024703
50.2342611.97390.026141
60.1304181.09890.137758
7-0.345753-2.91340.002389
80.0566170.47710.317392
90.2541622.14160.017829
10-0.299487-2.52350.006929
110.2696052.27170.013068
12-0.178019-1.50.069022
13-0.135469-1.14150.128752
140.2707912.28170.012753
15-0.074564-0.62830.265917
16-0.103635-0.87320.192736
170.1257061.05920.146545
18-0.122053-1.02840.153617
190.0756240.63720.263015
200.033410.28150.389568
21-0.048303-0.4070.342614
22-0.034375-0.28960.386466
230.1455561.22650.112035
24-0.124158-1.04620.149514
25-0.018823-0.15860.437213
260.0718550.60550.273402
27-0.010529-0.08870.464779
280.0073650.06210.475345
29-0.013801-0.11630.453877
30-0.032426-0.27320.392735
31-0.069134-0.58250.281025
320.1924841.62190.054629
33-0.111288-0.93770.17578
34-0.062642-0.52780.299631
350.1506371.26930.104241
36-0.182658-1.53910.064112
370.1380441.16320.124326
380.0376860.31760.375879
39-0.137771-1.16090.12479
400.0451590.38050.35235
410.0228150.19220.424051
420.0035660.030.488057
430.0291310.24550.403402
440.0162890.13730.445608
45-0.176347-1.48590.070863
460.2004031.68860.047839
47-0.054068-0.45560.325038
48-0.047447-0.39980.345252

\begin{tabular}{lllllllll}
\hline
Autocorrelation Function \tabularnewline
Time lag k & ACF(k) & T-STAT & P-value \tabularnewline
1 & -0.533115 & -4.4921 & 1.3e-05 \tabularnewline
2 & -0.027899 & -0.2351 & 0.407412 \tabularnewline
3 & 0.144781 & 1.2199 & 0.11326 \tabularnewline
4 & -0.237271 & -1.9993 & 0.024703 \tabularnewline
5 & 0.234261 & 1.9739 & 0.026141 \tabularnewline
6 & 0.130418 & 1.0989 & 0.137758 \tabularnewline
7 & -0.345753 & -2.9134 & 0.002389 \tabularnewline
8 & 0.056617 & 0.4771 & 0.317392 \tabularnewline
9 & 0.254162 & 2.1416 & 0.017829 \tabularnewline
10 & -0.299487 & -2.5235 & 0.006929 \tabularnewline
11 & 0.269605 & 2.2717 & 0.013068 \tabularnewline
12 & -0.178019 & -1.5 & 0.069022 \tabularnewline
13 & -0.135469 & -1.1415 & 0.128752 \tabularnewline
14 & 0.270791 & 2.2817 & 0.012753 \tabularnewline
15 & -0.074564 & -0.6283 & 0.265917 \tabularnewline
16 & -0.103635 & -0.8732 & 0.192736 \tabularnewline
17 & 0.125706 & 1.0592 & 0.146545 \tabularnewline
18 & -0.122053 & -1.0284 & 0.153617 \tabularnewline
19 & 0.075624 & 0.6372 & 0.263015 \tabularnewline
20 & 0.03341 & 0.2815 & 0.389568 \tabularnewline
21 & -0.048303 & -0.407 & 0.342614 \tabularnewline
22 & -0.034375 & -0.2896 & 0.386466 \tabularnewline
23 & 0.145556 & 1.2265 & 0.112035 \tabularnewline
24 & -0.124158 & -1.0462 & 0.149514 \tabularnewline
25 & -0.018823 & -0.1586 & 0.437213 \tabularnewline
26 & 0.071855 & 0.6055 & 0.273402 \tabularnewline
27 & -0.010529 & -0.0887 & 0.464779 \tabularnewline
28 & 0.007365 & 0.0621 & 0.475345 \tabularnewline
29 & -0.013801 & -0.1163 & 0.453877 \tabularnewline
30 & -0.032426 & -0.2732 & 0.392735 \tabularnewline
31 & -0.069134 & -0.5825 & 0.281025 \tabularnewline
32 & 0.192484 & 1.6219 & 0.054629 \tabularnewline
33 & -0.111288 & -0.9377 & 0.17578 \tabularnewline
34 & -0.062642 & -0.5278 & 0.299631 \tabularnewline
35 & 0.150637 & 1.2693 & 0.104241 \tabularnewline
36 & -0.182658 & -1.5391 & 0.064112 \tabularnewline
37 & 0.138044 & 1.1632 & 0.124326 \tabularnewline
38 & 0.037686 & 0.3176 & 0.375879 \tabularnewline
39 & -0.137771 & -1.1609 & 0.12479 \tabularnewline
40 & 0.045159 & 0.3805 & 0.35235 \tabularnewline
41 & 0.022815 & 0.1922 & 0.424051 \tabularnewline
42 & 0.003566 & 0.03 & 0.488057 \tabularnewline
43 & 0.029131 & 0.2455 & 0.403402 \tabularnewline
44 & 0.016289 & 0.1373 & 0.445608 \tabularnewline
45 & -0.176347 & -1.4859 & 0.070863 \tabularnewline
46 & 0.200403 & 1.6886 & 0.047839 \tabularnewline
47 & -0.054068 & -0.4556 & 0.325038 \tabularnewline
48 & -0.047447 & -0.3998 & 0.345252 \tabularnewline
\hline
\end{tabular}
%Source: https://freestatistics.org/blog/index.php?pk=193050&T=1

[TABLE]
[ROW][C]Autocorrelation Function[/C][/ROW]
[ROW][C]Time lag k[/C][C]ACF(k)[/C][C]T-STAT[/C][C]P-value[/C][/ROW]
[ROW][C]1[/C][C]-0.533115[/C][C]-4.4921[/C][C]1.3e-05[/C][/ROW]
[ROW][C]2[/C][C]-0.027899[/C][C]-0.2351[/C][C]0.407412[/C][/ROW]
[ROW][C]3[/C][C]0.144781[/C][C]1.2199[/C][C]0.11326[/C][/ROW]
[ROW][C]4[/C][C]-0.237271[/C][C]-1.9993[/C][C]0.024703[/C][/ROW]
[ROW][C]5[/C][C]0.234261[/C][C]1.9739[/C][C]0.026141[/C][/ROW]
[ROW][C]6[/C][C]0.130418[/C][C]1.0989[/C][C]0.137758[/C][/ROW]
[ROW][C]7[/C][C]-0.345753[/C][C]-2.9134[/C][C]0.002389[/C][/ROW]
[ROW][C]8[/C][C]0.056617[/C][C]0.4771[/C][C]0.317392[/C][/ROW]
[ROW][C]9[/C][C]0.254162[/C][C]2.1416[/C][C]0.017829[/C][/ROW]
[ROW][C]10[/C][C]-0.299487[/C][C]-2.5235[/C][C]0.006929[/C][/ROW]
[ROW][C]11[/C][C]0.269605[/C][C]2.2717[/C][C]0.013068[/C][/ROW]
[ROW][C]12[/C][C]-0.178019[/C][C]-1.5[/C][C]0.069022[/C][/ROW]
[ROW][C]13[/C][C]-0.135469[/C][C]-1.1415[/C][C]0.128752[/C][/ROW]
[ROW][C]14[/C][C]0.270791[/C][C]2.2817[/C][C]0.012753[/C][/ROW]
[ROW][C]15[/C][C]-0.074564[/C][C]-0.6283[/C][C]0.265917[/C][/ROW]
[ROW][C]16[/C][C]-0.103635[/C][C]-0.8732[/C][C]0.192736[/C][/ROW]
[ROW][C]17[/C][C]0.125706[/C][C]1.0592[/C][C]0.146545[/C][/ROW]
[ROW][C]18[/C][C]-0.122053[/C][C]-1.0284[/C][C]0.153617[/C][/ROW]
[ROW][C]19[/C][C]0.075624[/C][C]0.6372[/C][C]0.263015[/C][/ROW]
[ROW][C]20[/C][C]0.03341[/C][C]0.2815[/C][C]0.389568[/C][/ROW]
[ROW][C]21[/C][C]-0.048303[/C][C]-0.407[/C][C]0.342614[/C][/ROW]
[ROW][C]22[/C][C]-0.034375[/C][C]-0.2896[/C][C]0.386466[/C][/ROW]
[ROW][C]23[/C][C]0.145556[/C][C]1.2265[/C][C]0.112035[/C][/ROW]
[ROW][C]24[/C][C]-0.124158[/C][C]-1.0462[/C][C]0.149514[/C][/ROW]
[ROW][C]25[/C][C]-0.018823[/C][C]-0.1586[/C][C]0.437213[/C][/ROW]
[ROW][C]26[/C][C]0.071855[/C][C]0.6055[/C][C]0.273402[/C][/ROW]
[ROW][C]27[/C][C]-0.010529[/C][C]-0.0887[/C][C]0.464779[/C][/ROW]
[ROW][C]28[/C][C]0.007365[/C][C]0.0621[/C][C]0.475345[/C][/ROW]
[ROW][C]29[/C][C]-0.013801[/C][C]-0.1163[/C][C]0.453877[/C][/ROW]
[ROW][C]30[/C][C]-0.032426[/C][C]-0.2732[/C][C]0.392735[/C][/ROW]
[ROW][C]31[/C][C]-0.069134[/C][C]-0.5825[/C][C]0.281025[/C][/ROW]
[ROW][C]32[/C][C]0.192484[/C][C]1.6219[/C][C]0.054629[/C][/ROW]
[ROW][C]33[/C][C]-0.111288[/C][C]-0.9377[/C][C]0.17578[/C][/ROW]
[ROW][C]34[/C][C]-0.062642[/C][C]-0.5278[/C][C]0.299631[/C][/ROW]
[ROW][C]35[/C][C]0.150637[/C][C]1.2693[/C][C]0.104241[/C][/ROW]
[ROW][C]36[/C][C]-0.182658[/C][C]-1.5391[/C][C]0.064112[/C][/ROW]
[ROW][C]37[/C][C]0.138044[/C][C]1.1632[/C][C]0.124326[/C][/ROW]
[ROW][C]38[/C][C]0.037686[/C][C]0.3176[/C][C]0.375879[/C][/ROW]
[ROW][C]39[/C][C]-0.137771[/C][C]-1.1609[/C][C]0.12479[/C][/ROW]
[ROW][C]40[/C][C]0.045159[/C][C]0.3805[/C][C]0.35235[/C][/ROW]
[ROW][C]41[/C][C]0.022815[/C][C]0.1922[/C][C]0.424051[/C][/ROW]
[ROW][C]42[/C][C]0.003566[/C][C]0.03[/C][C]0.488057[/C][/ROW]
[ROW][C]43[/C][C]0.029131[/C][C]0.2455[/C][C]0.403402[/C][/ROW]
[ROW][C]44[/C][C]0.016289[/C][C]0.1373[/C][C]0.445608[/C][/ROW]
[ROW][C]45[/C][C]-0.176347[/C][C]-1.4859[/C][C]0.070863[/C][/ROW]
[ROW][C]46[/C][C]0.200403[/C][C]1.6886[/C][C]0.047839[/C][/ROW]
[ROW][C]47[/C][C]-0.054068[/C][C]-0.4556[/C][C]0.325038[/C][/ROW]
[ROW][C]48[/C][C]-0.047447[/C][C]-0.3998[/C][C]0.345252[/C][/ROW]
[/TABLE]
Source: https://freestatistics.org/blog/index.php?pk=193050&T=1

Globally Unique Identifier (entire table): ba.freestatistics.org/blog/index.php?pk=193050&T=1

As an alternative you can also use a QR Code:  

The GUIDs for individual cells are displayed in the table below:

Autocorrelation Function
Time lag kACF(k)T-STATP-value
1-0.533115-4.49211.3e-05
2-0.027899-0.23510.407412
30.1447811.21990.11326
4-0.237271-1.99930.024703
50.2342611.97390.026141
60.1304181.09890.137758
7-0.345753-2.91340.002389
80.0566170.47710.317392
90.2541622.14160.017829
10-0.299487-2.52350.006929
110.2696052.27170.013068
12-0.178019-1.50.069022
13-0.135469-1.14150.128752
140.2707912.28170.012753
15-0.074564-0.62830.265917
16-0.103635-0.87320.192736
170.1257061.05920.146545
18-0.122053-1.02840.153617
190.0756240.63720.263015
200.033410.28150.389568
21-0.048303-0.4070.342614
22-0.034375-0.28960.386466
230.1455561.22650.112035
24-0.124158-1.04620.149514
25-0.018823-0.15860.437213
260.0718550.60550.273402
27-0.010529-0.08870.464779
280.0073650.06210.475345
29-0.013801-0.11630.453877
30-0.032426-0.27320.392735
31-0.069134-0.58250.281025
320.1924841.62190.054629
33-0.111288-0.93770.17578
34-0.062642-0.52780.299631
350.1506371.26930.104241
36-0.182658-1.53910.064112
370.1380441.16320.124326
380.0376860.31760.375879
39-0.137771-1.16090.12479
400.0451590.38050.35235
410.0228150.19220.424051
420.0035660.030.488057
430.0291310.24550.403402
440.0162890.13730.445608
45-0.176347-1.48590.070863
460.2004031.68860.047839
47-0.054068-0.45560.325038
48-0.047447-0.39980.345252


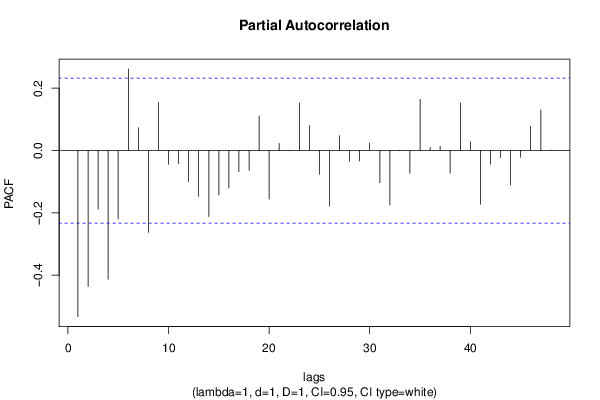
Partial Autocorrelation Function
Time lag kPACF(k)T-STATP-value
1-0.533115-4.49211.3e-05
2-0.436037-3.67410.00023
3-0.188089-1.58490.05872
4-0.413119-3.4810.000429
5-0.21966-1.85090.034173
60.2619012.20680.015281
70.0728490.61380.270642
8-0.262722-2.21370.01503
90.1543911.30090.098746
10-0.044121-0.37180.355585
11-0.042324-0.35660.361215
12-0.099886-0.84170.201404
13-0.147074-1.23930.109664
14-0.211908-1.78560.03922
15-0.1423-1.1990.11725
16-0.120127-1.01220.157438
17-0.067726-0.57070.285012
18-0.063938-0.53880.295871
190.1109840.93520.176436
20-0.155848-1.31320.096672
210.0225670.19010.424867
220.0006390.00540.49786
230.1522461.28280.101858
240.080460.6780.249999
25-0.075733-0.63810.262718
26-0.178491-1.5040.06851
270.0476520.40150.344621
28-0.034066-0.2870.387456
29-0.0338-0.28480.388311
300.0241930.20390.419525
31-0.103439-0.87160.193183
32-0.174816-1.4730.072582
330.0013950.01180.495329
34-0.073022-0.61530.270163
350.1642571.38410.085339
360.009720.08190.467478
370.0137790.11610.45395
38-0.072508-0.6110.271587
390.1521551.28210.101993
400.0281410.23710.406624
41-0.171945-1.44880.075893
42-0.043666-0.36790.357009
43-0.022225-0.18730.42599
44-0.110479-0.93090.177527
45-0.021762-0.18340.427514
460.0775230.65320.257861
470.1300961.09620.138347
480.0004720.0040.498419

\begin{tabular}{lllllllll}
\hline
Partial Autocorrelation Function \tabularnewline
Time lag k & PACF(k) & T-STAT & P-value \tabularnewline
1 & -0.533115 & -4.4921 & 1.3e-05 \tabularnewline
2 & -0.436037 & -3.6741 & 0.00023 \tabularnewline
3 & -0.188089 & -1.5849 & 0.05872 \tabularnewline
4 & -0.413119 & -3.481 & 0.000429 \tabularnewline
5 & -0.21966 & -1.8509 & 0.034173 \tabularnewline
6 & 0.261901 & 2.2068 & 0.015281 \tabularnewline
7 & 0.072849 & 0.6138 & 0.270642 \tabularnewline
8 & -0.262722 & -2.2137 & 0.01503 \tabularnewline
9 & 0.154391 & 1.3009 & 0.098746 \tabularnewline
10 & -0.044121 & -0.3718 & 0.355585 \tabularnewline
11 & -0.042324 & -0.3566 & 0.361215 \tabularnewline
12 & -0.099886 & -0.8417 & 0.201404 \tabularnewline
13 & -0.147074 & -1.2393 & 0.109664 \tabularnewline
14 & -0.211908 & -1.7856 & 0.03922 \tabularnewline
15 & -0.1423 & -1.199 & 0.11725 \tabularnewline
16 & -0.120127 & -1.0122 & 0.157438 \tabularnewline
17 & -0.067726 & -0.5707 & 0.285012 \tabularnewline
18 & -0.063938 & -0.5388 & 0.295871 \tabularnewline
19 & 0.110984 & 0.9352 & 0.176436 \tabularnewline
20 & -0.155848 & -1.3132 & 0.096672 \tabularnewline
21 & 0.022567 & 0.1901 & 0.424867 \tabularnewline
22 & 0.000639 & 0.0054 & 0.49786 \tabularnewline
23 & 0.152246 & 1.2828 & 0.101858 \tabularnewline
24 & 0.08046 & 0.678 & 0.249999 \tabularnewline
25 & -0.075733 & -0.6381 & 0.262718 \tabularnewline
26 & -0.178491 & -1.504 & 0.06851 \tabularnewline
27 & 0.047652 & 0.4015 & 0.344621 \tabularnewline
28 & -0.034066 & -0.287 & 0.387456 \tabularnewline
29 & -0.0338 & -0.2848 & 0.388311 \tabularnewline
30 & 0.024193 & 0.2039 & 0.419525 \tabularnewline
31 & -0.103439 & -0.8716 & 0.193183 \tabularnewline
32 & -0.174816 & -1.473 & 0.072582 \tabularnewline
33 & 0.001395 & 0.0118 & 0.495329 \tabularnewline
34 & -0.073022 & -0.6153 & 0.270163 \tabularnewline
35 & 0.164257 & 1.3841 & 0.085339 \tabularnewline
36 & 0.00972 & 0.0819 & 0.467478 \tabularnewline
37 & 0.013779 & 0.1161 & 0.45395 \tabularnewline
38 & -0.072508 & -0.611 & 0.271587 \tabularnewline
39 & 0.152155 & 1.2821 & 0.101993 \tabularnewline
40 & 0.028141 & 0.2371 & 0.406624 \tabularnewline
41 & -0.171945 & -1.4488 & 0.075893 \tabularnewline
42 & -0.043666 & -0.3679 & 0.357009 \tabularnewline
43 & -0.022225 & -0.1873 & 0.42599 \tabularnewline
44 & -0.110479 & -0.9309 & 0.177527 \tabularnewline
45 & -0.021762 & -0.1834 & 0.427514 \tabularnewline
46 & 0.077523 & 0.6532 & 0.257861 \tabularnewline
47 & 0.130096 & 1.0962 & 0.138347 \tabularnewline
48 & 0.000472 & 0.004 & 0.498419 \tabularnewline
\hline
\end{tabular}
%Source: https://freestatistics.org/blog/index.php?pk=193050&T=2

[TABLE]
[ROW][C]Partial Autocorrelation Function[/C][/ROW]
[ROW][C]Time lag k[/C][C]PACF(k)[/C][C]T-STAT[/C][C]P-value[/C][/ROW]
[ROW][C]1[/C][C]-0.533115[/C][C]-4.4921[/C][C]1.3e-05[/C][/ROW]
[ROW][C]2[/C][C]-0.436037[/C][C]-3.6741[/C][C]0.00023[/C][/ROW]
[ROW][C]3[/C][C]-0.188089[/C][C]-1.5849[/C][C]0.05872[/C][/ROW]
[ROW][C]4[/C][C]-0.413119[/C][C]-3.481[/C][C]0.000429[/C][/ROW]
[ROW][C]5[/C][C]-0.21966[/C][C]-1.8509[/C][C]0.034173[/C][/ROW]
[ROW][C]6[/C][C]0.261901[/C][C]2.2068[/C][C]0.015281[/C][/ROW]
[ROW][C]7[/C][C]0.072849[/C][C]0.6138[/C][C]0.270642[/C][/ROW]
[ROW][C]8[/C][C]-0.262722[/C][C]-2.2137[/C][C]0.01503[/C][/ROW]
[ROW][C]9[/C][C]0.154391[/C][C]1.3009[/C][C]0.098746[/C][/ROW]
[ROW][C]10[/C][C]-0.044121[/C][C]-0.3718[/C][C]0.355585[/C][/ROW]
[ROW][C]11[/C][C]-0.042324[/C][C]-0.3566[/C][C]0.361215[/C][/ROW]
[ROW][C]12[/C][C]-0.099886[/C][C]-0.8417[/C][C]0.201404[/C][/ROW]
[ROW][C]13[/C][C]-0.147074[/C][C]-1.2393[/C][C]0.109664[/C][/ROW]
[ROW][C]14[/C][C]-0.211908[/C][C]-1.7856[/C][C]0.03922[/C][/ROW]
[ROW][C]15[/C][C]-0.1423[/C][C]-1.199[/C][C]0.11725[/C][/ROW]
[ROW][C]16[/C][C]-0.120127[/C][C]-1.0122[/C][C]0.157438[/C][/ROW]
[ROW][C]17[/C][C]-0.067726[/C][C]-0.5707[/C][C]0.285012[/C][/ROW]
[ROW][C]18[/C][C]-0.063938[/C][C]-0.5388[/C][C]0.295871[/C][/ROW]
[ROW][C]19[/C][C]0.110984[/C][C]0.9352[/C][C]0.176436[/C][/ROW]
[ROW][C]20[/C][C]-0.155848[/C][C]-1.3132[/C][C]0.096672[/C][/ROW]
[ROW][C]21[/C][C]0.022567[/C][C]0.1901[/C][C]0.424867[/C][/ROW]
[ROW][C]22[/C][C]0.000639[/C][C]0.0054[/C][C]0.49786[/C][/ROW]
[ROW][C]23[/C][C]0.152246[/C][C]1.2828[/C][C]0.101858[/C][/ROW]
[ROW][C]24[/C][C]0.08046[/C][C]0.678[/C][C]0.249999[/C][/ROW]
[ROW][C]25[/C][C]-0.075733[/C][C]-0.6381[/C][C]0.262718[/C][/ROW]
[ROW][C]26[/C][C]-0.178491[/C][C]-1.504[/C][C]0.06851[/C][/ROW]
[ROW][C]27[/C][C]0.047652[/C][C]0.4015[/C][C]0.344621[/C][/ROW]
[ROW][C]28[/C][C]-0.034066[/C][C]-0.287[/C][C]0.387456[/C][/ROW]
[ROW][C]29[/C][C]-0.0338[/C][C]-0.2848[/C][C]0.388311[/C][/ROW]
[ROW][C]30[/C][C]0.024193[/C][C]0.2039[/C][C]0.419525[/C][/ROW]
[ROW][C]31[/C][C]-0.103439[/C][C]-0.8716[/C][C]0.193183[/C][/ROW]
[ROW][C]32[/C][C]-0.174816[/C][C]-1.473[/C][C]0.072582[/C][/ROW]
[ROW][C]33[/C][C]0.001395[/C][C]0.0118[/C][C]0.495329[/C][/ROW]
[ROW][C]34[/C][C]-0.073022[/C][C]-0.6153[/C][C]0.270163[/C][/ROW]
[ROW][C]35[/C][C]0.164257[/C][C]1.3841[/C][C]0.085339[/C][/ROW]
[ROW][C]36[/C][C]0.00972[/C][C]0.0819[/C][C]0.467478[/C][/ROW]
[ROW][C]37[/C][C]0.013779[/C][C]0.1161[/C][C]0.45395[/C][/ROW]
[ROW][C]38[/C][C]-0.072508[/C][C]-0.611[/C][C]0.271587[/C][/ROW]
[ROW][C]39[/C][C]0.152155[/C][C]1.2821[/C][C]0.101993[/C][/ROW]
[ROW][C]40[/C][C]0.028141[/C][C]0.2371[/C][C]0.406624[/C][/ROW]
[ROW][C]41[/C][C]-0.171945[/C][C]-1.4488[/C][C]0.075893[/C][/ROW]
[ROW][C]42[/C][C]-0.043666[/C][C]-0.3679[/C][C]0.357009[/C][/ROW]
[ROW][C]43[/C][C]-0.022225[/C][C]-0.1873[/C][C]0.42599[/C][/ROW]
[ROW][C]44[/C][C]-0.110479[/C][C]-0.9309[/C][C]0.177527[/C][/ROW]
[ROW][C]45[/C][C]-0.021762[/C][C]-0.1834[/C][C]0.427514[/C][/ROW]
[ROW][C]46[/C][C]0.077523[/C][C]0.6532[/C][C]0.257861[/C][/ROW]
[ROW][C]47[/C][C]0.130096[/C][C]1.0962[/C][C]0.138347[/C][/ROW]
[ROW][C]48[/C][C]0.000472[/C][C]0.004[/C][C]0.498419[/C][/ROW]
[/TABLE]
Source: https://freestatistics.org/blog/index.php?pk=193050&T=2

Globally Unique Identifier (entire table): ba.freestatistics.org/blog/index.php?pk=193050&T=2

As an alternative you can also use a QR Code:  

The GUIDs for individual cells are displayed in the table below:

Partial Autocorrelation Function
Time lag kPACF(k)T-STATP-value
1-0.533115-4.49211.3e-05
2-0.436037-3.67410.00023
3-0.188089-1.58490.05872
4-0.413119-3.4810.000429
5-0.21966-1.85090.034173
60.2619012.20680.015281
70.0728490.61380.270642
8-0.262722-2.21370.01503
90.1543911.30090.098746
10-0.044121-0.37180.355585
11-0.042324-0.35660.361215
12-0.099886-0.84170.201404
13-0.147074-1.23930.109664
14-0.211908-1.78560.03922
15-0.1423-1.1990.11725
16-0.120127-1.01220.157438
17-0.067726-0.57070.285012
18-0.063938-0.53880.295871
190.1109840.93520.176436
20-0.155848-1.31320.096672
210.0225670.19010.424867
220.0006390.00540.49786
230.1522461.28280.101858
240.080460.6780.249999
25-0.075733-0.63810.262718
26-0.178491-1.5040.06851
270.0476520.40150.344621
28-0.034066-0.2870.387456
29-0.0338-0.28480.388311
300.0241930.20390.419525
31-0.103439-0.87160.193183
32-0.174816-1.4730.072582
330.0013950.01180.495329
34-0.073022-0.61530.270163
350.1642571.38410.085339
360.009720.08190.467478
370.0137790.11610.45395
38-0.072508-0.6110.271587
390.1521551.28210.101993
400.0281410.23710.406624
41-0.171945-1.44880.075893
42-0.043666-0.36790.357009
43-0.022225-0.18730.42599
44-0.110479-0.93090.177527
45-0.021762-0.18340.427514
460.0775230.65320.257861
470.1300961.09620.138347
480.0004720.0040.498419


Parameters (Session):
par1 = 48 ; par2 = 1 ; par3 = 1 ; par4 = 1 ; par5 = 12 ; par6 = White Noise ; par7 = 0.95 ;
Parameters (R input):
par1 = 48 ; par2 = 1 ; par3 = 1 ; par4 = 1 ; par5 = 12 ; par6 = White Noise ; par7 = 0.95 ; par8 = ;
R code (references can be found in the software module):
par8 <- ''
par7 <- '0.95'
par6 <- 'White Noise'
par5 <- '12'
par4 <- '0'
par3 <- '1'
par2 <- '1'
par1 <- '48'
if (par1 == 'Default') {
par1 = 10*log10(length(x))
} else {
par1 <- as.numeric(par1)
}
par2 <- as.numeric(par2)
par3 <- as.numeric(par3)
par4 <- as.numeric(par4)
par5 <- as.numeric(par5)
if (par6 == 'White Noise') par6 <- 'white' else par6 <- 'ma'
par7 <- as.numeric(par7)
if (par8 != '') par8 <- as.numeric(par8)
ox <- x
if (par8 == '') {
if (par2 == 0) {
x <- log(x)
} else {
x <- (x ^ par2 - 1) / par2
}
} else {
x <- log(x,base=par8)
}
if (par3 > 0) x <- diff(x,lag=1,difference=par3)
if (par4 > 0) x <- diff(x,lag=par5,difference=par4)
bitmap(file='picts.png')
op <- par(mfrow=c(2,1))
plot(ox,type='l',main='Original Time Series',xlab='time',ylab='value')
if (par8=='') {
mytitle <- paste('Working Time Series (lambda=',par2,', d=',par3,', D=',par4,')',sep='')
mysub <- paste('(lambda=',par2,', d=',par3,', D=',par4,', CI=', par7, ', CI type=',par6,')',sep='')
} else {
mytitle <- paste('Working Time Series (base=',par8,', d=',par3,', D=',par4,')',sep='')
mysub <- paste('(base=',par8,', d=',par3,', D=',par4,', CI=', par7, ', CI type=',par6,')',sep='')
}
plot(x,type='l', main=mytitle,xlab='time',ylab='value')
par(op)
dev.off()
bitmap(file='pic1.png')
racf <- acf(x, par1, main='Autocorrelation', xlab='time lag', ylab='ACF', ci.type=par6, ci=par7, sub=mysub)
dev.off()
bitmap(file='pic2.png')
rpacf <- pacf(x,par1,main='Partial Autocorrelation',xlab='lags',ylab='PACF',sub=mysub)
dev.off()
(myacf <- c(racf$acf))
(mypacf <- c(rpacf$acf))
lengthx <- length(x)
sqrtn <- sqrt(lengthx)
load(file='createtable')
a<-table.start()
a<-table.row.start(a)
a<-table.element(a,'Autocorrelation Function',4,TRUE)
a<-table.row.end(a)
a<-table.row.start(a)
a<-table.element(a,'Time lag k',header=TRUE)
a<-table.element(a,hyperlink('basics.htm','ACF(k)','click here for more information about the Autocorrelation Function'),header=TRUE)
a<-table.element(a,'T-STAT',header=TRUE)
a<-table.element(a,'P-value',header=TRUE)
a<-table.row.end(a)
for (i in 2:(par1+1)) {
a<-table.row.start(a)
a<-table.element(a,i-1,header=TRUE)
a<-table.element(a,round(myacf[i],6))
mytstat <- myacf[i]*sqrtn
a<-table.element(a,round(mytstat,4))
a<-table.element(a,round(1-pt(abs(mytstat),lengthx),6))
a<-table.row.end(a)
}
a<-table.end(a)
table.save(a,file='mytable.tab')
a<-table.start()
a<-table.row.start(a)
a<-table.element(a,'Partial Autocorrelation Function',4,TRUE)
a<-table.row.end(a)
a<-table.row.start(a)
a<-table.element(a,'Time lag k',header=TRUE)
a<-table.element(a,hyperlink('basics.htm','PACF(k)','click here for more information about the Partial Autocorrelation Function'),header=TRUE)
a<-table.element(a,'T-STAT',header=TRUE)
a<-table.element(a,'P-value',header=TRUE)
a<-table.row.end(a)
for (i in 1:par1) {
a<-table.row.start(a)
a<-table.element(a,i,header=TRUE)
a<-table.element(a,round(mypacf[i],6))
mytstat <- mypacf[i]*sqrtn
a<-table.element(a,round(mytstat,4))
a<-table.element(a,round(1-pt(abs(mytstat),lengthx),6))
a<-table.row.end(a)
}
a<-table.end(a)
table.save(a,file='mytable1.tab')