Free Statistics

of Irreproducible Research!

Author's title

Author*The author of this computation has been verified*
R Software Modulerwasp_notchedbox1.wasp
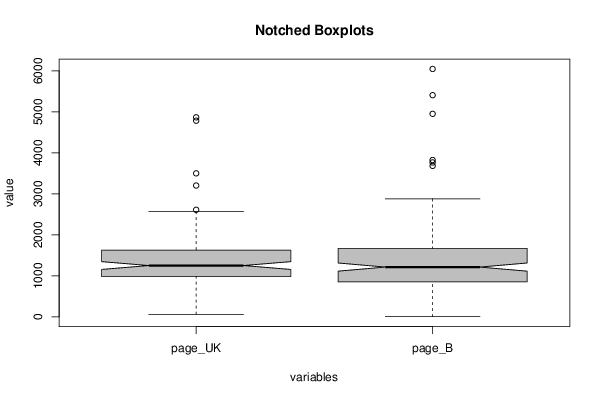
Title produced by softwareNotched Boxplots
Date of computationMon, 26 Nov 2012 05:57:04 -0500
Cite this page as followsStatistical Computations at FreeStatistics.org, Office for Research Development and Education, URL https://freestatistics.org/blog/index.php?v=date/2012/Nov/26/t1353927432rs2iaxgln0wvhuu.htm/, Retrieved Tue, 30 Apr 2024 06:15:17 +0000
Statistical Computations at FreeStatistics.org, Office for Research Development and Education, URL https://freestatistics.org/blog/index.php?pk=193010, Retrieved Tue, 30 Apr 2024 06:15:17 +0000
QR Codes:

Original text written by user:
IsPrivate?No (this computation is public)
User-defined keywords
Estimated Impact79
Family? (F = Feedback message, R = changed R code, M = changed R Module, P = changed Parameters, D = changed Data)
-       [Notched Boxplots] [] [2012-11-26 10:57:04] [d76b387543b13b5e3afd8ff9e5fdc89f] [Current]
Feedback Forum

Post a new message
Dataseries X:
4785	5407
4867	6047
2612	4952
1716	3826
3204	3767
1574	3683
2114	2327
1732	2783
2280	2632
3501	2097
1811	1984
1823	2610
1945	2145
1472	2272
1587	2329
2465	2683
1236	2325
1786	1985
1550	2077
1616	1638
1510	1806
1311	2595
1667	2127
2107	2276
2442	2104
2330	1655
2495	1343
1957	1578
1520	1798
1629	1993
1927	1949
1294	1209
1614	1636
1186	1357
1627	1356
912	1411
1627	1991
1241	2878
1326	2170
1836	1677
1180	1180
1252	2081
1636	1614
2337	1303
2571	1594
1164	1630
1926	1130
1219	1248
1575	1871
1191	1216
1136	1505
1436	1184
1370	1404
1319	1275
1189	1396
1103	1401
1373	1669
1031	1229
1125	1322
1333	1086
984	1220
886	1356
1303	1272
1374	1974
1253	1670
1330	1354
1241	1146
1622	1214
1095	2001
1799	973
983	1188
1510	1289
1063	1197
1498	1418
927	2230
1192	1283
1037	1186
1616	993
1156	1202
1024	1207
738	1611
1266	1461
1024	2091
952	1101
990	1172
892	1532
1061	1094
707	1503
710	1198
1143	713
854	2444
762	1112
928	1617
900	1129
1033	1122
900	1500
992	1021
977	1419
1258	1010
591	1243
1184	928
981	748
685	1182
821	999
753	1495
867	1001
937	1853
1110	1975
566	767
217	836
166	1012
414	699
64	1225
96	1728
NA	952
NA	1128
NA	846
NA	1205
NA	729
NA	714
NA	858
NA	1595
NA	833
NA	1120
NA	1141
NA	886
NA	814
NA	1043
NA	998
NA	1228
NA	1066
NA	1592
NA	727
NA	782
NA	926
NA	769
NA	1110
NA	839
NA	791
NA	866
NA	841
NA	538
NA	824
NA	570
NA	463
NA	442
NA	962
NA	523
NA	595
NA	543
NA	386
NA	379
NA	678
NA	595
NA	486
NA	411
NA	465
NA	509
NA	206
NA	158
NA	379
NA	44
NA	100
NA	40
NA	67
NA	6
NA	20
NA	37


Summary of computational transaction
Raw Inputview raw input (R code)
Raw Outputview raw output of R engine
Computing time2 seconds
R Server'Gertrude Mary Cox' @ cox.wessa.net

\begin{tabular}{lllllllll}
\hline
Summary of computational transaction \tabularnewline
Raw Input & view raw input (R code)  \tabularnewline
Raw Output & view raw output of R engine  \tabularnewline
Computing time & 2 seconds \tabularnewline
R Server & 'Gertrude Mary Cox' @ cox.wessa.net \tabularnewline
\hline
\end{tabular}
%Source: https://freestatistics.org/blog/index.php?pk=193010&T=0

[TABLE]
[ROW][C]Summary of computational transaction[/C][/ROW]
[ROW][C]Raw Input[/C][C]view raw input (R code) [/C][/ROW]
[ROW][C]Raw Output[/C][C]view raw output of R engine [/C][/ROW]
[ROW][C]Computing time[/C][C]2 seconds[/C][/ROW]
[ROW][C]R Server[/C][C]'Gertrude Mary Cox' @ cox.wessa.net[/C][/ROW]
[/TABLE]
Source: https://freestatistics.org/blog/index.php?pk=193010&T=0

Globally Unique Identifier (entire table): ba.freestatistics.org/blog/index.php?pk=193010&T=0

As an alternative you can also use a QR Code:  

The GUIDs for individual cells are displayed in the table below:

Summary of computational transaction
Raw Inputview raw input (R code)
Raw Outputview raw output of R engine
Computing time2 seconds
R Server'Gertrude Mary Cox' @ cox.wessa.net


Boxplot statistics
Variablelower whiskerlower hingemedianupper hingeupper whisker
page_UK649841252.516272571
page_B685212151669.52878

\begin{tabular}{lllllllll}
\hline
Boxplot statistics \tabularnewline
Variable & lower whisker & lower hinge & median & upper hinge & upper whisker \tabularnewline
page_UK & 64 & 984 & 1252.5 & 1627 & 2571 \tabularnewline
page_B & 6 & 852 & 1215 & 1669.5 & 2878 \tabularnewline
\hline
\end{tabular}
%Source: https://freestatistics.org/blog/index.php?pk=193010&T=1

[TABLE]
[ROW][C]Boxplot statistics[/C][/ROW]
[ROW][C]Variable[/C][C]lower whisker[/C][C]lower hinge[/C][C]median[/C][C]upper hinge[/C][C]upper whisker[/C][/ROW]
[ROW][C]page_UK[/C][C]64[/C][C]984[/C][C]1252.5[/C][C]1627[/C][C]2571[/C][/ROW]
[ROW][C]page_B[/C][C]6[/C][C]852[/C][C]1215[/C][C]1669.5[/C][C]2878[/C][/ROW]
[/TABLE]
Source: https://freestatistics.org/blog/index.php?pk=193010&T=1

Globally Unique Identifier (entire table): ba.freestatistics.org/blog/index.php?pk=193010&T=1

As an alternative you can also use a QR Code:  

The GUIDs for individual cells are displayed in the table below:

Boxplot statistics
Variablelower whiskerlower hingemedianupper hingeupper whisker
page_UK649841252.516272571
page_B685212151669.52878


Boxplot Notches
Variablelower boundmedianupper bound
page_UK1157.348501058171252.51347.65149894183
page_B1115.3470390107312151314.65296098927

\begin{tabular}{lllllllll}
\hline
Boxplot Notches \tabularnewline
Variable & lower bound & median & upper bound \tabularnewline
page_UK & 1157.34850105817 & 1252.5 & 1347.65149894183 \tabularnewline
page_B & 1115.34703901073 & 1215 & 1314.65296098927 \tabularnewline
\hline
\end{tabular}
%Source: https://freestatistics.org/blog/index.php?pk=193010&T=2

[TABLE]
[ROW][C]Boxplot Notches[/C][/ROW]
[ROW][C]Variable[/C][C]lower bound[/C][C]median[/C][C]upper bound[/C][/ROW]
[ROW][C]page_UK[/C][C]1157.34850105817[/C][C]1252.5[/C][C]1347.65149894183[/C][/ROW]
[ROW][C]page_B[/C][C]1115.34703901073[/C][C]1215[/C][C]1314.65296098927[/C][/ROW]
[/TABLE]
Source: https://freestatistics.org/blog/index.php?pk=193010&T=2

Globally Unique Identifier (entire table): ba.freestatistics.org/blog/index.php?pk=193010&T=2

As an alternative you can also use a QR Code:  

The GUIDs for individual cells are displayed in the table below:

Boxplot Notches
Variablelower boundmedianupper bound
page_UK1157.348501058171252.51347.65149894183
page_B1115.3470390107312151314.65296098927


Parameters (Session):
par1 = grey ;
Parameters (R input):
par1 = grey ;
R code (references can be found in the software module):
par1 <- 'grey'
z <- as.data.frame(t(y))
bitmap(file='test1.png')
(r<-boxplot(z ,xlab=xlab,ylab=ylab,main=main,notch=TRUE,col=par1))
dev.off()
load(file='createtable')
a<-table.start()
a<-table.row.start(a)
a<-table.element(a,hyperlink('overview.htm','Boxplot statistics','Boxplot overview'),6,TRUE)
a<-table.row.end(a)
a<-table.row.start(a)
a<-table.element(a,'Variable',1,TRUE)
a<-table.element(a,hyperlink('lower_whisker.htm','lower whisker','definition of lower whisker'),1,TRUE)
a<-table.element(a,hyperlink('lower_hinge.htm','lower hinge','definition of lower hinge'),1,TRUE)
a<-table.element(a,hyperlink('central_tendency.htm','median','definitions about measures of central tendency'),1,TRUE)
a<-table.element(a,hyperlink('upper_hinge.htm','upper hinge','definition of upper hinge'),1,TRUE)
a<-table.element(a,hyperlink('upper_whisker.htm','upper whisker','definition of upper whisker'),1,TRUE)
a<-table.row.end(a)
for (i in 1:length(y[,1]))
{
a<-table.row.start(a)
a<-table.element(a,dimnames(t(x))[[2]][i],1,TRUE)
for (j in 1:5)
{
a<-table.element(a,r$stats[j,i])
}
a<-table.row.end(a)
}
a<-table.end(a)
table.save(a,file='mytable.tab')
a<-table.start()
a<-table.row.start(a)
a<-table.element(a,'Boxplot Notches',4,TRUE)
a<-table.row.end(a)
a<-table.row.start(a)
a<-table.element(a,'Variable',1,TRUE)
a<-table.element(a,'lower bound',1,TRUE)
a<-table.element(a,'median',1,TRUE)
a<-table.element(a,'upper bound',1,TRUE)
a<-table.row.end(a)
for (i in 1:length(y[,1]))
{
a<-table.row.start(a)
a<-table.element(a,dimnames(t(x))[[2]][i],1,TRUE)
a<-table.element(a,r$conf[1,i])
a<-table.element(a,r$stats[3,i])
a<-table.element(a,r$conf[2,i])
a<-table.row.end(a)
}
a<-table.end(a)
table.save(a,file='mytable1.tab')