Free Statistics

of Irreproducible Research!

Author's title

Author*The author of this computation has been verified*
R Software Modulerwasp_autocorrelation.wasp
Title produced by software(Partial) Autocorrelation Function
Date of computationWed, 21 Nov 2012 10:49:05 -0500
Cite this page as followsStatistical Computations at FreeStatistics.org, Office for Research Development and Education, URL https://freestatistics.org/blog/index.php?v=date/2012/Nov/21/t1353512977mrj20v08ijl27lm.htm/, Retrieved Sat, 27 Apr 2024 14:32:59 +0000
Statistical Computations at FreeStatistics.org, Office for Research Development and Education, URL https://freestatistics.org/blog/index.php?pk=191454, Retrieved Sat, 27 Apr 2024 14:32:59 +0000
QR Codes:

Original text written by user:
IsPrivate?No (this computation is public)
User-defined keywords
Estimated Impact105
Family? (F = Feedback message, R = changed R code, M = changed R Module, P = changed Parameters, D = changed Data)
-     [Univariate Explorative Data Analysis] [Monthly US soldie...] [2010-11-02 12:07:39] [b98453cac15ba1066b407e146608df68]
- RMP   [Structural Time Series Models] [Soldiers] [2010-11-30 14:06:56] [b98453cac15ba1066b407e146608df68]
- RMP       [(Partial) Autocorrelation Function] [Partial autocorre...] [2012-11-21 15:49:05] [a641906195a0eb35087b0121beaccdc9] [Current]
Feedback Forum

Post a new message
Dataseries X:
37
30
47
35
30
43
82
40
47
19
52
136
80
42
54
66
81
63
137
72
107
58
36
52
79
77
54
84
48
96
83
66
61
53
30
74
69
59
42
65
70
100
63
105
82
81
75
102
121
98
76
77
63
37
35
23
40
29
37
51
20
28
13
22
25
13
16
13
16
17
9
17
25
14
8
7
10
7
10
3


Summary of computational transaction
Raw Inputview raw input (R code)
Raw Outputview raw output of R engine
Computing time2 seconds
R Server'Sir Maurice George Kendall' @ kendall.wessa.net

\begin{tabular}{lllllllll}
\hline
Summary of computational transaction \tabularnewline
Raw Input & view raw input (R code)  \tabularnewline
Raw Output & view raw output of R engine  \tabularnewline
Computing time & 2 seconds \tabularnewline
R Server & 'Sir Maurice George Kendall' @ kendall.wessa.net \tabularnewline
\hline
\end{tabular}
%Source: https://freestatistics.org/blog/index.php?pk=191454&T=0

[TABLE]
[ROW][C]Summary of computational transaction[/C][/ROW]
[ROW][C]Raw Input[/C][C]view raw input (R code) [/C][/ROW]
[ROW][C]Raw Output[/C][C]view raw output of R engine [/C][/ROW]
[ROW][C]Computing time[/C][C]2 seconds[/C][/ROW]
[ROW][C]R Server[/C][C]'Sir Maurice George Kendall' @ kendall.wessa.net[/C][/ROW]
[/TABLE]
Source: https://freestatistics.org/blog/index.php?pk=191454&T=0

Globally Unique Identifier (entire table): ba.freestatistics.org/blog/index.php?pk=191454&T=0

As an alternative you can also use a QR Code:  

The GUIDs for individual cells are displayed in the table below:

Summary of computational transaction
Raw Inputview raw input (R code)
Raw Outputview raw output of R engine
Computing time2 seconds
R Server'Sir Maurice George Kendall' @ kendall.wessa.net


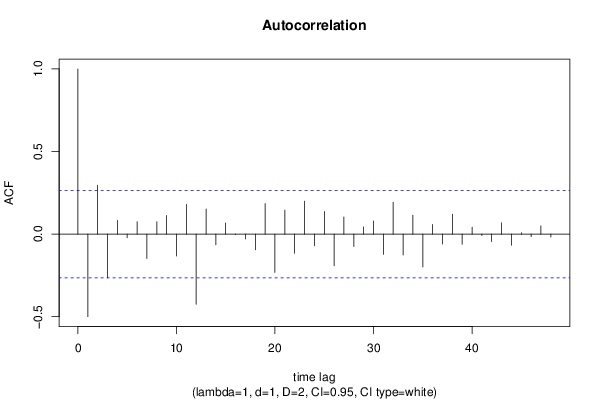
Autocorrelation Function
Time lag kACF(k)T-STATP-value
1-0.499656-3.70550.000246
20.2956782.19280.016285
3-0.264763-1.96350.027324
40.0826380.61290.271249
5-0.021712-0.1610.436335
60.0749720.5560.29023
7-0.147892-1.09680.138754
80.0754590.55960.289006
90.113290.84020.202222
10-0.132761-0.98460.164571
110.1796711.33250.094099
12-0.425017-3.1520.001312
130.1516821.12490.132758
14-0.064027-0.47480.318392
150.0678010.50280.308548
16-0.001858-0.01380.494528
17-0.028948-0.21470.415404
18-0.09464-0.70190.24286
190.1847181.36990.088142
20-0.231627-1.71780.04573
210.1454421.07860.14273
22-0.115964-0.860.196758
230.1996251.48050.072228
24-0.070172-0.52040.302433
250.1368421.01480.157311
26-0.191656-1.42140.080429
270.1034540.76720.223111
28-0.074892-0.55540.290432
290.0437240.32430.373484
300.0797630.59150.278292
31-0.122556-0.90890.183685
320.1927041.42910.079311
33-0.126517-0.93830.176103
340.1140980.84620.20056
35-0.198902-1.47510.072944
360.0580270.43030.334316
37-0.059345-0.44010.33079
380.1207260.89530.187256
39-0.061075-0.45290.326186
400.041440.30730.379876
41-0.008401-0.06230.475274
42-0.044658-0.33120.370878
430.0680590.50470.307879
44-0.067437-0.50010.309491
450.007890.05850.476775
46-0.015283-0.11330.455086
470.0502150.37240.355512
48-0.017018-0.12620.450015

\begin{tabular}{lllllllll}
\hline
Autocorrelation Function \tabularnewline
Time lag k & ACF(k) & T-STAT & P-value \tabularnewline
1 & -0.499656 & -3.7055 & 0.000246 \tabularnewline
2 & 0.295678 & 2.1928 & 0.016285 \tabularnewline
3 & -0.264763 & -1.9635 & 0.027324 \tabularnewline
4 & 0.082638 & 0.6129 & 0.271249 \tabularnewline
5 & -0.021712 & -0.161 & 0.436335 \tabularnewline
6 & 0.074972 & 0.556 & 0.29023 \tabularnewline
7 & -0.147892 & -1.0968 & 0.138754 \tabularnewline
8 & 0.075459 & 0.5596 & 0.289006 \tabularnewline
9 & 0.11329 & 0.8402 & 0.202222 \tabularnewline
10 & -0.132761 & -0.9846 & 0.164571 \tabularnewline
11 & 0.179671 & 1.3325 & 0.094099 \tabularnewline
12 & -0.425017 & -3.152 & 0.001312 \tabularnewline
13 & 0.151682 & 1.1249 & 0.132758 \tabularnewline
14 & -0.064027 & -0.4748 & 0.318392 \tabularnewline
15 & 0.067801 & 0.5028 & 0.308548 \tabularnewline
16 & -0.001858 & -0.0138 & 0.494528 \tabularnewline
17 & -0.028948 & -0.2147 & 0.415404 \tabularnewline
18 & -0.09464 & -0.7019 & 0.24286 \tabularnewline
19 & 0.184718 & 1.3699 & 0.088142 \tabularnewline
20 & -0.231627 & -1.7178 & 0.04573 \tabularnewline
21 & 0.145442 & 1.0786 & 0.14273 \tabularnewline
22 & -0.115964 & -0.86 & 0.196758 \tabularnewline
23 & 0.199625 & 1.4805 & 0.072228 \tabularnewline
24 & -0.070172 & -0.5204 & 0.302433 \tabularnewline
25 & 0.136842 & 1.0148 & 0.157311 \tabularnewline
26 & -0.191656 & -1.4214 & 0.080429 \tabularnewline
27 & 0.103454 & 0.7672 & 0.223111 \tabularnewline
28 & -0.074892 & -0.5554 & 0.290432 \tabularnewline
29 & 0.043724 & 0.3243 & 0.373484 \tabularnewline
30 & 0.079763 & 0.5915 & 0.278292 \tabularnewline
31 & -0.122556 & -0.9089 & 0.183685 \tabularnewline
32 & 0.192704 & 1.4291 & 0.079311 \tabularnewline
33 & -0.126517 & -0.9383 & 0.176103 \tabularnewline
34 & 0.114098 & 0.8462 & 0.20056 \tabularnewline
35 & -0.198902 & -1.4751 & 0.072944 \tabularnewline
36 & 0.058027 & 0.4303 & 0.334316 \tabularnewline
37 & -0.059345 & -0.4401 & 0.33079 \tabularnewline
38 & 0.120726 & 0.8953 & 0.187256 \tabularnewline
39 & -0.061075 & -0.4529 & 0.326186 \tabularnewline
40 & 0.04144 & 0.3073 & 0.379876 \tabularnewline
41 & -0.008401 & -0.0623 & 0.475274 \tabularnewline
42 & -0.044658 & -0.3312 & 0.370878 \tabularnewline
43 & 0.068059 & 0.5047 & 0.307879 \tabularnewline
44 & -0.067437 & -0.5001 & 0.309491 \tabularnewline
45 & 0.00789 & 0.0585 & 0.476775 \tabularnewline
46 & -0.015283 & -0.1133 & 0.455086 \tabularnewline
47 & 0.050215 & 0.3724 & 0.355512 \tabularnewline
48 & -0.017018 & -0.1262 & 0.450015 \tabularnewline
\hline
\end{tabular}
%Source: https://freestatistics.org/blog/index.php?pk=191454&T=1

[TABLE]
[ROW][C]Autocorrelation Function[/C][/ROW]
[ROW][C]Time lag k[/C][C]ACF(k)[/C][C]T-STAT[/C][C]P-value[/C][/ROW]
[ROW][C]1[/C][C]-0.499656[/C][C]-3.7055[/C][C]0.000246[/C][/ROW]
[ROW][C]2[/C][C]0.295678[/C][C]2.1928[/C][C]0.016285[/C][/ROW]
[ROW][C]3[/C][C]-0.264763[/C][C]-1.9635[/C][C]0.027324[/C][/ROW]
[ROW][C]4[/C][C]0.082638[/C][C]0.6129[/C][C]0.271249[/C][/ROW]
[ROW][C]5[/C][C]-0.021712[/C][C]-0.161[/C][C]0.436335[/C][/ROW]
[ROW][C]6[/C][C]0.074972[/C][C]0.556[/C][C]0.29023[/C][/ROW]
[ROW][C]7[/C][C]-0.147892[/C][C]-1.0968[/C][C]0.138754[/C][/ROW]
[ROW][C]8[/C][C]0.075459[/C][C]0.5596[/C][C]0.289006[/C][/ROW]
[ROW][C]9[/C][C]0.11329[/C][C]0.8402[/C][C]0.202222[/C][/ROW]
[ROW][C]10[/C][C]-0.132761[/C][C]-0.9846[/C][C]0.164571[/C][/ROW]
[ROW][C]11[/C][C]0.179671[/C][C]1.3325[/C][C]0.094099[/C][/ROW]
[ROW][C]12[/C][C]-0.425017[/C][C]-3.152[/C][C]0.001312[/C][/ROW]
[ROW][C]13[/C][C]0.151682[/C][C]1.1249[/C][C]0.132758[/C][/ROW]
[ROW][C]14[/C][C]-0.064027[/C][C]-0.4748[/C][C]0.318392[/C][/ROW]
[ROW][C]15[/C][C]0.067801[/C][C]0.5028[/C][C]0.308548[/C][/ROW]
[ROW][C]16[/C][C]-0.001858[/C][C]-0.0138[/C][C]0.494528[/C][/ROW]
[ROW][C]17[/C][C]-0.028948[/C][C]-0.2147[/C][C]0.415404[/C][/ROW]
[ROW][C]18[/C][C]-0.09464[/C][C]-0.7019[/C][C]0.24286[/C][/ROW]
[ROW][C]19[/C][C]0.184718[/C][C]1.3699[/C][C]0.088142[/C][/ROW]
[ROW][C]20[/C][C]-0.231627[/C][C]-1.7178[/C][C]0.04573[/C][/ROW]
[ROW][C]21[/C][C]0.145442[/C][C]1.0786[/C][C]0.14273[/C][/ROW]
[ROW][C]22[/C][C]-0.115964[/C][C]-0.86[/C][C]0.196758[/C][/ROW]
[ROW][C]23[/C][C]0.199625[/C][C]1.4805[/C][C]0.072228[/C][/ROW]
[ROW][C]24[/C][C]-0.070172[/C][C]-0.5204[/C][C]0.302433[/C][/ROW]
[ROW][C]25[/C][C]0.136842[/C][C]1.0148[/C][C]0.157311[/C][/ROW]
[ROW][C]26[/C][C]-0.191656[/C][C]-1.4214[/C][C]0.080429[/C][/ROW]
[ROW][C]27[/C][C]0.103454[/C][C]0.7672[/C][C]0.223111[/C][/ROW]
[ROW][C]28[/C][C]-0.074892[/C][C]-0.5554[/C][C]0.290432[/C][/ROW]
[ROW][C]29[/C][C]0.043724[/C][C]0.3243[/C][C]0.373484[/C][/ROW]
[ROW][C]30[/C][C]0.079763[/C][C]0.5915[/C][C]0.278292[/C][/ROW]
[ROW][C]31[/C][C]-0.122556[/C][C]-0.9089[/C][C]0.183685[/C][/ROW]
[ROW][C]32[/C][C]0.192704[/C][C]1.4291[/C][C]0.079311[/C][/ROW]
[ROW][C]33[/C][C]-0.126517[/C][C]-0.9383[/C][C]0.176103[/C][/ROW]
[ROW][C]34[/C][C]0.114098[/C][C]0.8462[/C][C]0.20056[/C][/ROW]
[ROW][C]35[/C][C]-0.198902[/C][C]-1.4751[/C][C]0.072944[/C][/ROW]
[ROW][C]36[/C][C]0.058027[/C][C]0.4303[/C][C]0.334316[/C][/ROW]
[ROW][C]37[/C][C]-0.059345[/C][C]-0.4401[/C][C]0.33079[/C][/ROW]
[ROW][C]38[/C][C]0.120726[/C][C]0.8953[/C][C]0.187256[/C][/ROW]
[ROW][C]39[/C][C]-0.061075[/C][C]-0.4529[/C][C]0.326186[/C][/ROW]
[ROW][C]40[/C][C]0.04144[/C][C]0.3073[/C][C]0.379876[/C][/ROW]
[ROW][C]41[/C][C]-0.008401[/C][C]-0.0623[/C][C]0.475274[/C][/ROW]
[ROW][C]42[/C][C]-0.044658[/C][C]-0.3312[/C][C]0.370878[/C][/ROW]
[ROW][C]43[/C][C]0.068059[/C][C]0.5047[/C][C]0.307879[/C][/ROW]
[ROW][C]44[/C][C]-0.067437[/C][C]-0.5001[/C][C]0.309491[/C][/ROW]
[ROW][C]45[/C][C]0.00789[/C][C]0.0585[/C][C]0.476775[/C][/ROW]
[ROW][C]46[/C][C]-0.015283[/C][C]-0.1133[/C][C]0.455086[/C][/ROW]
[ROW][C]47[/C][C]0.050215[/C][C]0.3724[/C][C]0.355512[/C][/ROW]
[ROW][C]48[/C][C]-0.017018[/C][C]-0.1262[/C][C]0.450015[/C][/ROW]
[/TABLE]
Source: https://freestatistics.org/blog/index.php?pk=191454&T=1

Globally Unique Identifier (entire table): ba.freestatistics.org/blog/index.php?pk=191454&T=1

As an alternative you can also use a QR Code:  

The GUIDs for individual cells are displayed in the table below:

Autocorrelation Function
Time lag kACF(k)T-STATP-value
1-0.499656-3.70550.000246
20.2956782.19280.016285
3-0.264763-1.96350.027324
40.0826380.61290.271249
5-0.021712-0.1610.436335
60.0749720.5560.29023
7-0.147892-1.09680.138754
80.0754590.55960.289006
90.113290.84020.202222
10-0.132761-0.98460.164571
110.1796711.33250.094099
12-0.425017-3.1520.001312
130.1516821.12490.132758
14-0.064027-0.47480.318392
150.0678010.50280.308548
16-0.001858-0.01380.494528
17-0.028948-0.21470.415404
18-0.09464-0.70190.24286
190.1847181.36990.088142
20-0.231627-1.71780.04573
210.1454421.07860.14273
22-0.115964-0.860.196758
230.1996251.48050.072228
24-0.070172-0.52040.302433
250.1368421.01480.157311
26-0.191656-1.42140.080429
270.1034540.76720.223111
28-0.074892-0.55540.290432
290.0437240.32430.373484
300.0797630.59150.278292
31-0.122556-0.90890.183685
320.1927041.42910.079311
33-0.126517-0.93830.176103
340.1140980.84620.20056
35-0.198902-1.47510.072944
360.0580270.43030.334316
37-0.059345-0.44010.33079
380.1207260.89530.187256
39-0.061075-0.45290.326186
400.041440.30730.379876
41-0.008401-0.06230.475274
42-0.044658-0.33120.370878
430.0680590.50470.307879
44-0.067437-0.50010.309491
450.007890.05850.476775
46-0.015283-0.11330.455086
470.0502150.37240.355512
48-0.017018-0.12620.450015


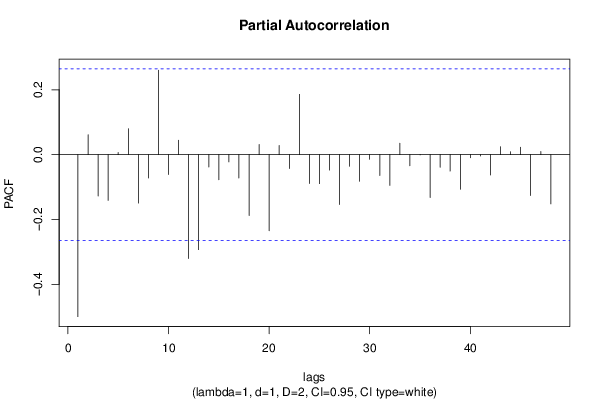
Partial Autocorrelation Function
Time lag kPACF(k)T-STATP-value
1-0.499656-3.70550.000246
20.0613340.45490.325498
3-0.127678-0.94690.17392
4-0.141011-1.04580.150123
50.0067270.04990.480195
60.0796770.59090.278504
7-0.149456-1.10840.136257
8-0.072121-0.53490.29745
90.2601541.92940.029426
10-0.061461-0.45580.325162
110.0443630.3290.371702
12-0.320161-2.37440.010548
13-0.292914-2.17230.01708
14-0.037925-0.28130.389784
15-0.077412-0.57410.284118
16-0.022414-0.16620.434295
17-0.072285-0.53610.297033
18-0.187774-1.39260.084677
190.0313460.23250.408518
20-0.234955-1.74250.043507
210.0282470.20950.417423
22-0.042984-0.31880.375552
230.1859841.37930.086693
24-0.089099-0.66080.255756
25-0.089501-0.66380.25481
26-0.047692-0.35370.362461
27-0.15374-1.14020.129579
28-0.035921-0.26640.395464
29-0.082057-0.60850.272665
30-0.014433-0.1070.457574
31-0.064443-0.47790.317299
32-0.094899-0.70380.242266
330.035180.26090.397572
34-0.034041-0.25250.400816
35-0.000802-0.00590.497637
36-0.132087-0.97960.165791
37-0.038875-0.28830.387099
38-0.050765-0.37650.354003
39-0.106611-0.79060.216274
40-0.009533-0.07070.471946
41-0.00415-0.03080.487778
42-0.062575-0.46410.322216
430.0246090.18250.427928
440.009150.06790.473074
450.0228290.16930.433088
46-0.125894-0.93370.177281
470.0096010.07120.471747
48-0.151981-1.12710.132293

\begin{tabular}{lllllllll}
\hline
Partial Autocorrelation Function \tabularnewline
Time lag k & PACF(k) & T-STAT & P-value \tabularnewline
1 & -0.499656 & -3.7055 & 0.000246 \tabularnewline
2 & 0.061334 & 0.4549 & 0.325498 \tabularnewline
3 & -0.127678 & -0.9469 & 0.17392 \tabularnewline
4 & -0.141011 & -1.0458 & 0.150123 \tabularnewline
5 & 0.006727 & 0.0499 & 0.480195 \tabularnewline
6 & 0.079677 & 0.5909 & 0.278504 \tabularnewline
7 & -0.149456 & -1.1084 & 0.136257 \tabularnewline
8 & -0.072121 & -0.5349 & 0.29745 \tabularnewline
9 & 0.260154 & 1.9294 & 0.029426 \tabularnewline
10 & -0.061461 & -0.4558 & 0.325162 \tabularnewline
11 & 0.044363 & 0.329 & 0.371702 \tabularnewline
12 & -0.320161 & -2.3744 & 0.010548 \tabularnewline
13 & -0.292914 & -2.1723 & 0.01708 \tabularnewline
14 & -0.037925 & -0.2813 & 0.389784 \tabularnewline
15 & -0.077412 & -0.5741 & 0.284118 \tabularnewline
16 & -0.022414 & -0.1662 & 0.434295 \tabularnewline
17 & -0.072285 & -0.5361 & 0.297033 \tabularnewline
18 & -0.187774 & -1.3926 & 0.084677 \tabularnewline
19 & 0.031346 & 0.2325 & 0.408518 \tabularnewline
20 & -0.234955 & -1.7425 & 0.043507 \tabularnewline
21 & 0.028247 & 0.2095 & 0.417423 \tabularnewline
22 & -0.042984 & -0.3188 & 0.375552 \tabularnewline
23 & 0.185984 & 1.3793 & 0.086693 \tabularnewline
24 & -0.089099 & -0.6608 & 0.255756 \tabularnewline
25 & -0.089501 & -0.6638 & 0.25481 \tabularnewline
26 & -0.047692 & -0.3537 & 0.362461 \tabularnewline
27 & -0.15374 & -1.1402 & 0.129579 \tabularnewline
28 & -0.035921 & -0.2664 & 0.395464 \tabularnewline
29 & -0.082057 & -0.6085 & 0.272665 \tabularnewline
30 & -0.014433 & -0.107 & 0.457574 \tabularnewline
31 & -0.064443 & -0.4779 & 0.317299 \tabularnewline
32 & -0.094899 & -0.7038 & 0.242266 \tabularnewline
33 & 0.03518 & 0.2609 & 0.397572 \tabularnewline
34 & -0.034041 & -0.2525 & 0.400816 \tabularnewline
35 & -0.000802 & -0.0059 & 0.497637 \tabularnewline
36 & -0.132087 & -0.9796 & 0.165791 \tabularnewline
37 & -0.038875 & -0.2883 & 0.387099 \tabularnewline
38 & -0.050765 & -0.3765 & 0.354003 \tabularnewline
39 & -0.106611 & -0.7906 & 0.216274 \tabularnewline
40 & -0.009533 & -0.0707 & 0.471946 \tabularnewline
41 & -0.00415 & -0.0308 & 0.487778 \tabularnewline
42 & -0.062575 & -0.4641 & 0.322216 \tabularnewline
43 & 0.024609 & 0.1825 & 0.427928 \tabularnewline
44 & 0.00915 & 0.0679 & 0.473074 \tabularnewline
45 & 0.022829 & 0.1693 & 0.433088 \tabularnewline
46 & -0.125894 & -0.9337 & 0.177281 \tabularnewline
47 & 0.009601 & 0.0712 & 0.471747 \tabularnewline
48 & -0.151981 & -1.1271 & 0.132293 \tabularnewline
\hline
\end{tabular}
%Source: https://freestatistics.org/blog/index.php?pk=191454&T=2

[TABLE]
[ROW][C]Partial Autocorrelation Function[/C][/ROW]
[ROW][C]Time lag k[/C][C]PACF(k)[/C][C]T-STAT[/C][C]P-value[/C][/ROW]
[ROW][C]1[/C][C]-0.499656[/C][C]-3.7055[/C][C]0.000246[/C][/ROW]
[ROW][C]2[/C][C]0.061334[/C][C]0.4549[/C][C]0.325498[/C][/ROW]
[ROW][C]3[/C][C]-0.127678[/C][C]-0.9469[/C][C]0.17392[/C][/ROW]
[ROW][C]4[/C][C]-0.141011[/C][C]-1.0458[/C][C]0.150123[/C][/ROW]
[ROW][C]5[/C][C]0.006727[/C][C]0.0499[/C][C]0.480195[/C][/ROW]
[ROW][C]6[/C][C]0.079677[/C][C]0.5909[/C][C]0.278504[/C][/ROW]
[ROW][C]7[/C][C]-0.149456[/C][C]-1.1084[/C][C]0.136257[/C][/ROW]
[ROW][C]8[/C][C]-0.072121[/C][C]-0.5349[/C][C]0.29745[/C][/ROW]
[ROW][C]9[/C][C]0.260154[/C][C]1.9294[/C][C]0.029426[/C][/ROW]
[ROW][C]10[/C][C]-0.061461[/C][C]-0.4558[/C][C]0.325162[/C][/ROW]
[ROW][C]11[/C][C]0.044363[/C][C]0.329[/C][C]0.371702[/C][/ROW]
[ROW][C]12[/C][C]-0.320161[/C][C]-2.3744[/C][C]0.010548[/C][/ROW]
[ROW][C]13[/C][C]-0.292914[/C][C]-2.1723[/C][C]0.01708[/C][/ROW]
[ROW][C]14[/C][C]-0.037925[/C][C]-0.2813[/C][C]0.389784[/C][/ROW]
[ROW][C]15[/C][C]-0.077412[/C][C]-0.5741[/C][C]0.284118[/C][/ROW]
[ROW][C]16[/C][C]-0.022414[/C][C]-0.1662[/C][C]0.434295[/C][/ROW]
[ROW][C]17[/C][C]-0.072285[/C][C]-0.5361[/C][C]0.297033[/C][/ROW]
[ROW][C]18[/C][C]-0.187774[/C][C]-1.3926[/C][C]0.084677[/C][/ROW]
[ROW][C]19[/C][C]0.031346[/C][C]0.2325[/C][C]0.408518[/C][/ROW]
[ROW][C]20[/C][C]-0.234955[/C][C]-1.7425[/C][C]0.043507[/C][/ROW]
[ROW][C]21[/C][C]0.028247[/C][C]0.2095[/C][C]0.417423[/C][/ROW]
[ROW][C]22[/C][C]-0.042984[/C][C]-0.3188[/C][C]0.375552[/C][/ROW]
[ROW][C]23[/C][C]0.185984[/C][C]1.3793[/C][C]0.086693[/C][/ROW]
[ROW][C]24[/C][C]-0.089099[/C][C]-0.6608[/C][C]0.255756[/C][/ROW]
[ROW][C]25[/C][C]-0.089501[/C][C]-0.6638[/C][C]0.25481[/C][/ROW]
[ROW][C]26[/C][C]-0.047692[/C][C]-0.3537[/C][C]0.362461[/C][/ROW]
[ROW][C]27[/C][C]-0.15374[/C][C]-1.1402[/C][C]0.129579[/C][/ROW]
[ROW][C]28[/C][C]-0.035921[/C][C]-0.2664[/C][C]0.395464[/C][/ROW]
[ROW][C]29[/C][C]-0.082057[/C][C]-0.6085[/C][C]0.272665[/C][/ROW]
[ROW][C]30[/C][C]-0.014433[/C][C]-0.107[/C][C]0.457574[/C][/ROW]
[ROW][C]31[/C][C]-0.064443[/C][C]-0.4779[/C][C]0.317299[/C][/ROW]
[ROW][C]32[/C][C]-0.094899[/C][C]-0.7038[/C][C]0.242266[/C][/ROW]
[ROW][C]33[/C][C]0.03518[/C][C]0.2609[/C][C]0.397572[/C][/ROW]
[ROW][C]34[/C][C]-0.034041[/C][C]-0.2525[/C][C]0.400816[/C][/ROW]
[ROW][C]35[/C][C]-0.000802[/C][C]-0.0059[/C][C]0.497637[/C][/ROW]
[ROW][C]36[/C][C]-0.132087[/C][C]-0.9796[/C][C]0.165791[/C][/ROW]
[ROW][C]37[/C][C]-0.038875[/C][C]-0.2883[/C][C]0.387099[/C][/ROW]
[ROW][C]38[/C][C]-0.050765[/C][C]-0.3765[/C][C]0.354003[/C][/ROW]
[ROW][C]39[/C][C]-0.106611[/C][C]-0.7906[/C][C]0.216274[/C][/ROW]
[ROW][C]40[/C][C]-0.009533[/C][C]-0.0707[/C][C]0.471946[/C][/ROW]
[ROW][C]41[/C][C]-0.00415[/C][C]-0.0308[/C][C]0.487778[/C][/ROW]
[ROW][C]42[/C][C]-0.062575[/C][C]-0.4641[/C][C]0.322216[/C][/ROW]
[ROW][C]43[/C][C]0.024609[/C][C]0.1825[/C][C]0.427928[/C][/ROW]
[ROW][C]44[/C][C]0.00915[/C][C]0.0679[/C][C]0.473074[/C][/ROW]
[ROW][C]45[/C][C]0.022829[/C][C]0.1693[/C][C]0.433088[/C][/ROW]
[ROW][C]46[/C][C]-0.125894[/C][C]-0.9337[/C][C]0.177281[/C][/ROW]
[ROW][C]47[/C][C]0.009601[/C][C]0.0712[/C][C]0.471747[/C][/ROW]
[ROW][C]48[/C][C]-0.151981[/C][C]-1.1271[/C][C]0.132293[/C][/ROW]
[/TABLE]
Source: https://freestatistics.org/blog/index.php?pk=191454&T=2

Globally Unique Identifier (entire table): ba.freestatistics.org/blog/index.php?pk=191454&T=2

As an alternative you can also use a QR Code:  

The GUIDs for individual cells are displayed in the table below:

Partial Autocorrelation Function
Time lag kPACF(k)T-STATP-value
1-0.499656-3.70550.000246
20.0613340.45490.325498
3-0.127678-0.94690.17392
4-0.141011-1.04580.150123
50.0067270.04990.480195
60.0796770.59090.278504
7-0.149456-1.10840.136257
8-0.072121-0.53490.29745
90.2601541.92940.029426
10-0.061461-0.45580.325162
110.0443630.3290.371702
12-0.320161-2.37440.010548
13-0.292914-2.17230.01708
14-0.037925-0.28130.389784
15-0.077412-0.57410.284118
16-0.022414-0.16620.434295
17-0.072285-0.53610.297033
18-0.187774-1.39260.084677
190.0313460.23250.408518
20-0.234955-1.74250.043507
210.0282470.20950.417423
22-0.042984-0.31880.375552
230.1859841.37930.086693
24-0.089099-0.66080.255756
25-0.089501-0.66380.25481
26-0.047692-0.35370.362461
27-0.15374-1.14020.129579
28-0.035921-0.26640.395464
29-0.082057-0.60850.272665
30-0.014433-0.1070.457574
31-0.064443-0.47790.317299
32-0.094899-0.70380.242266
330.035180.26090.397572
34-0.034041-0.25250.400816
35-0.000802-0.00590.497637
36-0.132087-0.97960.165791
37-0.038875-0.28830.387099
38-0.050765-0.37650.354003
39-0.106611-0.79060.216274
40-0.009533-0.07070.471946
41-0.00415-0.03080.487778
42-0.062575-0.46410.322216
430.0246090.18250.427928
440.009150.06790.473074
450.0228290.16930.433088
46-0.125894-0.93370.177281
470.0096010.07120.471747
48-0.151981-1.12710.132293


Parameters (Session):
par1 = 48 ; par2 = 1 ; par3 = 1 ; par4 = 2 ; par5 = 12 ; par6 = White Noise ; par7 = 0.95 ;
Parameters (R input):
par1 = 48 ; par2 = 1 ; par3 = 1 ; par4 = 2 ; par5 = 12 ; par6 = White Noise ; par7 = 0.95 ; par8 = ;
R code (references can be found in the software module):
par8 <- ''
par7 <- '0.95'
par6 <- 'White Noise'
par5 <- '12'
par4 <- '1'
par3 <- '1'
par2 <- '1'
par1 <- '48'
if (par1 == 'Default') {
par1 = 10*log10(length(x))
} else {
par1 <- as.numeric(par1)
}
par2 <- as.numeric(par2)
par3 <- as.numeric(par3)
par4 <- as.numeric(par4)
par5 <- as.numeric(par5)
if (par6 == 'White Noise') par6 <- 'white' else par6 <- 'ma'
par7 <- as.numeric(par7)
if (par8 != '') par8 <- as.numeric(par8)
ox <- x
if (par8 == '') {
if (par2 == 0) {
x <- log(x)
} else {
x <- (x ^ par2 - 1) / par2
}
} else {
x <- log(x,base=par8)
}
if (par3 > 0) x <- diff(x,lag=1,difference=par3)
if (par4 > 0) x <- diff(x,lag=par5,difference=par4)
bitmap(file='picts.png')
op <- par(mfrow=c(2,1))
plot(ox,type='l',main='Original Time Series',xlab='time',ylab='value')
if (par8=='') {
mytitle <- paste('Working Time Series (lambda=',par2,', d=',par3,', D=',par4,')',sep='')
mysub <- paste('(lambda=',par2,', d=',par3,', D=',par4,', CI=', par7, ', CI type=',par6,')',sep='')
} else {
mytitle <- paste('Working Time Series (base=',par8,', d=',par3,', D=',par4,')',sep='')
mysub <- paste('(base=',par8,', d=',par3,', D=',par4,', CI=', par7, ', CI type=',par6,')',sep='')
}
plot(x,type='l', main=mytitle,xlab='time',ylab='value')
par(op)
dev.off()
bitmap(file='pic1.png')
racf <- acf(x, par1, main='Autocorrelation', xlab='time lag', ylab='ACF', ci.type=par6, ci=par7, sub=mysub)
dev.off()
bitmap(file='pic2.png')
rpacf <- pacf(x,par1,main='Partial Autocorrelation',xlab='lags',ylab='PACF',sub=mysub)
dev.off()
(myacf <- c(racf$acf))
(mypacf <- c(rpacf$acf))
lengthx <- length(x)
sqrtn <- sqrt(lengthx)
load(file='createtable')
a<-table.start()
a<-table.row.start(a)
a<-table.element(a,'Autocorrelation Function',4,TRUE)
a<-table.row.end(a)
a<-table.row.start(a)
a<-table.element(a,'Time lag k',header=TRUE)
a<-table.element(a,hyperlink('basics.htm','ACF(k)','click here for more information about the Autocorrelation Function'),header=TRUE)
a<-table.element(a,'T-STAT',header=TRUE)
a<-table.element(a,'P-value',header=TRUE)
a<-table.row.end(a)
for (i in 2:(par1+1)) {
a<-table.row.start(a)
a<-table.element(a,i-1,header=TRUE)
a<-table.element(a,round(myacf[i],6))
mytstat <- myacf[i]*sqrtn
a<-table.element(a,round(mytstat,4))
a<-table.element(a,round(1-pt(abs(mytstat),lengthx),6))
a<-table.row.end(a)
}
a<-table.end(a)
table.save(a,file='mytable.tab')
a<-table.start()
a<-table.row.start(a)
a<-table.element(a,'Partial Autocorrelation Function',4,TRUE)
a<-table.row.end(a)
a<-table.row.start(a)
a<-table.element(a,'Time lag k',header=TRUE)
a<-table.element(a,hyperlink('basics.htm','PACF(k)','click here for more information about the Partial Autocorrelation Function'),header=TRUE)
a<-table.element(a,'T-STAT',header=TRUE)
a<-table.element(a,'P-value',header=TRUE)
a<-table.row.end(a)
for (i in 1:par1) {
a<-table.row.start(a)
a<-table.element(a,i,header=TRUE)
a<-table.element(a,round(mypacf[i],6))
mytstat <- mypacf[i]*sqrtn
a<-table.element(a,round(mytstat,4))
a<-table.element(a,round(1-pt(abs(mytstat),lengthx),6))
a<-table.row.end(a)
}
a<-table.end(a)
table.save(a,file='mytable1.tab')