| Multiple Linear Regression - Estimated Regression Equation |
| Rosbief[t] = + 1.65421026416221 + 0.0441979509492718Biefstuk[t] + 0.186824604055072Karbonade[t] + 0.431295613955826Dunne_lende[t] -0.0485017179864389Kalfsgebraad[t] + 0.281637082983278Varkensrib_filet[t] + 0.442056161899891Varkensrib_spiering[t] + 0.115673480573002Varkensgebraad_van_de_hesp[t] + 0.0449679045972637Lamsbout[t] -0.284802579191879Braadkip[t] + 0.0340920651916182Kalkoenborstfilet[t] + 0.0724445754418788Konijn[t] + e[t] |
| Multiple Linear Regression - Ordinary Least Squares | |||||
| Variable | Parameter | S.D. | T-STAT H0: parameter = 0 | 2-tail p-value | 1-tail p-value |
| (Intercept) | 1.65421026416221 | 0.904542 | 1.8288 | 0.071883 | 0.035942 |
| Biefstuk | 0.0441979509492718 | 0.124284 | 0.3556 | 0.723243 | 0.361621 |
| Karbonade | 0.186824604055072 | 0.124475 | 1.5009 | 0.13808 | 0.06904 |
| Dunne_lende | 0.431295613955826 | 0.098761 | 4.3671 | 4.5e-05 | 2.2e-05 |
| Kalfsgebraad | -0.0485017179864389 | 0.06154 | -0.7881 | 0.433397 | 0.216698 |
| Varkensrib_filet | 0.281637082983278 | 0.166007 | 1.6965 | 0.094426 | 0.047213 |
| Varkensrib_spiering | 0.442056161899891 | 0.196544 | 2.2491 | 0.027795 | 0.013897 |
| Varkensgebraad_van_de_hesp | 0.115673480573002 | 0.152355 | 0.7592 | 0.450374 | 0.225187 |
| Lamsbout | 0.0449679045972637 | 0.043649 | 1.0302 | 0.306609 | 0.153304 |
| Braadkip | -0.284802579191879 | 0.238233 | -1.1955 | 0.236114 | 0.118057 |
| Kalkoenborstfilet | 0.0340920651916182 | 0.060561 | 0.5629 | 0.575359 | 0.28768 |
| Konijn | 0.0724445754418788 | 0.053582 | 1.352 | 0.18091 | 0.090455 |
| Multiple Linear Regression - Regression Statistics | |
| Multiple R | 0.982728064911628 |
| R-squared | 0.965754449564953 |
| Adjusted R-squared | 0.960132045762184 |
| F-TEST (value) | 171.768959228675 |
| F-TEST (DF numerator) | 11 |
| F-TEST (DF denominator) | 67 |
| p-value | 0 |
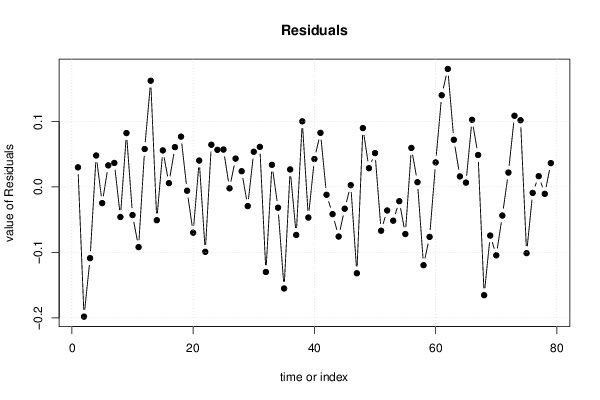
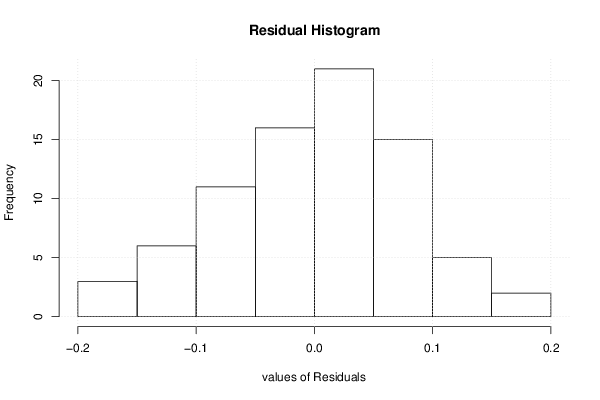
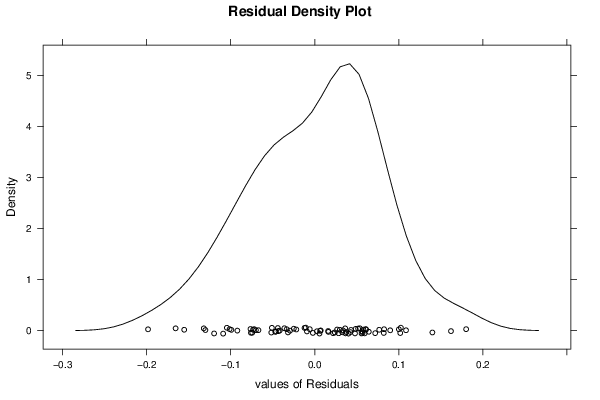
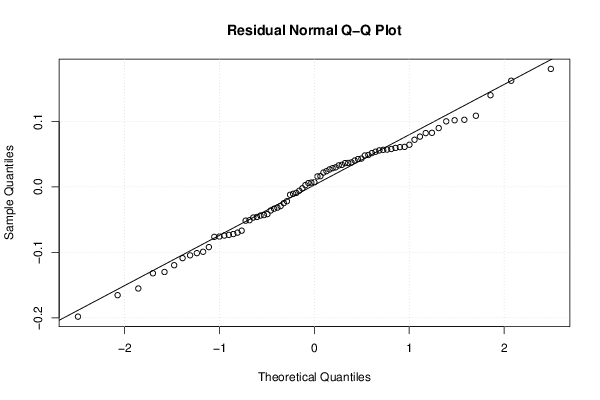
| Multiple Linear Regression - Residual Statistics | |
| Residual Standard Deviation | 0.0825130982853167 |
| Sum Squared Residuals | 0.456163563039036 |
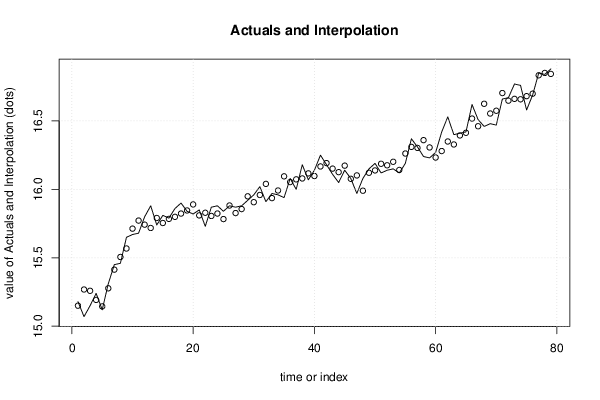
| Multiple Linear Regression - Actuals, Interpolation, and Residuals | |||
| Time or Index | Actuals | Interpolation Forecast | Residuals Prediction Error |
| 1 | 15.18 | 15.1502039888724 | 0.0297960111276345 |
| 2 | 15.07 | 15.2682817888709 | -0.198281788870867 |
| 3 | 15.15 | 15.258926819857 | -0.108926819857024 |
| 4 | 15.24 | 15.1921251078289 | 0.0478748921711003 |
| 5 | 15.12 | 15.1448794320906 | -0.0248794320906131 |
| 6 | 15.31 | 15.2772356918185 | 0.0327643081814616 |
| 7 | 15.45 | 15.4135219264369 | 0.0364780735630707 |
| 8 | 15.46 | 15.5060617913165 | -0.0460617913164982 |
| 9 | 15.65 | 15.5679138836118 | 0.082086116388167 |
| 10 | 15.67 | 15.7131244026997 | -0.0431244026997053 |
| 11 | 15.68 | 15.7720684043929 | -0.0920684043928525 |
| 12 | 15.8 | 15.7422156670378 | 0.0577843329621797 |
| 13 | 15.88 | 15.7179612919119 | 0.162038708088106 |
| 14 | 15.74 | 15.7909874778847 | -0.0509874778846776 |
| 15 | 15.81 | 15.7543491773216 | 0.0556508226783915 |
| 16 | 15.79 | 15.7843460413699 | 0.00565395863014827 |
| 17 | 15.86 | 15.7993331898083 | 0.0606668101917445 |
| 18 | 15.9 | 15.8232986326314 | 0.0767013673686361 |
| 19 | 15.84 | 15.8459340246476 | -0.00593402464759162 |
| 20 | 15.82 | 15.8899899138965 | -0.069989913896477 |
| 21 | 15.85 | 15.8098483878634 | 0.0401516121365588 |
| 22 | 15.73 | 15.8292089132826 | -0.099208913282615 |
| 23 | 15.87 | 15.8057118621104 | 0.0642881378896326 |
| 24 | 15.88 | 15.8234445173665 | 0.0565554826334835 |
| 25 | 15.84 | 15.7830580554857 | 0.056941944514303 |
| 26 | 15.88 | 15.8822156632789 | -0.00221566327887666 |
| 27 | 15.87 | 15.826878297482 | 0.0431217025179639 |
| 28 | 15.88 | 15.856143918092 | 0.0238560819080283 |
| 29 | 15.92 | 15.9494206995048 | -0.029420699504775 |
| 30 | 15.96 | 15.9064083616638 | 0.0535916383362424 |
| 31 | 16.02 | 15.9589682496217 | 0.0610317503782781 |
| 32 | 15.91 | 16.0400533450611 | -0.13005334506115 |
| 33 | 15.97 | 15.9363643455104 | 0.033635654489611 |
| 34 | 15.96 | 15.9918541466908 | -0.0318541466907785 |
| 35 | 15.94 | 16.0952559901106 | -0.155255990110619 |
| 36 | 16.08 | 16.0534425407771 | 0.0265574592228523 |
| 37 | 16 | 16.0734615029764 | -0.0734615029764119 |
| 38 | 16.18 | 16.0799420694457 | 0.100057930554308 |
| 39 | 16.07 | 16.1169297056139 | -0.0469297056138751 |
| 40 | 16.14 | 16.0975194562561 | 0.0424805437439379 |
| 41 | 16.25 | 16.1675220772445 | 0.0824779227554537 |
| 42 | 16.18 | 16.1921290547864 | -0.0121290547864319 |
| 43 | 16.11 | 16.1516814723286 | -0.0416814723286273 |
| 44 | 16.05 | 16.1259247878317 | -0.0759247878317442 |
| 45 | 16.14 | 16.1734039050856 | -0.033403905085633 |
| 46 | 16.08 | 16.0773943509131 | 0.00260564908690524 |
| 47 | 15.97 | 16.1020080828963 | -0.132008082896275 |
| 48 | 16.08 | 15.990243027481 | 0.0897569725189857 |
| 49 | 16.15 | 16.1215223784305 | 0.0284776215695212 |
| 50 | 16.19 | 16.1384360937286 | 0.05156390627141 |
| 51 | 16.12 | 16.1869928792697 | -0.0669928792696798 |
| 52 | 16.14 | 16.1761151351807 | -0.0361151351806627 |
| 53 | 16.15 | 16.2016933061202 | -0.0516933061201969 |
| 54 | 16.12 | 16.1419551836993 | -0.0219551836993063 |
| 55 | 16.19 | 16.262118670195 | -0.0721186701950452 |
| 56 | 16.37 | 16.3105747450177 | 0.0594252549823207 |
| 57 | 16.31 | 16.3029281812752 | 0.00707181872482191 |
| 58 | 16.24 | 16.3597121737641 | -0.119712173764142 |
| 59 | 16.23 | 16.3064013441468 | -0.0764013441467623 |
| 60 | 16.27 | 16.2326975491231 | 0.0373024508768962 |
| 61 | 16.42 | 16.2800910112939 | 0.139908988706061 |
| 62 | 16.53 | 16.3499377436315 | 0.180062256368524 |
| 63 | 16.4 | 16.3280995720673 | 0.071900427932727 |
| 64 | 16.41 | 16.3940868330134 | 0.0159131669865548 |
| 65 | 16.42 | 16.4135239100747 | 0.00647608992532536 |
| 66 | 16.62 | 16.5175848899868 | 0.102415110013176 |
| 67 | 16.51 | 16.4613605802952 | 0.0486394197047736 |
| 68 | 16.46 | 16.6255043877461 | -0.165504387746065 |
| 69 | 16.48 | 16.5543999249653 | -0.0743999249652956 |
| 70 | 16.47 | 16.5745692590905 | -0.104569259090532 |
| 71 | 16.66 | 16.7038629251361 | -0.0438629251360994 |
| 72 | 16.67 | 16.6481915988896 | 0.0218084011103696 |
| 73 | 16.77 | 16.6614382569083 | 0.108561743091674 |
| 74 | 16.76 | 16.6582975237804 | 0.101702476219641 |
| 75 | 16.58 | 16.6812554136636 | -0.10125541366356 |
| 76 | 16.69 | 16.6992852972517 | -0.00928529725174413 |
| 77 | 16.85 | 16.833707763841 | 0.0162922361589715 |
| 78 | 16.84 | 16.8506862678423 | -0.010686267842303 |
| 79 | 16.88 | 16.8437737595044 | 0.0362262404955601 |
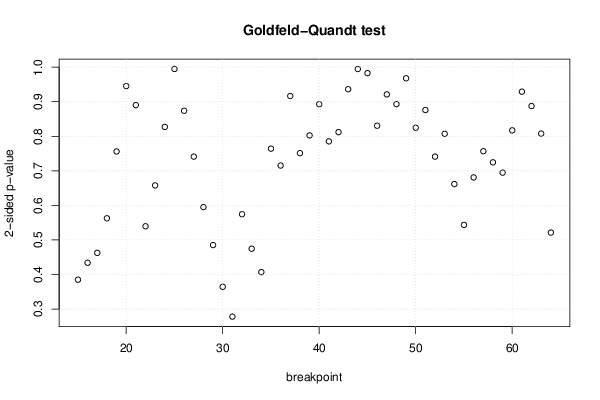
| Goldfeld-Quandt test for Heteroskedasticity | |||
| p-values | Alternative Hypothesis | ||
| breakpoint index | greater | 2-sided | less |
| 15 | 0.807539375493624 | 0.384921249012753 | 0.192460624506376 |
| 16 | 0.783017961648092 | 0.433964076703816 | 0.216982038351908 |
| 17 | 0.768719962632391 | 0.462560074735218 | 0.231280037367609 |
| 18 | 0.718695670693154 | 0.562608658613692 | 0.281304329306846 |
| 19 | 0.621979087849608 | 0.756041824300784 | 0.378020912150392 |
| 20 | 0.527374528318028 | 0.945250943363944 | 0.472625471681972 |
| 21 | 0.445100762667421 | 0.890201525334842 | 0.554899237332579 |
| 22 | 0.730210296454771 | 0.539579407090459 | 0.269789703545229 |
| 23 | 0.671133420791626 | 0.657733158416747 | 0.328866579208374 |
| 24 | 0.586426647396235 | 0.82714670520753 | 0.413573352603765 |
| 25 | 0.497444594203236 | 0.994889188406473 | 0.502555405796764 |
| 26 | 0.436932408603602 | 0.873864817207204 | 0.563067591396398 |
| 27 | 0.370542898842351 | 0.741085797684702 | 0.629457101157649 |
| 28 | 0.297473972165368 | 0.594947944330737 | 0.702526027834632 |
| 29 | 0.242532664000877 | 0.485065328001755 | 0.757467335999123 |
| 30 | 0.182188255424587 | 0.364376510849174 | 0.817811744575413 |
| 31 | 0.138952395307235 | 0.27790479061447 | 0.861047604692765 |
| 32 | 0.287178285775457 | 0.574356571550914 | 0.712821714224543 |
| 33 | 0.237266162652253 | 0.474532325304507 | 0.762733837347747 |
| 34 | 0.203403848941978 | 0.406807697883955 | 0.796596151058022 |
| 35 | 0.382116185813664 | 0.764232371627328 | 0.617883814186336 |
| 36 | 0.357651099573625 | 0.71530219914725 | 0.642348900426375 |
| 37 | 0.458282050478227 | 0.916564100956455 | 0.541717949521773 |
| 38 | 0.624416046320536 | 0.751167907358929 | 0.375583953679464 |
| 39 | 0.598686967206002 | 0.802626065587995 | 0.401313032793998 |
| 40 | 0.553554592091282 | 0.892890815817436 | 0.446445407908718 |
| 41 | 0.60735942529303 | 0.78528114941394 | 0.39264057470697 |
| 42 | 0.594013969370198 | 0.811972061259605 | 0.405986030629802 |
| 43 | 0.531885946540678 | 0.936228106918644 | 0.468114053459322 |
| 44 | 0.502690908573277 | 0.994618182853445 | 0.497309091426723 |
| 45 | 0.491377204290942 | 0.982754408581884 | 0.508622795709058 |
| 46 | 0.41528666222507 | 0.830573324450141 | 0.58471333777493 |
| 47 | 0.539395741636162 | 0.921208516727676 | 0.460604258363838 |
| 48 | 0.553451026589178 | 0.893097946821643 | 0.446548973410822 |
| 49 | 0.483912030611012 | 0.967824061222023 | 0.516087969388988 |
| 50 | 0.412365879793205 | 0.824731759586409 | 0.587634120206795 |
| 51 | 0.437968076520879 | 0.875936153041758 | 0.562031923479121 |
| 52 | 0.37054460863461 | 0.741089217269221 | 0.62945539136539 |
| 53 | 0.403587723830665 | 0.80717544766133 | 0.596412276169335 |
| 54 | 0.330817763893075 | 0.661635527786151 | 0.669182236106925 |
| 55 | 0.271746642003024 | 0.543493284006048 | 0.728253357996976 |
| 56 | 0.340445517088448 | 0.680891034176896 | 0.659554482911552 |
| 57 | 0.378393659019394 | 0.756787318038788 | 0.621606340980606 |
| 58 | 0.362277802007335 | 0.724555604014671 | 0.637722197992665 |
| 59 | 0.34733897434781 | 0.694677948695619 | 0.65266102565219 |
| 60 | 0.408575338172884 | 0.817150676345769 | 0.591424661827116 |
| 61 | 0.464559382598048 | 0.929118765196096 | 0.535440617401952 |
| 62 | 0.443774725009386 | 0.887549450018773 | 0.556225274990614 |
| 63 | 0.40389642124583 | 0.807792842491661 | 0.59610357875417 |
| 64 | 0.260645488540415 | 0.52129097708083 | 0.739354511459585 |
| Meta Analysis of Goldfeld-Quandt test for Heteroskedasticity | |||
| Description | # significant tests | % significant tests | OK/NOK |
| 1% type I error level | 0 | 0 | OK |
| 5% type I error level | 0 | 0 | OK |
| 10% type I error level | 0 | 0 | OK |