| Multiple Linear Regression - Estimated Regression Equation |
| Duurzame-consumptiegoederen[t] = + 0.125719048260087 -0.484978620979913Investeringsgoederen[t] + 14.4196257715794Consumptiegoederen[t] -1.01895375373591`Intermediaire-goederen`[t] + 1.49938476771017`Intermediaire-en-investeringsgoederen`[t] -13.4090060352006`Niet-duurzame-consumptiegoederen`[t] -0.0114596547763776Energie[t] + e[t] |
| Multiple Linear Regression - Ordinary Least Squares | |||||
| Variable | Parameter | S.D. | T-STAT H0: parameter = 0 | 2-tail p-value | 1-tail p-value |
| (Intercept) | 0.125719048260087 | 3.011723 | 0.0417 | 0.966847 | 0.483423 |
| Investeringsgoederen | -0.484978620979913 | 0.319478 | -1.518 | 0.134438 | 0.067219 |
| Consumptiegoederen | 14.4196257715794 | 0.2164 | 66.6342 | 0 | 0 |
| `Intermediaire-goederen` | -1.01895375373591 | 0.710152 | -1.4348 | 0.156704 | 0.078352 |
| `Intermediaire-en-investeringsgoederen` | 1.49938476771017 | 1.029055 | 1.4571 | 0.150495 | 0.075248 |
| `Niet-duurzame-consumptiegoederen` | -13.4090060352006 | 0.205874 | -65.132 | 0 | 0 |
| Energie | -0.0114596547763776 | 0.024841 | -0.4613 | 0.646298 | 0.323149 |
| Multiple Linear Regression - Regression Statistics | |
| Multiple R | 0.998059516748956 |
| R-squared | 0.99612279897316 |
| Adjusted R-squared | 0.995721709211763 |
| F-TEST (value) | 2483.54083012027 |
| F-TEST (DF numerator) | 6 |
| F-TEST (DF denominator) | 58 |
| p-value | 0 |
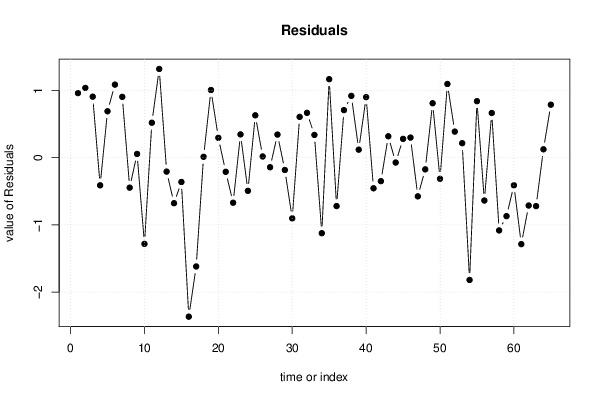
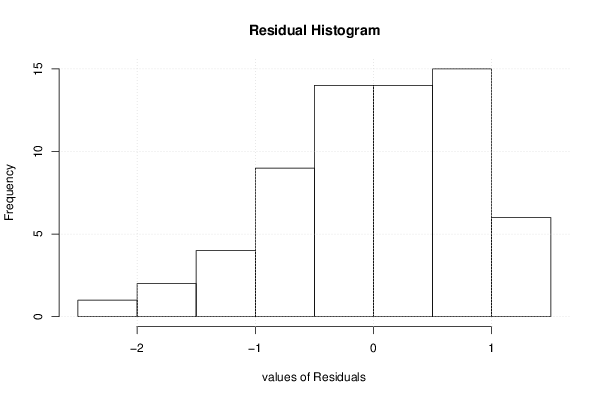
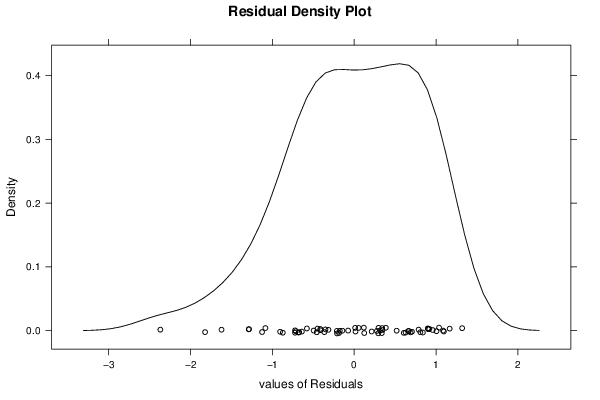
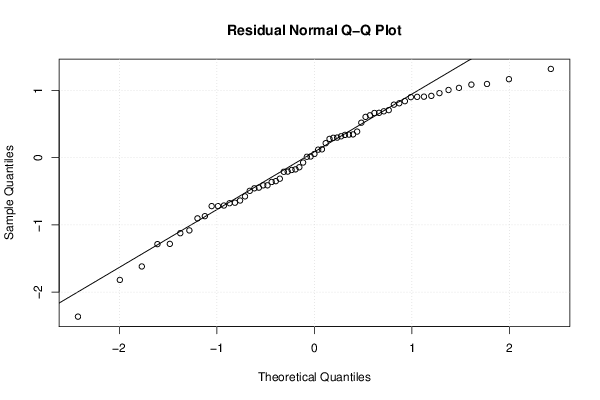
| Multiple Linear Regression - Residual Statistics | |
| Residual Standard Deviation | 0.842315702019236 |
| Sum Squared Residuals | 41.1507530283532 |
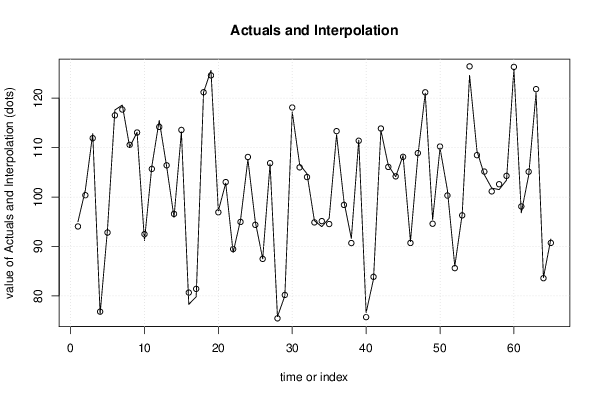
| Multiple Linear Regression - Actuals, Interpolation, and Residuals | |||
| Time or Index | Actuals | Interpolation Forecast | Residuals Prediction Error |
| 1 | 95 | 94.0410410619512 | 0.958958938048764 |
| 2 | 101.4 | 100.363593231185 | 1.03640676881539 |
| 3 | 112.8 | 111.89412239209 | 0.905877607910376 |
| 4 | 76.4 | 76.8128211284014 | -0.412821128401386 |
| 5 | 93.5 | 92.8112313493566 | 0.688768650643386 |
| 6 | 117.6 | 116.514621012327 | 1.085378987673 |
| 7 | 118.6 | 117.696596961727 | 0.90340303827285 |
| 8 | 110.1 | 110.547198281994 | -0.447198281994492 |
| 9 | 113.1 | 113.046020625756 | 0.0539793742436232 |
| 10 | 91.2 | 92.4837674614124 | -1.28376746141236 |
| 11 | 106.2 | 105.68159274331 | 0.518407256689926 |
| 12 | 115.5 | 114.181533462658 | 1.31846653734224 |
| 13 | 106.2 | 106.408711519005 | -0.20871151900504 |
| 14 | 95.9 | 96.5788312763135 | -0.678831276313486 |
| 15 | 113.2 | 113.563099556352 | -0.36309955635248 |
| 16 | 78.3 | 80.6664888464388 | -2.36648884643881 |
| 17 | 79.8 | 81.4197678030719 | -1.61976780307188 |
| 18 | 121.2 | 121.188150053131 | 0.0118499468688879 |
| 19 | 125.6 | 124.594645007661 | 1.00535499233896 |
| 20 | 97.2 | 96.9057841841696 | 0.294215815830384 |
| 21 | 102.8 | 103.011528719343 | -0.211528719343021 |
| 22 | 88.8 | 89.4715461905438 | -0.671546190543805 |
| 23 | 95.3 | 94.9553358854011 | 0.344664114598859 |
| 24 | 107.6 | 108.094640815788 | -0.494640815788393 |
| 25 | 95 | 94.3714431884042 | 0.628556811595818 |
| 26 | 87.5 | 87.4836714001562 | 0.0163285998437637 |
| 27 | 106.7 | 106.843852821364 | -0.143852821363867 |
| 28 | 75.8 | 75.4580308045434 | 0.341969195456633 |
| 29 | 80 | 80.1847121096392 | -0.184712109639155 |
| 30 | 117.2 | 118.104166075491 | -0.90416607549075 |
| 31 | 106.6 | 105.994497402129 | 0.60550259787092 |
| 32 | 104.7 | 104.034640990126 | 0.665359009874096 |
| 33 | 95.2 | 94.8625023317915 | 0.337497668208465 |
| 34 | 94 | 95.1250318938116 | -1.12503189381156 |
| 35 | 95.7 | 94.5337681486156 | 1.16623185138445 |
| 36 | 112.6 | 113.321581281562 | -0.721581281562491 |
| 37 | 99.1 | 98.3940483223667 | 0.705951677633328 |
| 38 | 91.6 | 90.6819881722518 | 0.918011827748142 |
| 39 | 111.5 | 111.382258352826 | 0.117741647173804 |
| 40 | 76.6 | 75.7008701879087 | 0.899129812091256 |
| 41 | 83.4 | 83.8569340307002 | -0.456934030700225 |
| 42 | 113.5 | 113.850640174107 | -0.350640174106527 |
| 43 | 106.4 | 106.083205570336 | 0.316794429664034 |
| 44 | 104.1 | 104.173827921577 | -0.0738279215765318 |
| 45 | 108.4 | 108.121877543233 | 0.278122456767321 |
| 46 | 91 | 90.7025710269951 | 0.29742897300485 |
| 47 | 108.3 | 108.876996934224 | -0.576996934223771 |
| 48 | 121 | 121.175250040509 | -0.175250040509293 |
| 49 | 95.4 | 94.5916805673808 | 0.808319432619168 |
| 50 | 109.9 | 110.214657657863 | -0.31465765786308 |
| 51 | 101.4 | 100.305188969769 | 1.09481103023053 |
| 52 | 86 | 85.6135873347291 | 0.386412665270878 |
| 53 | 96.5 | 96.2861888099078 | 0.21381119009218 |
| 54 | 124.6 | 126.420472079665 | -1.82047207966452 |
| 55 | 109.3 | 108.4610309955 | 0.838969004499834 |
| 56 | 104.5 | 105.138884696436 | -0.638884696436174 |
| 57 | 101.8 | 101.136685897358 | 0.663314102642127 |
| 58 | 101.5 | 102.583548949628 | -1.08354894962831 |
| 59 | 103.4 | 104.271487482381 | -0.871487482380601 |
| 60 | 125.9 | 126.31231535779 | -0.412315357790015 |
| 61 | 96.8 | 98.0877090958087 | -1.28770909580874 |
| 62 | 104.4 | 105.113209454231 | -0.713209454231033 |
| 63 | 121.1 | 121.821958584187 | -0.721958584186537 |
| 64 | 83.7 | 83.5770427116844 | 0.122957288315592 |
| 65 | 91.5 | 90.7133150616255 | 0.786684938374489 |
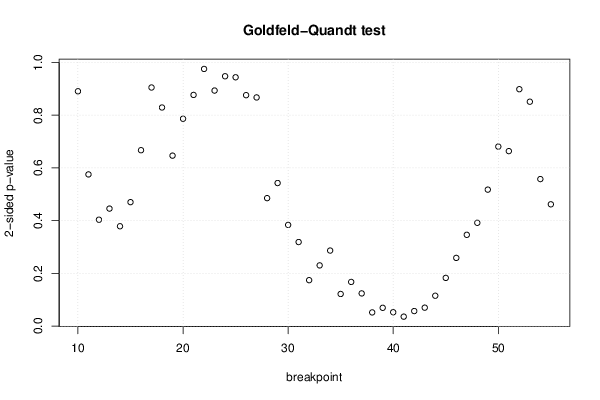
| Goldfeld-Quandt test for Heteroskedasticity | |||
| p-values | Alternative Hypothesis | ||
| breakpoint index | greater | 2-sided | less |
| 10 | 0.445399116892096 | 0.890798233784193 | 0.554600883107903 |
| 11 | 0.287646990769291 | 0.575293981538582 | 0.712353009230709 |
| 12 | 0.20165689309908 | 0.40331378619816 | 0.79834310690092 |
| 13 | 0.22281054286402 | 0.44562108572804 | 0.77718945713598 |
| 14 | 0.189308470293331 | 0.378616940586661 | 0.810691529706669 |
| 15 | 0.235044058017651 | 0.470088116035303 | 0.764955941982349 |
| 16 | 0.33358323789578 | 0.667166475791561 | 0.66641676210422 |
| 17 | 0.452535556831108 | 0.905071113662216 | 0.547464443168892 |
| 18 | 0.58538333798293 | 0.82923332403414 | 0.41461666201707 |
| 19 | 0.676738003897356 | 0.646523992205287 | 0.323261996102644 |
| 20 | 0.606774648046549 | 0.786450703906902 | 0.393225351953451 |
| 21 | 0.561543272771826 | 0.876913454456348 | 0.438456727228174 |
| 22 | 0.512264450589186 | 0.975471098821627 | 0.487735549410814 |
| 23 | 0.446759954962799 | 0.893519909925597 | 0.553240045037201 |
| 24 | 0.473884284231585 | 0.947768568463171 | 0.526115715768415 |
| 25 | 0.4719472653327 | 0.943894530665401 | 0.5280527346673 |
| 26 | 0.437984208483301 | 0.875968416966603 | 0.562015791516699 |
| 27 | 0.433664098851901 | 0.867328197703801 | 0.566335901148099 |
| 28 | 0.75737658221884 | 0.48524683556232 | 0.24262341778116 |
| 29 | 0.728717715970083 | 0.542564568059834 | 0.271282284029917 |
| 30 | 0.808227553928109 | 0.383544892143781 | 0.191772446071891 |
| 31 | 0.840682221122082 | 0.318635557755837 | 0.159317778877918 |
| 32 | 0.913027994064657 | 0.173944011870687 | 0.0869720059353433 |
| 33 | 0.884953757972784 | 0.230092484054432 | 0.115046242027216 |
| 34 | 0.856809324728542 | 0.286381350542916 | 0.143190675271458 |
| 35 | 0.939179196526024 | 0.121641606947953 | 0.0608208034739763 |
| 36 | 0.916352189207509 | 0.167295621584982 | 0.0836478107924909 |
| 37 | 0.938126148256048 | 0.123747703487905 | 0.0618738517439524 |
| 38 | 0.974185328662505 | 0.0516293426749894 | 0.0258146713374947 |
| 39 | 0.965436024442485 | 0.0691279511150302 | 0.0345639755575151 |
| 40 | 0.973851470339209 | 0.0522970593215809 | 0.0261485296607905 |
| 41 | 0.982218279674571 | 0.0355634406508577 | 0.0177817203254288 |
| 42 | 0.971591249145588 | 0.0568175017088245 | 0.0284087508544122 |
| 43 | 0.965179536139253 | 0.0696409277214934 | 0.0348204638607467 |
| 44 | 0.942527938657656 | 0.114944122684688 | 0.0574720613423439 |
| 45 | 0.908691183498303 | 0.182617633003393 | 0.0913088165016966 |
| 46 | 0.870763104873102 | 0.258473790253795 | 0.129236895126898 |
| 47 | 0.826952604960445 | 0.346094790079109 | 0.173047395039555 |
| 48 | 0.804139134309243 | 0.391721731381513 | 0.195860865690757 |
| 49 | 0.741222726913107 | 0.517554546173787 | 0.258777273086893 |
| 50 | 0.659588800394912 | 0.680822399210177 | 0.340411199605089 |
| 51 | 0.668146365751334 | 0.663707268497332 | 0.331853634248666 |
| 52 | 0.550687838141524 | 0.898624323716952 | 0.449312161858476 |
| 53 | 0.425553153634552 | 0.851106307269103 | 0.574446846365448 |
| 54 | 0.721229398101666 | 0.557541203796668 | 0.278770601898334 |
| 55 | 0.769065878360219 | 0.461868243279562 | 0.230934121639781 |
| Meta Analysis of Goldfeld-Quandt test for Heteroskedasticity | |||
| Description | # significant tests | % significant tests | OK/NOK |
| 1% type I error level | 0 | 0 | OK |
| 5% type I error level | 1 | 0.0217391304347826 | OK |
| 10% type I error level | 6 | 0.130434782608696 | NOK |