Free Statistics
of Irreproducible Research!
Description of Statistical Computation | ||||||||||||||||||||||||||||||||||
|---|---|---|---|---|---|---|---|---|---|---|---|---|---|---|---|---|---|---|---|---|---|---|---|---|---|---|---|---|---|---|---|---|---|---|
| Author's title | ||||||||||||||||||||||||||||||||||
| Author | *The author of this computation has been verified* | |||||||||||||||||||||||||||||||||
| R Software Module | rwasp_Distributional Plots.wasp | |||||||||||||||||||||||||||||||||
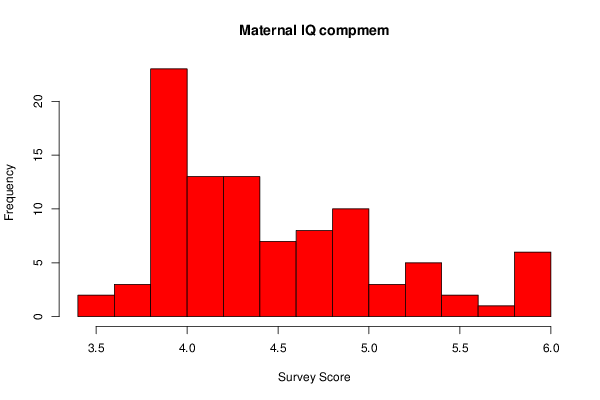
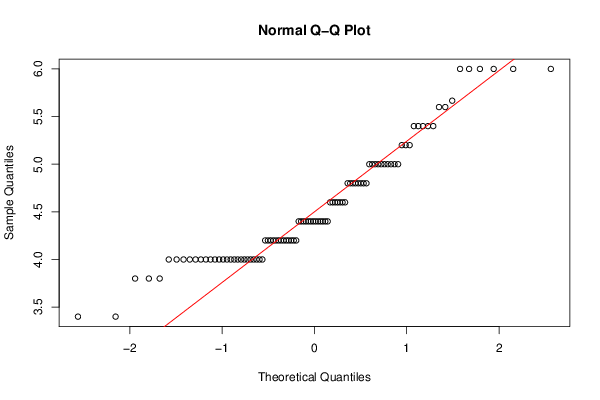
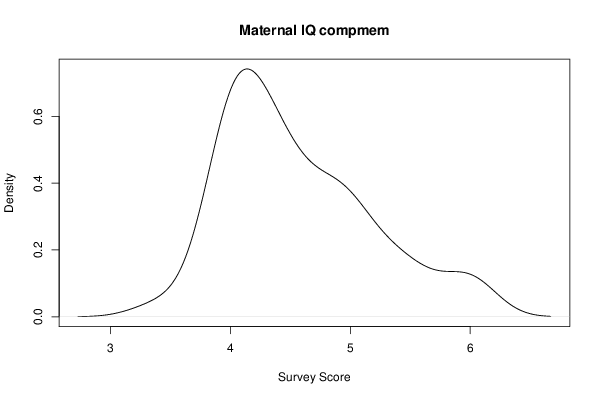
| Title produced by software | Histogram, QQplot and Density | |||||||||||||||||||||||||||||||||
| Date of computation | Mon, 19 Nov 2012 19:21:34 -0500 | |||||||||||||||||||||||||||||||||
| Cite this page as follows | Statistical Computations at FreeStatistics.org, Office for Research Development and Education, URL https://freestatistics.org/blog/index.php?v=date/2012/Nov/19/t1353370911y0yntbbtakbnlh0.htm/, Retrieved Mon, 06 May 2024 00:48:51 +0000 | |||||||||||||||||||||||||||||||||
| Statistical Computations at FreeStatistics.org, Office for Research Development and Education, URL https://freestatistics.org/blog/index.php?pk=190898, Retrieved Mon, 06 May 2024 00:48:51 +0000 | ||||||||||||||||||||||||||||||||||
| QR Codes: | ||||||||||||||||||||||||||||||||||
|
| ||||||||||||||||||||||||||||||||||
| Original text written by user: | ||||||||||||||||||||||||||||||||||
| IsPrivate? | No (this computation is public) | |||||||||||||||||||||||||||||||||
| User-defined keywords | ||||||||||||||||||||||||||||||||||
| Estimated Impact | 72 | |||||||||||||||||||||||||||||||||
Tree of Dependent Computations | ||||||||||||||||||||||||||||||||||
| Family? (F = Feedback message, R = changed R code, M = changed R Module, P = changed Parameters, D = changed Data) | ||||||||||||||||||||||||||||||||||
| - [Histogram, QQplot and Density] [] [2012-11-20 00:21:34] [cc06f8dc3e2c111f023f05ad25d2bd1b] [Current] - R D [Histogram, QQplot and Density] [] [2012-11-20 00:23:26] [55fd393080df5be6479d375e48464127] - D [Histogram, QQplot and Density] [] [2012-11-20 00:25:44] [55fd393080df5be6479d375e48464127] - D [Histogram, QQplot and Density] [] [2012-11-20 00:28:33] [55fd393080df5be6479d375e48464127] - RMPD [Correlation] [] [2012-11-20 00:54:59] [55fd393080df5be6479d375e48464127] - R P [Correlation] [] [2012-11-20 00:58:14] [55fd393080df5be6479d375e48464127] | ||||||||||||||||||||||||||||||||||
| Feedback Forum | ||||||||||||||||||||||||||||||||||
Post a new message | ||||||||||||||||||||||||||||||||||
Dataset | ||||||||||||||||||||||||||||||||||
| Dataseries X: | ||||||||||||||||||||||||||||||||||
4.8 5.4 6 6 4 6 4.2 4.2 4.2 4 4.6 5.666666667 3.8 4.8 4.2 4 5.4 4.6 4 4.4 5 5.4 5.2 4.4 4 3.4 4.4 4 4.4 4.4 4 4.8 4 4 5 4 3.4 4 5.4 4.2 4 5.6 4.8 4.4 4.6 4 5.2 4.8 4.6 4 4.2 4.6 4.4 5 5 4 3.8 5.2 4.2 4.4 4.2 6 4.8 4 4.4 4 4.8 4.8 5.6 6 4 4.2 5 4.4 4.2 4.6 4.4 4 4 4 4.2 4 5 4.2 5.4 4 6 3.8 5 4.4 5 4.4 5 4.2 4.6 5 | ||||||||||||||||||||||||||||||||||
Tables (Output of Computation) | ||||||||||||||||||||||||||||||||||
| ||||||||||||||||||||||||||||||||||
Figures (Output of Computation) | ||||||||||||||||||||||||||||||||||
Input Parameters & R Code | ||||||||||||||||||||||||||||||||||
| Parameters (Session): | ||||||||||||||||||||||||||||||||||
| par1 = 10 ; | ||||||||||||||||||||||||||||||||||
| Parameters (R input): | ||||||||||||||||||||||||||||||||||
| par1 = 10 ; | ||||||||||||||||||||||||||||||||||
| R code (references can be found in the software module): | ||||||||||||||||||||||||||||||||||
x <- x[!is.na(x)] | ||||||||||||||||||||||||||||||||||