Free Statistics

of Irreproducible Research!

Author's title

Author*Unverified author*
R Software Modulerwasp_autocorrelation.wasp
Title produced by software(Partial) Autocorrelation Function
Date of computationSun, 18 Nov 2012 17:18:24 -0500
Cite this page as followsStatistical Computations at FreeStatistics.org, Office for Research Development and Education, URL https://freestatistics.org/blog/index.php?v=date/2012/Nov/18/t1353277127s37ha89lbvvlhn1.htm/, Retrieved Mon, 29 Apr 2024 18:01:24 +0000
Statistical Computations at FreeStatistics.org, Office for Research Development and Education, URL https://freestatistics.org/blog/index.php?pk=190380, Retrieved Mon, 29 Apr 2024 18:01:24 +0000
QR Codes:

Original text written by user:
IsPrivate?No (this computation is public)
User-defined keywords
Estimated Impact98
Family? (F = Feedback message, R = changed R code, M = changed R Module, P = changed Parameters, D = changed Data)
-       [(Partial) Autocorrelation Function] [] [2012-11-18 22:18:24] [4d2251dc83b8e36495234b85db35e813] [Current]
Feedback Forum

Post a new message
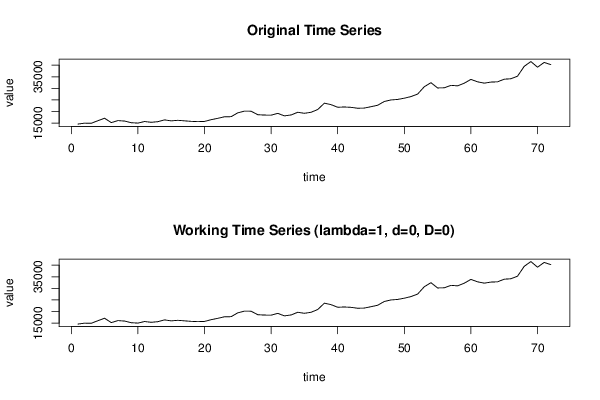
Dataseries X:
14544
14931
14886
16005
17064
15168
16050
15839
15137
14954
15648
15305
15579
16348
15928
16171
15937
15713
15594
15683
16438
17032
17696
17745
19394
20148
20108
18584
18441
18391
19178
18079
18483
19644
19195
19650
20830
23595
22937
21814
21928
21777
21383
21467
22052
22680
24320
24977
25204
25739
26434
27525
30695
32436
30160
30236
31293
31077
32226
33865
32810
32242
32700
32819
33947
34148
35261
39506
41591
39148
41216
40225


Summary of computational transaction
Raw Inputview raw input (R code)
Raw Outputview raw output of R engine
Computing time3 seconds
R Server'Gwilym Jenkins' @ jenkins.wessa.net

\begin{tabular}{lllllllll}
\hline
Summary of computational transaction \tabularnewline
Raw Input & view raw input (R code)  \tabularnewline
Raw Output & view raw output of R engine  \tabularnewline
Computing time & 3 seconds \tabularnewline
R Server & 'Gwilym Jenkins' @ jenkins.wessa.net \tabularnewline
\hline
\end{tabular}
%Source: https://freestatistics.org/blog/index.php?pk=190380&T=0

[TABLE]
[ROW][C]Summary of computational transaction[/C][/ROW]
[ROW][C]Raw Input[/C][C]view raw input (R code) [/C][/ROW]
[ROW][C]Raw Output[/C][C]view raw output of R engine [/C][/ROW]
[ROW][C]Computing time[/C][C]3 seconds[/C][/ROW]
[ROW][C]R Server[/C][C]'Gwilym Jenkins' @ jenkins.wessa.net[/C][/ROW]
[/TABLE]
Source: https://freestatistics.org/blog/index.php?pk=190380&T=0

Globally Unique Identifier (entire table): ba.freestatistics.org/blog/index.php?pk=190380&T=0

As an alternative you can also use a QR Code:  

The GUIDs for individual cells are displayed in the table below:

Summary of computational transaction
Raw Inputview raw input (R code)
Raw Outputview raw output of R engine
Computing time3 seconds
R Server'Gwilym Jenkins' @ jenkins.wessa.net


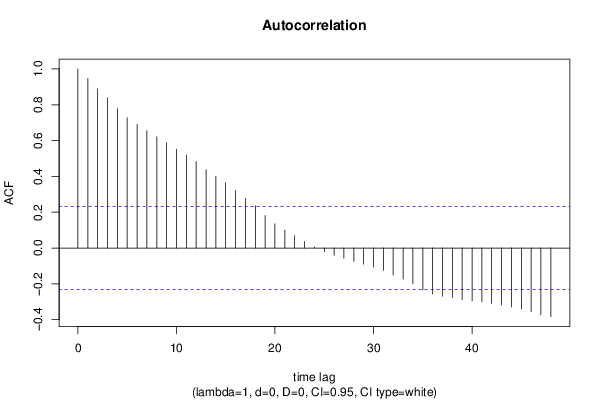
Autocorrelation Function
Time lag kACF(k)T-STATP-value
10.9467758.03370
20.887857.53370
30.8387497.1170
40.7783156.60420
50.7269876.16870
60.6894165.84990
70.6553955.56120
80.6207175.2671e-06
90.5877114.98692e-06
100.551424.6797e-06
110.5196634.40951.8e-05
120.4818724.08885.6e-05
130.4365383.70410.000206
140.3997763.39220.000565
150.3647653.09510.001401
160.3214352.72750.004006
170.2783442.36180.010446
180.2352381.99610.024855
190.1816611.54140.063797
200.1348751.14450.128113
210.099980.84840.199524
220.0683050.57960.282001
230.0366940.31140.378214
240.0057160.04850.480724
25-0.02089-0.17730.429902
26-0.041218-0.34970.363775
27-0.056437-0.47890.316737
28-0.074762-0.63440.263922
29-0.09018-0.76520.223327
30-0.105827-0.8980.186096
31-0.124746-1.05850.146683
32-0.149944-1.27230.103677
33-0.172778-1.46610.073491
34-0.200065-1.69760.04695
35-0.233655-1.98260.025613
36-0.25608-2.17290.016539
37-0.269606-2.28770.012548
38-0.276585-2.34690.010842
39-0.287477-2.43930.00859
40-0.294701-2.50060.007337
41-0.300312-2.54820.00648
42-0.309023-2.62210.005328
43-0.317789-2.69650.004359
44-0.329125-2.79270.003345
45-0.340236-2.8870.002566
46-0.356189-3.02240.001736
47-0.372068-3.15710.001164
48-0.383284-3.25230.000872

\begin{tabular}{lllllllll}
\hline
Autocorrelation Function \tabularnewline
Time lag k & ACF(k) & T-STAT & P-value \tabularnewline
1 & 0.946775 & 8.0337 & 0 \tabularnewline
2 & 0.88785 & 7.5337 & 0 \tabularnewline
3 & 0.838749 & 7.117 & 0 \tabularnewline
4 & 0.778315 & 6.6042 & 0 \tabularnewline
5 & 0.726987 & 6.1687 & 0 \tabularnewline
6 & 0.689416 & 5.8499 & 0 \tabularnewline
7 & 0.655395 & 5.5612 & 0 \tabularnewline
8 & 0.620717 & 5.267 & 1e-06 \tabularnewline
9 & 0.587711 & 4.9869 & 2e-06 \tabularnewline
10 & 0.55142 & 4.679 & 7e-06 \tabularnewline
11 & 0.519663 & 4.4095 & 1.8e-05 \tabularnewline
12 & 0.481872 & 4.0888 & 5.6e-05 \tabularnewline
13 & 0.436538 & 3.7041 & 0.000206 \tabularnewline
14 & 0.399776 & 3.3922 & 0.000565 \tabularnewline
15 & 0.364765 & 3.0951 & 0.001401 \tabularnewline
16 & 0.321435 & 2.7275 & 0.004006 \tabularnewline
17 & 0.278344 & 2.3618 & 0.010446 \tabularnewline
18 & 0.235238 & 1.9961 & 0.024855 \tabularnewline
19 & 0.181661 & 1.5414 & 0.063797 \tabularnewline
20 & 0.134875 & 1.1445 & 0.128113 \tabularnewline
21 & 0.09998 & 0.8484 & 0.199524 \tabularnewline
22 & 0.068305 & 0.5796 & 0.282001 \tabularnewline
23 & 0.036694 & 0.3114 & 0.378214 \tabularnewline
24 & 0.005716 & 0.0485 & 0.480724 \tabularnewline
25 & -0.02089 & -0.1773 & 0.429902 \tabularnewline
26 & -0.041218 & -0.3497 & 0.363775 \tabularnewline
27 & -0.056437 & -0.4789 & 0.316737 \tabularnewline
28 & -0.074762 & -0.6344 & 0.263922 \tabularnewline
29 & -0.09018 & -0.7652 & 0.223327 \tabularnewline
30 & -0.105827 & -0.898 & 0.186096 \tabularnewline
31 & -0.124746 & -1.0585 & 0.146683 \tabularnewline
32 & -0.149944 & -1.2723 & 0.103677 \tabularnewline
33 & -0.172778 & -1.4661 & 0.073491 \tabularnewline
34 & -0.200065 & -1.6976 & 0.04695 \tabularnewline
35 & -0.233655 & -1.9826 & 0.025613 \tabularnewline
36 & -0.25608 & -2.1729 & 0.016539 \tabularnewline
37 & -0.269606 & -2.2877 & 0.012548 \tabularnewline
38 & -0.276585 & -2.3469 & 0.010842 \tabularnewline
39 & -0.287477 & -2.4393 & 0.00859 \tabularnewline
40 & -0.294701 & -2.5006 & 0.007337 \tabularnewline
41 & -0.300312 & -2.5482 & 0.00648 \tabularnewline
42 & -0.309023 & -2.6221 & 0.005328 \tabularnewline
43 & -0.317789 & -2.6965 & 0.004359 \tabularnewline
44 & -0.329125 & -2.7927 & 0.003345 \tabularnewline
45 & -0.340236 & -2.887 & 0.002566 \tabularnewline
46 & -0.356189 & -3.0224 & 0.001736 \tabularnewline
47 & -0.372068 & -3.1571 & 0.001164 \tabularnewline
48 & -0.383284 & -3.2523 & 0.000872 \tabularnewline
\hline
\end{tabular}
%Source: https://freestatistics.org/blog/index.php?pk=190380&T=1

[TABLE]
[ROW][C]Autocorrelation Function[/C][/ROW]
[ROW][C]Time lag k[/C][C]ACF(k)[/C][C]T-STAT[/C][C]P-value[/C][/ROW]
[ROW][C]1[/C][C]0.946775[/C][C]8.0337[/C][C]0[/C][/ROW]
[ROW][C]2[/C][C]0.88785[/C][C]7.5337[/C][C]0[/C][/ROW]
[ROW][C]3[/C][C]0.838749[/C][C]7.117[/C][C]0[/C][/ROW]
[ROW][C]4[/C][C]0.778315[/C][C]6.6042[/C][C]0[/C][/ROW]
[ROW][C]5[/C][C]0.726987[/C][C]6.1687[/C][C]0[/C][/ROW]
[ROW][C]6[/C][C]0.689416[/C][C]5.8499[/C][C]0[/C][/ROW]
[ROW][C]7[/C][C]0.655395[/C][C]5.5612[/C][C]0[/C][/ROW]
[ROW][C]8[/C][C]0.620717[/C][C]5.267[/C][C]1e-06[/C][/ROW]
[ROW][C]9[/C][C]0.587711[/C][C]4.9869[/C][C]2e-06[/C][/ROW]
[ROW][C]10[/C][C]0.55142[/C][C]4.679[/C][C]7e-06[/C][/ROW]
[ROW][C]11[/C][C]0.519663[/C][C]4.4095[/C][C]1.8e-05[/C][/ROW]
[ROW][C]12[/C][C]0.481872[/C][C]4.0888[/C][C]5.6e-05[/C][/ROW]
[ROW][C]13[/C][C]0.436538[/C][C]3.7041[/C][C]0.000206[/C][/ROW]
[ROW][C]14[/C][C]0.399776[/C][C]3.3922[/C][C]0.000565[/C][/ROW]
[ROW][C]15[/C][C]0.364765[/C][C]3.0951[/C][C]0.001401[/C][/ROW]
[ROW][C]16[/C][C]0.321435[/C][C]2.7275[/C][C]0.004006[/C][/ROW]
[ROW][C]17[/C][C]0.278344[/C][C]2.3618[/C][C]0.010446[/C][/ROW]
[ROW][C]18[/C][C]0.235238[/C][C]1.9961[/C][C]0.024855[/C][/ROW]
[ROW][C]19[/C][C]0.181661[/C][C]1.5414[/C][C]0.063797[/C][/ROW]
[ROW][C]20[/C][C]0.134875[/C][C]1.1445[/C][C]0.128113[/C][/ROW]
[ROW][C]21[/C][C]0.09998[/C][C]0.8484[/C][C]0.199524[/C][/ROW]
[ROW][C]22[/C][C]0.068305[/C][C]0.5796[/C][C]0.282001[/C][/ROW]
[ROW][C]23[/C][C]0.036694[/C][C]0.3114[/C][C]0.378214[/C][/ROW]
[ROW][C]24[/C][C]0.005716[/C][C]0.0485[/C][C]0.480724[/C][/ROW]
[ROW][C]25[/C][C]-0.02089[/C][C]-0.1773[/C][C]0.429902[/C][/ROW]
[ROW][C]26[/C][C]-0.041218[/C][C]-0.3497[/C][C]0.363775[/C][/ROW]
[ROW][C]27[/C][C]-0.056437[/C][C]-0.4789[/C][C]0.316737[/C][/ROW]
[ROW][C]28[/C][C]-0.074762[/C][C]-0.6344[/C][C]0.263922[/C][/ROW]
[ROW][C]29[/C][C]-0.09018[/C][C]-0.7652[/C][C]0.223327[/C][/ROW]
[ROW][C]30[/C][C]-0.105827[/C][C]-0.898[/C][C]0.186096[/C][/ROW]
[ROW][C]31[/C][C]-0.124746[/C][C]-1.0585[/C][C]0.146683[/C][/ROW]
[ROW][C]32[/C][C]-0.149944[/C][C]-1.2723[/C][C]0.103677[/C][/ROW]
[ROW][C]33[/C][C]-0.172778[/C][C]-1.4661[/C][C]0.073491[/C][/ROW]
[ROW][C]34[/C][C]-0.200065[/C][C]-1.6976[/C][C]0.04695[/C][/ROW]
[ROW][C]35[/C][C]-0.233655[/C][C]-1.9826[/C][C]0.025613[/C][/ROW]
[ROW][C]36[/C][C]-0.25608[/C][C]-2.1729[/C][C]0.016539[/C][/ROW]
[ROW][C]37[/C][C]-0.269606[/C][C]-2.2877[/C][C]0.012548[/C][/ROW]
[ROW][C]38[/C][C]-0.276585[/C][C]-2.3469[/C][C]0.010842[/C][/ROW]
[ROW][C]39[/C][C]-0.287477[/C][C]-2.4393[/C][C]0.00859[/C][/ROW]
[ROW][C]40[/C][C]-0.294701[/C][C]-2.5006[/C][C]0.007337[/C][/ROW]
[ROW][C]41[/C][C]-0.300312[/C][C]-2.5482[/C][C]0.00648[/C][/ROW]
[ROW][C]42[/C][C]-0.309023[/C][C]-2.6221[/C][C]0.005328[/C][/ROW]
[ROW][C]43[/C][C]-0.317789[/C][C]-2.6965[/C][C]0.004359[/C][/ROW]
[ROW][C]44[/C][C]-0.329125[/C][C]-2.7927[/C][C]0.003345[/C][/ROW]
[ROW][C]45[/C][C]-0.340236[/C][C]-2.887[/C][C]0.002566[/C][/ROW]
[ROW][C]46[/C][C]-0.356189[/C][C]-3.0224[/C][C]0.001736[/C][/ROW]
[ROW][C]47[/C][C]-0.372068[/C][C]-3.1571[/C][C]0.001164[/C][/ROW]
[ROW][C]48[/C][C]-0.383284[/C][C]-3.2523[/C][C]0.000872[/C][/ROW]
[/TABLE]
Source: https://freestatistics.org/blog/index.php?pk=190380&T=1

Globally Unique Identifier (entire table): ba.freestatistics.org/blog/index.php?pk=190380&T=1

As an alternative you can also use a QR Code:  

The GUIDs for individual cells are displayed in the table below:

Autocorrelation Function
Time lag kACF(k)T-STATP-value
10.9467758.03370
20.887857.53370
30.8387497.1170
40.7783156.60420
50.7269876.16870
60.6894165.84990
70.6553955.56120
80.6207175.2671e-06
90.5877114.98692e-06
100.551424.6797e-06
110.5196634.40951.8e-05
120.4818724.08885.6e-05
130.4365383.70410.000206
140.3997763.39220.000565
150.3647653.09510.001401
160.3214352.72750.004006
170.2783442.36180.010446
180.2352381.99610.024855
190.1816611.54140.063797
200.1348751.14450.128113
210.099980.84840.199524
220.0683050.57960.282001
230.0366940.31140.378214
240.0057160.04850.480724
25-0.02089-0.17730.429902
26-0.041218-0.34970.363775
27-0.056437-0.47890.316737
28-0.074762-0.63440.263922
29-0.09018-0.76520.223327
30-0.105827-0.8980.186096
31-0.124746-1.05850.146683
32-0.149944-1.27230.103677
33-0.172778-1.46610.073491
34-0.200065-1.69760.04695
35-0.233655-1.98260.025613
36-0.25608-2.17290.016539
37-0.269606-2.28770.012548
38-0.276585-2.34690.010842
39-0.287477-2.43930.00859
40-0.294701-2.50060.007337
41-0.300312-2.54820.00648
42-0.309023-2.62210.005328
43-0.317789-2.69650.004359
44-0.329125-2.79270.003345
45-0.340236-2.8870.002566
46-0.356189-3.02240.001736
47-0.372068-3.15710.001164
48-0.383284-3.25230.000872


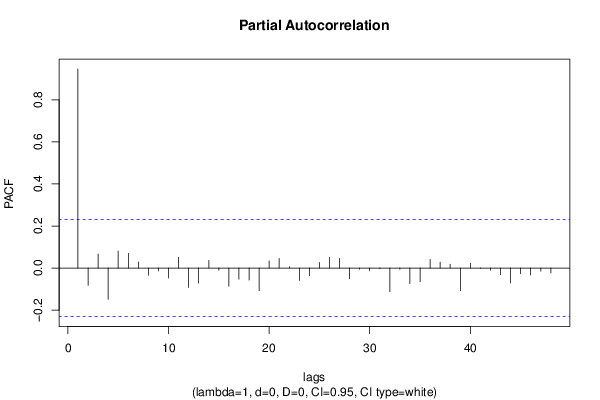
Partial Autocorrelation Function
Time lag kPACF(k)T-STATP-value
10.9467758.03370
2-0.082346-0.69870.243487
30.0670210.56870.285668
4-0.148143-1.2570.106402
50.0806070.6840.248095
60.0700680.59450.277006
70.0288010.24440.403812
8-0.033996-0.28850.38691
9-0.013682-0.11610.453951
10-0.047079-0.39950.345362
110.0510520.43320.333085
12-0.09235-0.78360.217919
13-0.0718-0.60920.27214
140.0358660.30430.380875
15-0.010267-0.08710.46541
16-0.086547-0.73440.232553
17-0.052767-0.44770.327843
18-0.057168-0.48510.314545
19-0.108129-0.91750.18097
200.0342560.29070.38607
210.0451680.38330.351327
220.0068910.05850.476766
23-0.059198-0.50230.308491
24-0.036615-0.31070.378469
250.0266080.22580.411008
260.0517010.43870.331096
270.0453010.38440.350909
28-0.050276-0.42660.335469
29-0.005468-0.04640.481559
30-0.013391-0.11360.454924
31-0.003374-0.02860.488619
32-0.112575-0.95520.171329
33-0.006024-0.05110.479689
34-0.073166-0.62080.268334
35-0.06443-0.54670.293134
360.0404520.34320.366208
370.0275360.23360.40796
380.0179960.15270.43953
39-0.108155-0.91770.180912
400.0229810.1950.422971
41-0.00175-0.01490.494095
42-0.009854-0.08360.466796
43-0.031519-0.26740.394945
44-0.070889-0.60150.274695
45-0.026669-0.22630.410806
46-0.032794-0.27830.390803
47-0.014489-0.12290.451248
48-0.022976-0.1950.422988

\begin{tabular}{lllllllll}
\hline
Partial Autocorrelation Function \tabularnewline
Time lag k & PACF(k) & T-STAT & P-value \tabularnewline
1 & 0.946775 & 8.0337 & 0 \tabularnewline
2 & -0.082346 & -0.6987 & 0.243487 \tabularnewline
3 & 0.067021 & 0.5687 & 0.285668 \tabularnewline
4 & -0.148143 & -1.257 & 0.106402 \tabularnewline
5 & 0.080607 & 0.684 & 0.248095 \tabularnewline
6 & 0.070068 & 0.5945 & 0.277006 \tabularnewline
7 & 0.028801 & 0.2444 & 0.403812 \tabularnewline
8 & -0.033996 & -0.2885 & 0.38691 \tabularnewline
9 & -0.013682 & -0.1161 & 0.453951 \tabularnewline
10 & -0.047079 & -0.3995 & 0.345362 \tabularnewline
11 & 0.051052 & 0.4332 & 0.333085 \tabularnewline
12 & -0.09235 & -0.7836 & 0.217919 \tabularnewline
13 & -0.0718 & -0.6092 & 0.27214 \tabularnewline
14 & 0.035866 & 0.3043 & 0.380875 \tabularnewline
15 & -0.010267 & -0.0871 & 0.46541 \tabularnewline
16 & -0.086547 & -0.7344 & 0.232553 \tabularnewline
17 & -0.052767 & -0.4477 & 0.327843 \tabularnewline
18 & -0.057168 & -0.4851 & 0.314545 \tabularnewline
19 & -0.108129 & -0.9175 & 0.18097 \tabularnewline
20 & 0.034256 & 0.2907 & 0.38607 \tabularnewline
21 & 0.045168 & 0.3833 & 0.351327 \tabularnewline
22 & 0.006891 & 0.0585 & 0.476766 \tabularnewline
23 & -0.059198 & -0.5023 & 0.308491 \tabularnewline
24 & -0.036615 & -0.3107 & 0.378469 \tabularnewline
25 & 0.026608 & 0.2258 & 0.411008 \tabularnewline
26 & 0.051701 & 0.4387 & 0.331096 \tabularnewline
27 & 0.045301 & 0.3844 & 0.350909 \tabularnewline
28 & -0.050276 & -0.4266 & 0.335469 \tabularnewline
29 & -0.005468 & -0.0464 & 0.481559 \tabularnewline
30 & -0.013391 & -0.1136 & 0.454924 \tabularnewline
31 & -0.003374 & -0.0286 & 0.488619 \tabularnewline
32 & -0.112575 & -0.9552 & 0.171329 \tabularnewline
33 & -0.006024 & -0.0511 & 0.479689 \tabularnewline
34 & -0.073166 & -0.6208 & 0.268334 \tabularnewline
35 & -0.06443 & -0.5467 & 0.293134 \tabularnewline
36 & 0.040452 & 0.3432 & 0.366208 \tabularnewline
37 & 0.027536 & 0.2336 & 0.40796 \tabularnewline
38 & 0.017996 & 0.1527 & 0.43953 \tabularnewline
39 & -0.108155 & -0.9177 & 0.180912 \tabularnewline
40 & 0.022981 & 0.195 & 0.422971 \tabularnewline
41 & -0.00175 & -0.0149 & 0.494095 \tabularnewline
42 & -0.009854 & -0.0836 & 0.466796 \tabularnewline
43 & -0.031519 & -0.2674 & 0.394945 \tabularnewline
44 & -0.070889 & -0.6015 & 0.274695 \tabularnewline
45 & -0.026669 & -0.2263 & 0.410806 \tabularnewline
46 & -0.032794 & -0.2783 & 0.390803 \tabularnewline
47 & -0.014489 & -0.1229 & 0.451248 \tabularnewline
48 & -0.022976 & -0.195 & 0.422988 \tabularnewline
\hline
\end{tabular}
%Source: https://freestatistics.org/blog/index.php?pk=190380&T=2

[TABLE]
[ROW][C]Partial Autocorrelation Function[/C][/ROW]
[ROW][C]Time lag k[/C][C]PACF(k)[/C][C]T-STAT[/C][C]P-value[/C][/ROW]
[ROW][C]1[/C][C]0.946775[/C][C]8.0337[/C][C]0[/C][/ROW]
[ROW][C]2[/C][C]-0.082346[/C][C]-0.6987[/C][C]0.243487[/C][/ROW]
[ROW][C]3[/C][C]0.067021[/C][C]0.5687[/C][C]0.285668[/C][/ROW]
[ROW][C]4[/C][C]-0.148143[/C][C]-1.257[/C][C]0.106402[/C][/ROW]
[ROW][C]5[/C][C]0.080607[/C][C]0.684[/C][C]0.248095[/C][/ROW]
[ROW][C]6[/C][C]0.070068[/C][C]0.5945[/C][C]0.277006[/C][/ROW]
[ROW][C]7[/C][C]0.028801[/C][C]0.2444[/C][C]0.403812[/C][/ROW]
[ROW][C]8[/C][C]-0.033996[/C][C]-0.2885[/C][C]0.38691[/C][/ROW]
[ROW][C]9[/C][C]-0.013682[/C][C]-0.1161[/C][C]0.453951[/C][/ROW]
[ROW][C]10[/C][C]-0.047079[/C][C]-0.3995[/C][C]0.345362[/C][/ROW]
[ROW][C]11[/C][C]0.051052[/C][C]0.4332[/C][C]0.333085[/C][/ROW]
[ROW][C]12[/C][C]-0.09235[/C][C]-0.7836[/C][C]0.217919[/C][/ROW]
[ROW][C]13[/C][C]-0.0718[/C][C]-0.6092[/C][C]0.27214[/C][/ROW]
[ROW][C]14[/C][C]0.035866[/C][C]0.3043[/C][C]0.380875[/C][/ROW]
[ROW][C]15[/C][C]-0.010267[/C][C]-0.0871[/C][C]0.46541[/C][/ROW]
[ROW][C]16[/C][C]-0.086547[/C][C]-0.7344[/C][C]0.232553[/C][/ROW]
[ROW][C]17[/C][C]-0.052767[/C][C]-0.4477[/C][C]0.327843[/C][/ROW]
[ROW][C]18[/C][C]-0.057168[/C][C]-0.4851[/C][C]0.314545[/C][/ROW]
[ROW][C]19[/C][C]-0.108129[/C][C]-0.9175[/C][C]0.18097[/C][/ROW]
[ROW][C]20[/C][C]0.034256[/C][C]0.2907[/C][C]0.38607[/C][/ROW]
[ROW][C]21[/C][C]0.045168[/C][C]0.3833[/C][C]0.351327[/C][/ROW]
[ROW][C]22[/C][C]0.006891[/C][C]0.0585[/C][C]0.476766[/C][/ROW]
[ROW][C]23[/C][C]-0.059198[/C][C]-0.5023[/C][C]0.308491[/C][/ROW]
[ROW][C]24[/C][C]-0.036615[/C][C]-0.3107[/C][C]0.378469[/C][/ROW]
[ROW][C]25[/C][C]0.026608[/C][C]0.2258[/C][C]0.411008[/C][/ROW]
[ROW][C]26[/C][C]0.051701[/C][C]0.4387[/C][C]0.331096[/C][/ROW]
[ROW][C]27[/C][C]0.045301[/C][C]0.3844[/C][C]0.350909[/C][/ROW]
[ROW][C]28[/C][C]-0.050276[/C][C]-0.4266[/C][C]0.335469[/C][/ROW]
[ROW][C]29[/C][C]-0.005468[/C][C]-0.0464[/C][C]0.481559[/C][/ROW]
[ROW][C]30[/C][C]-0.013391[/C][C]-0.1136[/C][C]0.454924[/C][/ROW]
[ROW][C]31[/C][C]-0.003374[/C][C]-0.0286[/C][C]0.488619[/C][/ROW]
[ROW][C]32[/C][C]-0.112575[/C][C]-0.9552[/C][C]0.171329[/C][/ROW]
[ROW][C]33[/C][C]-0.006024[/C][C]-0.0511[/C][C]0.479689[/C][/ROW]
[ROW][C]34[/C][C]-0.073166[/C][C]-0.6208[/C][C]0.268334[/C][/ROW]
[ROW][C]35[/C][C]-0.06443[/C][C]-0.5467[/C][C]0.293134[/C][/ROW]
[ROW][C]36[/C][C]0.040452[/C][C]0.3432[/C][C]0.366208[/C][/ROW]
[ROW][C]37[/C][C]0.027536[/C][C]0.2336[/C][C]0.40796[/C][/ROW]
[ROW][C]38[/C][C]0.017996[/C][C]0.1527[/C][C]0.43953[/C][/ROW]
[ROW][C]39[/C][C]-0.108155[/C][C]-0.9177[/C][C]0.180912[/C][/ROW]
[ROW][C]40[/C][C]0.022981[/C][C]0.195[/C][C]0.422971[/C][/ROW]
[ROW][C]41[/C][C]-0.00175[/C][C]-0.0149[/C][C]0.494095[/C][/ROW]
[ROW][C]42[/C][C]-0.009854[/C][C]-0.0836[/C][C]0.466796[/C][/ROW]
[ROW][C]43[/C][C]-0.031519[/C][C]-0.2674[/C][C]0.394945[/C][/ROW]
[ROW][C]44[/C][C]-0.070889[/C][C]-0.6015[/C][C]0.274695[/C][/ROW]
[ROW][C]45[/C][C]-0.026669[/C][C]-0.2263[/C][C]0.410806[/C][/ROW]
[ROW][C]46[/C][C]-0.032794[/C][C]-0.2783[/C][C]0.390803[/C][/ROW]
[ROW][C]47[/C][C]-0.014489[/C][C]-0.1229[/C][C]0.451248[/C][/ROW]
[ROW][C]48[/C][C]-0.022976[/C][C]-0.195[/C][C]0.422988[/C][/ROW]
[/TABLE]
Source: https://freestatistics.org/blog/index.php?pk=190380&T=2

Globally Unique Identifier (entire table): ba.freestatistics.org/blog/index.php?pk=190380&T=2

As an alternative you can also use a QR Code:  

The GUIDs for individual cells are displayed in the table below:

Partial Autocorrelation Function
Time lag kPACF(k)T-STATP-value
10.9467758.03370
2-0.082346-0.69870.243487
30.0670210.56870.285668
4-0.148143-1.2570.106402
50.0806070.6840.248095
60.0700680.59450.277006
70.0288010.24440.403812
8-0.033996-0.28850.38691
9-0.013682-0.11610.453951
10-0.047079-0.39950.345362
110.0510520.43320.333085
12-0.09235-0.78360.217919
13-0.0718-0.60920.27214
140.0358660.30430.380875
15-0.010267-0.08710.46541
16-0.086547-0.73440.232553
17-0.052767-0.44770.327843
18-0.057168-0.48510.314545
19-0.108129-0.91750.18097
200.0342560.29070.38607
210.0451680.38330.351327
220.0068910.05850.476766
23-0.059198-0.50230.308491
24-0.036615-0.31070.378469
250.0266080.22580.411008
260.0517010.43870.331096
270.0453010.38440.350909
28-0.050276-0.42660.335469
29-0.005468-0.04640.481559
30-0.013391-0.11360.454924
31-0.003374-0.02860.488619
32-0.112575-0.95520.171329
33-0.006024-0.05110.479689
34-0.073166-0.62080.268334
35-0.06443-0.54670.293134
360.0404520.34320.366208
370.0275360.23360.40796
380.0179960.15270.43953
39-0.108155-0.91770.180912
400.0229810.1950.422971
41-0.00175-0.01490.494095
42-0.009854-0.08360.466796
43-0.031519-0.26740.394945
44-0.070889-0.60150.274695
45-0.026669-0.22630.410806
46-0.032794-0.27830.390803
47-0.014489-0.12290.451248
48-0.022976-0.1950.422988


Parameters (Session):
par1 = 48 ; par2 = 1 ; par3 = 0 ; par4 = 0 ; par5 = 12 ; par6 = White Noise ; par7 = 0.95 ;
Parameters (R input):
par1 = 48 ; par2 = 1 ; par3 = 0 ; par4 = 0 ; par5 = 12 ; par6 = White Noise ; par7 = 0.95 ; par8 = ;
R code (references can be found in the software module):
if (par1 == 'Default') {
par1 = 10*log10(length(x))
} else {
par1 <- as.numeric(par1)
}
par2 <- as.numeric(par2)
par3 <- as.numeric(par3)
par4 <- as.numeric(par4)
par5 <- as.numeric(par5)
if (par6 == 'White Noise') par6 <- 'white' else par6 <- 'ma'
par7 <- as.numeric(par7)
if (par8 != '') par8 <- as.numeric(par8)
ox <- x
if (par8 == '') {
if (par2 == 0) {
x <- log(x)
} else {
x <- (x ^ par2 - 1) / par2
}
} else {
x <- log(x,base=par8)
}
if (par3 > 0) x <- diff(x,lag=1,difference=par3)
if (par4 > 0) x <- diff(x,lag=par5,difference=par4)
bitmap(file='picts.png')
op <- par(mfrow=c(2,1))
plot(ox,type='l',main='Original Time Series',xlab='time',ylab='value')
if (par8=='') {
mytitle <- paste('Working Time Series (lambda=',par2,', d=',par3,', D=',par4,')',sep='')
mysub <- paste('(lambda=',par2,', d=',par3,', D=',par4,', CI=', par7, ', CI type=',par6,')',sep='')
} else {
mytitle <- paste('Working Time Series (base=',par8,', d=',par3,', D=',par4,')',sep='')
mysub <- paste('(base=',par8,', d=',par3,', D=',par4,', CI=', par7, ', CI type=',par6,')',sep='')
}
plot(x,type='l', main=mytitle,xlab='time',ylab='value')
par(op)
dev.off()
bitmap(file='pic1.png')
racf <- acf(x, par1, main='Autocorrelation', xlab='time lag', ylab='ACF', ci.type=par6, ci=par7, sub=mysub)
dev.off()
bitmap(file='pic2.png')
rpacf <- pacf(x,par1,main='Partial Autocorrelation',xlab='lags',ylab='PACF',sub=mysub)
dev.off()
(myacf <- c(racf$acf))
(mypacf <- c(rpacf$acf))
lengthx <- length(x)
sqrtn <- sqrt(lengthx)
load(file='createtable')
a<-table.start()
a<-table.row.start(a)
a<-table.element(a,'Autocorrelation Function',4,TRUE)
a<-table.row.end(a)
a<-table.row.start(a)
a<-table.element(a,'Time lag k',header=TRUE)
a<-table.element(a,hyperlink('basics.htm','ACF(k)','click here for more information about the Autocorrelation Function'),header=TRUE)
a<-table.element(a,'T-STAT',header=TRUE)
a<-table.element(a,'P-value',header=TRUE)
a<-table.row.end(a)
for (i in 2:(par1+1)) {
a<-table.row.start(a)
a<-table.element(a,i-1,header=TRUE)
a<-table.element(a,round(myacf[i],6))
mytstat <- myacf[i]*sqrtn
a<-table.element(a,round(mytstat,4))
a<-table.element(a,round(1-pt(abs(mytstat),lengthx),6))
a<-table.row.end(a)
}
a<-table.end(a)
table.save(a,file='mytable.tab')
a<-table.start()
a<-table.row.start(a)
a<-table.element(a,'Partial Autocorrelation Function',4,TRUE)
a<-table.row.end(a)
a<-table.row.start(a)
a<-table.element(a,'Time lag k',header=TRUE)
a<-table.element(a,hyperlink('basics.htm','PACF(k)','click here for more information about the Partial Autocorrelation Function'),header=TRUE)
a<-table.element(a,'T-STAT',header=TRUE)
a<-table.element(a,'P-value',header=TRUE)
a<-table.row.end(a)
for (i in 1:par1) {
a<-table.row.start(a)
a<-table.element(a,i,header=TRUE)
a<-table.element(a,round(mypacf[i],6))
mytstat <- mypacf[i]*sqrtn
a<-table.element(a,round(mytstat,4))
a<-table.element(a,round(1-pt(abs(mytstat),lengthx),6))
a<-table.row.end(a)
}
a<-table.end(a)
table.save(a,file='mytable1.tab')