Free Statistics

of Irreproducible Research!

Author's title

Author*Unverified author*
R Software Modulerwasp_autocorrelation.wasp
Title produced by software(Partial) Autocorrelation Function
Date of computationSun, 18 Nov 2012 12:28:49 -0500
Cite this page as followsStatistical Computations at FreeStatistics.org, Office for Research Development and Education, URL https://freestatistics.org/blog/index.php?v=date/2012/Nov/18/t13532597793oqh84zz6aifs4c.htm/, Retrieved Mon, 29 Apr 2024 19:40:43 +0000
Statistical Computations at FreeStatistics.org, Office for Research Development and Education, URL https://freestatistics.org/blog/index.php?pk=190278, Retrieved Mon, 29 Apr 2024 19:40:43 +0000
QR Codes:

Original text written by user:
IsPrivate?No (this computation is public)
User-defined keywords
Estimated Impact66
Family? (F = Feedback message, R = changed R code, M = changed R Module, P = changed Parameters, D = changed Data)
-       [(Partial) Autocorrelation Function] [opdracht 6bis] [2012-11-18 17:28:49] [d8949b7c39db4d188773a58b86b4d1f1] [Current]
Feedback Forum

Post a new message
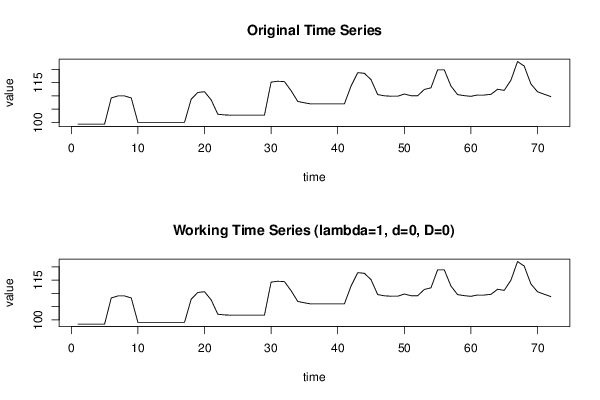
Dataseries X:
99,42
99,42
99,42
99,42
99,42
109,26
110
110
109,26
100,07
100,07
100,05
100,05
100,05
100,05
100,05
100,05
108,77
111,32
111,6
108,52
103,13
102,87
102,75
102,75
102,75
102,75
102,75
102,75
115,22
115,53
115,4
111,99
107,93
107,43
106,98
106,98
106,98
106,98
106,98
106,98
113,71
118,77
118,54
116,16
110,52
110,06
109,9
109,9
110,72
110,09
110,07
112,45
113,06
119,83
119,84
113,73
110,5
110,12
109,86
110,36
110,36
110,59
112,52
112,1
115,9
122,96
121,26
114,55
111,57
110,65
109,77


Summary of computational transaction
Raw Inputview raw input (R code)
Raw Outputview raw output of R engine
Computing time2 seconds
R Server'Gwilym Jenkins' @ jenkins.wessa.net

\begin{tabular}{lllllllll}
\hline
Summary of computational transaction \tabularnewline
Raw Input & view raw input (R code)  \tabularnewline
Raw Output & view raw output of R engine  \tabularnewline
Computing time & 2 seconds \tabularnewline
R Server & 'Gwilym Jenkins' @ jenkins.wessa.net \tabularnewline
\hline
\end{tabular}
%Source: https://freestatistics.org/blog/index.php?pk=190278&T=0

[TABLE]
[ROW][C]Summary of computational transaction[/C][/ROW]
[ROW][C]Raw Input[/C][C]view raw input (R code) [/C][/ROW]
[ROW][C]Raw Output[/C][C]view raw output of R engine [/C][/ROW]
[ROW][C]Computing time[/C][C]2 seconds[/C][/ROW]
[ROW][C]R Server[/C][C]'Gwilym Jenkins' @ jenkins.wessa.net[/C][/ROW]
[/TABLE]
Source: https://freestatistics.org/blog/index.php?pk=190278&T=0

Globally Unique Identifier (entire table): ba.freestatistics.org/blog/index.php?pk=190278&T=0

As an alternative you can also use a QR Code:  

The GUIDs for individual cells are displayed in the table below:

Summary of computational transaction
Raw Inputview raw input (R code)
Raw Outputview raw output of R engine
Computing time2 seconds
R Server'Gwilym Jenkins' @ jenkins.wessa.net


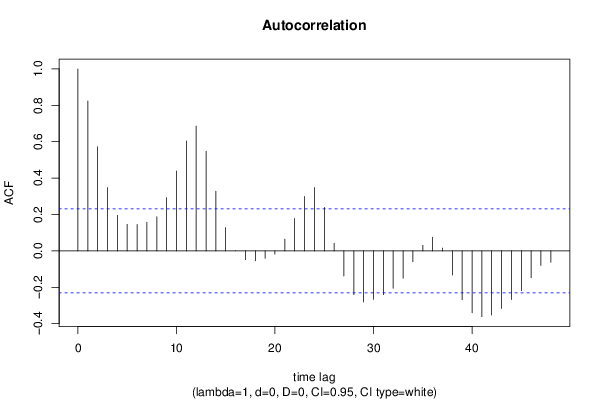
Autocorrelation Function
Time lag kACF(k)T-STATP-value
10.8243426.99480
20.5720114.85373e-06
30.3479412.95240.002128
40.1951091.65560.051082
50.1455951.23540.110346
60.1447091.22790.111743
70.1576751.33790.092567
80.1874211.59030.058072
90.2929722.48590.007621
100.4388793.7240.000193
110.6044225.12871e-06
120.685725.81850
130.5475014.64577e-06
140.3273942.7780.003485
150.1278231.08460.140855
16-6.8e-05-6e-040.499772
17-0.048016-0.40740.34245
18-0.054062-0.45870.323905
19-0.041054-0.34840.364295
20-0.018128-0.15380.439091
210.0644660.5470.29303
220.178121.51140.067532
230.2993362.540.006623
240.3479652.95260.002126
250.2380572.020.023554
260.0416560.35350.362388
27-0.138138-1.17210.122503
28-0.240321-2.03920.022551
29-0.280841-2.3830.009906
30-0.26681-2.2640.013295
31-0.240473-2.04050.022485
32-0.205715-1.74560.042577
33-0.15011-1.27370.103429
34-0.059567-0.50540.307396
350.0305090.25890.398235
360.074640.63330.264259
370.0153810.13050.448263
38-0.13279-1.12680.131793
39-0.268691-2.27990.012788
40-0.3398-2.88330.002593
41-0.361552-3.06790.001519
42-0.352871-2.99420.001885
43-0.316611-2.68650.00448
44-0.267237-2.26760.013179
45-0.218853-1.8570.033699
46-0.148003-1.25590.106615
47-0.079902-0.6780.249975
48-0.062619-0.53130.298409

\begin{tabular}{lllllllll}
\hline
Autocorrelation Function \tabularnewline
Time lag k & ACF(k) & T-STAT & P-value \tabularnewline
1 & 0.824342 & 6.9948 & 0 \tabularnewline
2 & 0.572011 & 4.8537 & 3e-06 \tabularnewline
3 & 0.347941 & 2.9524 & 0.002128 \tabularnewline
4 & 0.195109 & 1.6556 & 0.051082 \tabularnewline
5 & 0.145595 & 1.2354 & 0.110346 \tabularnewline
6 & 0.144709 & 1.2279 & 0.111743 \tabularnewline
7 & 0.157675 & 1.3379 & 0.092567 \tabularnewline
8 & 0.187421 & 1.5903 & 0.058072 \tabularnewline
9 & 0.292972 & 2.4859 & 0.007621 \tabularnewline
10 & 0.438879 & 3.724 & 0.000193 \tabularnewline
11 & 0.604422 & 5.1287 & 1e-06 \tabularnewline
12 & 0.68572 & 5.8185 & 0 \tabularnewline
13 & 0.547501 & 4.6457 & 7e-06 \tabularnewline
14 & 0.327394 & 2.778 & 0.003485 \tabularnewline
15 & 0.127823 & 1.0846 & 0.140855 \tabularnewline
16 & -6.8e-05 & -6e-04 & 0.499772 \tabularnewline
17 & -0.048016 & -0.4074 & 0.34245 \tabularnewline
18 & -0.054062 & -0.4587 & 0.323905 \tabularnewline
19 & -0.041054 & -0.3484 & 0.364295 \tabularnewline
20 & -0.018128 & -0.1538 & 0.439091 \tabularnewline
21 & 0.064466 & 0.547 & 0.29303 \tabularnewline
22 & 0.17812 & 1.5114 & 0.067532 \tabularnewline
23 & 0.299336 & 2.54 & 0.006623 \tabularnewline
24 & 0.347965 & 2.9526 & 0.002126 \tabularnewline
25 & 0.238057 & 2.02 & 0.023554 \tabularnewline
26 & 0.041656 & 0.3535 & 0.362388 \tabularnewline
27 & -0.138138 & -1.1721 & 0.122503 \tabularnewline
28 & -0.240321 & -2.0392 & 0.022551 \tabularnewline
29 & -0.280841 & -2.383 & 0.009906 \tabularnewline
30 & -0.26681 & -2.264 & 0.013295 \tabularnewline
31 & -0.240473 & -2.0405 & 0.022485 \tabularnewline
32 & -0.205715 & -1.7456 & 0.042577 \tabularnewline
33 & -0.15011 & -1.2737 & 0.103429 \tabularnewline
34 & -0.059567 & -0.5054 & 0.307396 \tabularnewline
35 & 0.030509 & 0.2589 & 0.398235 \tabularnewline
36 & 0.07464 & 0.6333 & 0.264259 \tabularnewline
37 & 0.015381 & 0.1305 & 0.448263 \tabularnewline
38 & -0.13279 & -1.1268 & 0.131793 \tabularnewline
39 & -0.268691 & -2.2799 & 0.012788 \tabularnewline
40 & -0.3398 & -2.8833 & 0.002593 \tabularnewline
41 & -0.361552 & -3.0679 & 0.001519 \tabularnewline
42 & -0.352871 & -2.9942 & 0.001885 \tabularnewline
43 & -0.316611 & -2.6865 & 0.00448 \tabularnewline
44 & -0.267237 & -2.2676 & 0.013179 \tabularnewline
45 & -0.218853 & -1.857 & 0.033699 \tabularnewline
46 & -0.148003 & -1.2559 & 0.106615 \tabularnewline
47 & -0.079902 & -0.678 & 0.249975 \tabularnewline
48 & -0.062619 & -0.5313 & 0.298409 \tabularnewline
\hline
\end{tabular}
%Source: https://freestatistics.org/blog/index.php?pk=190278&T=1

[TABLE]
[ROW][C]Autocorrelation Function[/C][/ROW]
[ROW][C]Time lag k[/C][C]ACF(k)[/C][C]T-STAT[/C][C]P-value[/C][/ROW]
[ROW][C]1[/C][C]0.824342[/C][C]6.9948[/C][C]0[/C][/ROW]
[ROW][C]2[/C][C]0.572011[/C][C]4.8537[/C][C]3e-06[/C][/ROW]
[ROW][C]3[/C][C]0.347941[/C][C]2.9524[/C][C]0.002128[/C][/ROW]
[ROW][C]4[/C][C]0.195109[/C][C]1.6556[/C][C]0.051082[/C][/ROW]
[ROW][C]5[/C][C]0.145595[/C][C]1.2354[/C][C]0.110346[/C][/ROW]
[ROW][C]6[/C][C]0.144709[/C][C]1.2279[/C][C]0.111743[/C][/ROW]
[ROW][C]7[/C][C]0.157675[/C][C]1.3379[/C][C]0.092567[/C][/ROW]
[ROW][C]8[/C][C]0.187421[/C][C]1.5903[/C][C]0.058072[/C][/ROW]
[ROW][C]9[/C][C]0.292972[/C][C]2.4859[/C][C]0.007621[/C][/ROW]
[ROW][C]10[/C][C]0.438879[/C][C]3.724[/C][C]0.000193[/C][/ROW]
[ROW][C]11[/C][C]0.604422[/C][C]5.1287[/C][C]1e-06[/C][/ROW]
[ROW][C]12[/C][C]0.68572[/C][C]5.8185[/C][C]0[/C][/ROW]
[ROW][C]13[/C][C]0.547501[/C][C]4.6457[/C][C]7e-06[/C][/ROW]
[ROW][C]14[/C][C]0.327394[/C][C]2.778[/C][C]0.003485[/C][/ROW]
[ROW][C]15[/C][C]0.127823[/C][C]1.0846[/C][C]0.140855[/C][/ROW]
[ROW][C]16[/C][C]-6.8e-05[/C][C]-6e-04[/C][C]0.499772[/C][/ROW]
[ROW][C]17[/C][C]-0.048016[/C][C]-0.4074[/C][C]0.34245[/C][/ROW]
[ROW][C]18[/C][C]-0.054062[/C][C]-0.4587[/C][C]0.323905[/C][/ROW]
[ROW][C]19[/C][C]-0.041054[/C][C]-0.3484[/C][C]0.364295[/C][/ROW]
[ROW][C]20[/C][C]-0.018128[/C][C]-0.1538[/C][C]0.439091[/C][/ROW]
[ROW][C]21[/C][C]0.064466[/C][C]0.547[/C][C]0.29303[/C][/ROW]
[ROW][C]22[/C][C]0.17812[/C][C]1.5114[/C][C]0.067532[/C][/ROW]
[ROW][C]23[/C][C]0.299336[/C][C]2.54[/C][C]0.006623[/C][/ROW]
[ROW][C]24[/C][C]0.347965[/C][C]2.9526[/C][C]0.002126[/C][/ROW]
[ROW][C]25[/C][C]0.238057[/C][C]2.02[/C][C]0.023554[/C][/ROW]
[ROW][C]26[/C][C]0.041656[/C][C]0.3535[/C][C]0.362388[/C][/ROW]
[ROW][C]27[/C][C]-0.138138[/C][C]-1.1721[/C][C]0.122503[/C][/ROW]
[ROW][C]28[/C][C]-0.240321[/C][C]-2.0392[/C][C]0.022551[/C][/ROW]
[ROW][C]29[/C][C]-0.280841[/C][C]-2.383[/C][C]0.009906[/C][/ROW]
[ROW][C]30[/C][C]-0.26681[/C][C]-2.264[/C][C]0.013295[/C][/ROW]
[ROW][C]31[/C][C]-0.240473[/C][C]-2.0405[/C][C]0.022485[/C][/ROW]
[ROW][C]32[/C][C]-0.205715[/C][C]-1.7456[/C][C]0.042577[/C][/ROW]
[ROW][C]33[/C][C]-0.15011[/C][C]-1.2737[/C][C]0.103429[/C][/ROW]
[ROW][C]34[/C][C]-0.059567[/C][C]-0.5054[/C][C]0.307396[/C][/ROW]
[ROW][C]35[/C][C]0.030509[/C][C]0.2589[/C][C]0.398235[/C][/ROW]
[ROW][C]36[/C][C]0.07464[/C][C]0.6333[/C][C]0.264259[/C][/ROW]
[ROW][C]37[/C][C]0.015381[/C][C]0.1305[/C][C]0.448263[/C][/ROW]
[ROW][C]38[/C][C]-0.13279[/C][C]-1.1268[/C][C]0.131793[/C][/ROW]
[ROW][C]39[/C][C]-0.268691[/C][C]-2.2799[/C][C]0.012788[/C][/ROW]
[ROW][C]40[/C][C]-0.3398[/C][C]-2.8833[/C][C]0.002593[/C][/ROW]
[ROW][C]41[/C][C]-0.361552[/C][C]-3.0679[/C][C]0.001519[/C][/ROW]
[ROW][C]42[/C][C]-0.352871[/C][C]-2.9942[/C][C]0.001885[/C][/ROW]
[ROW][C]43[/C][C]-0.316611[/C][C]-2.6865[/C][C]0.00448[/C][/ROW]
[ROW][C]44[/C][C]-0.267237[/C][C]-2.2676[/C][C]0.013179[/C][/ROW]
[ROW][C]45[/C][C]-0.218853[/C][C]-1.857[/C][C]0.033699[/C][/ROW]
[ROW][C]46[/C][C]-0.148003[/C][C]-1.2559[/C][C]0.106615[/C][/ROW]
[ROW][C]47[/C][C]-0.079902[/C][C]-0.678[/C][C]0.249975[/C][/ROW]
[ROW][C]48[/C][C]-0.062619[/C][C]-0.5313[/C][C]0.298409[/C][/ROW]
[/TABLE]
Source: https://freestatistics.org/blog/index.php?pk=190278&T=1

Globally Unique Identifier (entire table): ba.freestatistics.org/blog/index.php?pk=190278&T=1

As an alternative you can also use a QR Code:  

The GUIDs for individual cells are displayed in the table below:

Autocorrelation Function
Time lag kACF(k)T-STATP-value
10.8243426.99480
20.5720114.85373e-06
30.3479412.95240.002128
40.1951091.65560.051082
50.1455951.23540.110346
60.1447091.22790.111743
70.1576751.33790.092567
80.1874211.59030.058072
90.2929722.48590.007621
100.4388793.7240.000193
110.6044225.12871e-06
120.685725.81850
130.5475014.64577e-06
140.3273942.7780.003485
150.1278231.08460.140855
16-6.8e-05-6e-040.499772
17-0.048016-0.40740.34245
18-0.054062-0.45870.323905
19-0.041054-0.34840.364295
20-0.018128-0.15380.439091
210.0644660.5470.29303
220.178121.51140.067532
230.2993362.540.006623
240.3479652.95260.002126
250.2380572.020.023554
260.0416560.35350.362388
27-0.138138-1.17210.122503
28-0.240321-2.03920.022551
29-0.280841-2.3830.009906
30-0.26681-2.2640.013295
31-0.240473-2.04050.022485
32-0.205715-1.74560.042577
33-0.15011-1.27370.103429
34-0.059567-0.50540.307396
350.0305090.25890.398235
360.074640.63330.264259
370.0153810.13050.448263
38-0.13279-1.12680.131793
39-0.268691-2.27990.012788
40-0.3398-2.88330.002593
41-0.361552-3.06790.001519
42-0.352871-2.99420.001885
43-0.316611-2.68650.00448
44-0.267237-2.26760.013179
45-0.218853-1.8570.033699
46-0.148003-1.25590.106615
47-0.079902-0.6780.249975
48-0.062619-0.53130.298409


Partial Autocorrelation Function
Time lag kPACF(k)T-STATP-value
10.8243426.99480
2-0.335547-2.84720.002872
3-0.018313-0.15540.438474
40.0340590.2890.386706
50.1464791.24290.108965
6-0.002997-0.02540.489892
70.0226360.19210.424113
80.0992550.84220.201231
90.3333772.82880.003024
100.2001331.69820.046896
110.3031062.57190.006088
120.0320790.27220.393122
13-0.420076-3.56450.000326
14-0.06068-0.51490.304105
15-0.00109-0.00920.496323
16-0.038823-0.32940.371394
17-0.124374-1.05530.147397
18-0.135054-1.1460.127801
19-0.014275-0.12110.451964
20-0.050003-0.42430.33631
210.00870.07380.470678
22-0.035008-0.2970.383642
23-0.006592-0.05590.477773
240.0073670.06250.475163
25-0.051935-0.44070.330381
26-0.100793-0.85530.197624
27-0.018917-0.16050.43646
280.0146080.1240.450849
29-0.065878-0.5590.288951
300.0230970.1960.422587
31-0.049912-0.42350.33659
320.0089210.07570.469935
33-0.124775-1.05880.146626
340.0430350.36520.35803
35-0.043844-0.3720.355483
360.0685650.58180.281263
370.0360270.30570.380358
38-0.03665-0.3110.378354
390.0253240.21490.415235
400.0453250.38460.350835
41-0.019352-0.16420.435015
42-0.092037-0.7810.218693
430.0447480.37970.352642
440.0534610.45360.32573
45-0.06807-0.57760.28267
46-0.06158-0.52250.301454
47-0.032811-0.27840.390746
48-0.110052-0.93380.176759

\begin{tabular}{lllllllll}
\hline
Partial Autocorrelation Function \tabularnewline
Time lag k & PACF(k) & T-STAT & P-value \tabularnewline
1 & 0.824342 & 6.9948 & 0 \tabularnewline
2 & -0.335547 & -2.8472 & 0.002872 \tabularnewline
3 & -0.018313 & -0.1554 & 0.438474 \tabularnewline
4 & 0.034059 & 0.289 & 0.386706 \tabularnewline
5 & 0.146479 & 1.2429 & 0.108965 \tabularnewline
6 & -0.002997 & -0.0254 & 0.489892 \tabularnewline
7 & 0.022636 & 0.1921 & 0.424113 \tabularnewline
8 & 0.099255 & 0.8422 & 0.201231 \tabularnewline
9 & 0.333377 & 2.8288 & 0.003024 \tabularnewline
10 & 0.200133 & 1.6982 & 0.046896 \tabularnewline
11 & 0.303106 & 2.5719 & 0.006088 \tabularnewline
12 & 0.032079 & 0.2722 & 0.393122 \tabularnewline
13 & -0.420076 & -3.5645 & 0.000326 \tabularnewline
14 & -0.06068 & -0.5149 & 0.304105 \tabularnewline
15 & -0.00109 & -0.0092 & 0.496323 \tabularnewline
16 & -0.038823 & -0.3294 & 0.371394 \tabularnewline
17 & -0.124374 & -1.0553 & 0.147397 \tabularnewline
18 & -0.135054 & -1.146 & 0.127801 \tabularnewline
19 & -0.014275 & -0.1211 & 0.451964 \tabularnewline
20 & -0.050003 & -0.4243 & 0.33631 \tabularnewline
21 & 0.0087 & 0.0738 & 0.470678 \tabularnewline
22 & -0.035008 & -0.297 & 0.383642 \tabularnewline
23 & -0.006592 & -0.0559 & 0.477773 \tabularnewline
24 & 0.007367 & 0.0625 & 0.475163 \tabularnewline
25 & -0.051935 & -0.4407 & 0.330381 \tabularnewline
26 & -0.100793 & -0.8553 & 0.197624 \tabularnewline
27 & -0.018917 & -0.1605 & 0.43646 \tabularnewline
28 & 0.014608 & 0.124 & 0.450849 \tabularnewline
29 & -0.065878 & -0.559 & 0.288951 \tabularnewline
30 & 0.023097 & 0.196 & 0.422587 \tabularnewline
31 & -0.049912 & -0.4235 & 0.33659 \tabularnewline
32 & 0.008921 & 0.0757 & 0.469935 \tabularnewline
33 & -0.124775 & -1.0588 & 0.146626 \tabularnewline
34 & 0.043035 & 0.3652 & 0.35803 \tabularnewline
35 & -0.043844 & -0.372 & 0.355483 \tabularnewline
36 & 0.068565 & 0.5818 & 0.281263 \tabularnewline
37 & 0.036027 & 0.3057 & 0.380358 \tabularnewline
38 & -0.03665 & -0.311 & 0.378354 \tabularnewline
39 & 0.025324 & 0.2149 & 0.415235 \tabularnewline
40 & 0.045325 & 0.3846 & 0.350835 \tabularnewline
41 & -0.019352 & -0.1642 & 0.435015 \tabularnewline
42 & -0.092037 & -0.781 & 0.218693 \tabularnewline
43 & 0.044748 & 0.3797 & 0.352642 \tabularnewline
44 & 0.053461 & 0.4536 & 0.32573 \tabularnewline
45 & -0.06807 & -0.5776 & 0.28267 \tabularnewline
46 & -0.06158 & -0.5225 & 0.301454 \tabularnewline
47 & -0.032811 & -0.2784 & 0.390746 \tabularnewline
48 & -0.110052 & -0.9338 & 0.176759 \tabularnewline
\hline
\end{tabular}
%Source: https://freestatistics.org/blog/index.php?pk=190278&T=2

[TABLE]
[ROW][C]Partial Autocorrelation Function[/C][/ROW]
[ROW][C]Time lag k[/C][C]PACF(k)[/C][C]T-STAT[/C][C]P-value[/C][/ROW]
[ROW][C]1[/C][C]0.824342[/C][C]6.9948[/C][C]0[/C][/ROW]
[ROW][C]2[/C][C]-0.335547[/C][C]-2.8472[/C][C]0.002872[/C][/ROW]
[ROW][C]3[/C][C]-0.018313[/C][C]-0.1554[/C][C]0.438474[/C][/ROW]
[ROW][C]4[/C][C]0.034059[/C][C]0.289[/C][C]0.386706[/C][/ROW]
[ROW][C]5[/C][C]0.146479[/C][C]1.2429[/C][C]0.108965[/C][/ROW]
[ROW][C]6[/C][C]-0.002997[/C][C]-0.0254[/C][C]0.489892[/C][/ROW]
[ROW][C]7[/C][C]0.022636[/C][C]0.1921[/C][C]0.424113[/C][/ROW]
[ROW][C]8[/C][C]0.099255[/C][C]0.8422[/C][C]0.201231[/C][/ROW]
[ROW][C]9[/C][C]0.333377[/C][C]2.8288[/C][C]0.003024[/C][/ROW]
[ROW][C]10[/C][C]0.200133[/C][C]1.6982[/C][C]0.046896[/C][/ROW]
[ROW][C]11[/C][C]0.303106[/C][C]2.5719[/C][C]0.006088[/C][/ROW]
[ROW][C]12[/C][C]0.032079[/C][C]0.2722[/C][C]0.393122[/C][/ROW]
[ROW][C]13[/C][C]-0.420076[/C][C]-3.5645[/C][C]0.000326[/C][/ROW]
[ROW][C]14[/C][C]-0.06068[/C][C]-0.5149[/C][C]0.304105[/C][/ROW]
[ROW][C]15[/C][C]-0.00109[/C][C]-0.0092[/C][C]0.496323[/C][/ROW]
[ROW][C]16[/C][C]-0.038823[/C][C]-0.3294[/C][C]0.371394[/C][/ROW]
[ROW][C]17[/C][C]-0.124374[/C][C]-1.0553[/C][C]0.147397[/C][/ROW]
[ROW][C]18[/C][C]-0.135054[/C][C]-1.146[/C][C]0.127801[/C][/ROW]
[ROW][C]19[/C][C]-0.014275[/C][C]-0.1211[/C][C]0.451964[/C][/ROW]
[ROW][C]20[/C][C]-0.050003[/C][C]-0.4243[/C][C]0.33631[/C][/ROW]
[ROW][C]21[/C][C]0.0087[/C][C]0.0738[/C][C]0.470678[/C][/ROW]
[ROW][C]22[/C][C]-0.035008[/C][C]-0.297[/C][C]0.383642[/C][/ROW]
[ROW][C]23[/C][C]-0.006592[/C][C]-0.0559[/C][C]0.477773[/C][/ROW]
[ROW][C]24[/C][C]0.007367[/C][C]0.0625[/C][C]0.475163[/C][/ROW]
[ROW][C]25[/C][C]-0.051935[/C][C]-0.4407[/C][C]0.330381[/C][/ROW]
[ROW][C]26[/C][C]-0.100793[/C][C]-0.8553[/C][C]0.197624[/C][/ROW]
[ROW][C]27[/C][C]-0.018917[/C][C]-0.1605[/C][C]0.43646[/C][/ROW]
[ROW][C]28[/C][C]0.014608[/C][C]0.124[/C][C]0.450849[/C][/ROW]
[ROW][C]29[/C][C]-0.065878[/C][C]-0.559[/C][C]0.288951[/C][/ROW]
[ROW][C]30[/C][C]0.023097[/C][C]0.196[/C][C]0.422587[/C][/ROW]
[ROW][C]31[/C][C]-0.049912[/C][C]-0.4235[/C][C]0.33659[/C][/ROW]
[ROW][C]32[/C][C]0.008921[/C][C]0.0757[/C][C]0.469935[/C][/ROW]
[ROW][C]33[/C][C]-0.124775[/C][C]-1.0588[/C][C]0.146626[/C][/ROW]
[ROW][C]34[/C][C]0.043035[/C][C]0.3652[/C][C]0.35803[/C][/ROW]
[ROW][C]35[/C][C]-0.043844[/C][C]-0.372[/C][C]0.355483[/C][/ROW]
[ROW][C]36[/C][C]0.068565[/C][C]0.5818[/C][C]0.281263[/C][/ROW]
[ROW][C]37[/C][C]0.036027[/C][C]0.3057[/C][C]0.380358[/C][/ROW]
[ROW][C]38[/C][C]-0.03665[/C][C]-0.311[/C][C]0.378354[/C][/ROW]
[ROW][C]39[/C][C]0.025324[/C][C]0.2149[/C][C]0.415235[/C][/ROW]
[ROW][C]40[/C][C]0.045325[/C][C]0.3846[/C][C]0.350835[/C][/ROW]
[ROW][C]41[/C][C]-0.019352[/C][C]-0.1642[/C][C]0.435015[/C][/ROW]
[ROW][C]42[/C][C]-0.092037[/C][C]-0.781[/C][C]0.218693[/C][/ROW]
[ROW][C]43[/C][C]0.044748[/C][C]0.3797[/C][C]0.352642[/C][/ROW]
[ROW][C]44[/C][C]0.053461[/C][C]0.4536[/C][C]0.32573[/C][/ROW]
[ROW][C]45[/C][C]-0.06807[/C][C]-0.5776[/C][C]0.28267[/C][/ROW]
[ROW][C]46[/C][C]-0.06158[/C][C]-0.5225[/C][C]0.301454[/C][/ROW]
[ROW][C]47[/C][C]-0.032811[/C][C]-0.2784[/C][C]0.390746[/C][/ROW]
[ROW][C]48[/C][C]-0.110052[/C][C]-0.9338[/C][C]0.176759[/C][/ROW]
[/TABLE]
Source: https://freestatistics.org/blog/index.php?pk=190278&T=2

Globally Unique Identifier (entire table): ba.freestatistics.org/blog/index.php?pk=190278&T=2

As an alternative you can also use a QR Code:  

The GUIDs for individual cells are displayed in the table below:

Partial Autocorrelation Function
Time lag kPACF(k)T-STATP-value
10.8243426.99480
2-0.335547-2.84720.002872
3-0.018313-0.15540.438474
40.0340590.2890.386706
50.1464791.24290.108965
6-0.002997-0.02540.489892
70.0226360.19210.424113
80.0992550.84220.201231
90.3333772.82880.003024
100.2001331.69820.046896
110.3031062.57190.006088
120.0320790.27220.393122
13-0.420076-3.56450.000326
14-0.06068-0.51490.304105
15-0.00109-0.00920.496323
16-0.038823-0.32940.371394
17-0.124374-1.05530.147397
18-0.135054-1.1460.127801
19-0.014275-0.12110.451964
20-0.050003-0.42430.33631
210.00870.07380.470678
22-0.035008-0.2970.383642
23-0.006592-0.05590.477773
240.0073670.06250.475163
25-0.051935-0.44070.330381
26-0.100793-0.85530.197624
27-0.018917-0.16050.43646
280.0146080.1240.450849
29-0.065878-0.5590.288951
300.0230970.1960.422587
31-0.049912-0.42350.33659
320.0089210.07570.469935
33-0.124775-1.05880.146626
340.0430350.36520.35803
35-0.043844-0.3720.355483
360.0685650.58180.281263
370.0360270.30570.380358
38-0.03665-0.3110.378354
390.0253240.21490.415235
400.0453250.38460.350835
41-0.019352-0.16420.435015
42-0.092037-0.7810.218693
430.0447480.37970.352642
440.0534610.45360.32573
45-0.06807-0.57760.28267
46-0.06158-0.52250.301454
47-0.032811-0.27840.390746
48-0.110052-0.93380.176759


Parameters (Session):
par1 = 48 ; par2 = 1 ; par3 = 0 ; par4 = 0 ; par5 = 12 ; par6 = White Noise ; par7 = 0.95 ;
Parameters (R input):
par1 = 48 ; par2 = 1 ; par3 = 0 ; par4 = 0 ; par5 = 12 ; par6 = White Noise ; par7 = 0.95 ; par8 = ;
R code (references can be found in the software module):
if (par1 == 'Default') {
par1 = 10*log10(length(x))
} else {
par1 <- as.numeric(par1)
}
par2 <- as.numeric(par2)
par3 <- as.numeric(par3)
par4 <- as.numeric(par4)
par5 <- as.numeric(par5)
if (par6 == 'White Noise') par6 <- 'white' else par6 <- 'ma'
par7 <- as.numeric(par7)
if (par8 != '') par8 <- as.numeric(par8)
ox <- x
if (par8 == '') {
if (par2 == 0) {
x <- log(x)
} else {
x <- (x ^ par2 - 1) / par2
}
} else {
x <- log(x,base=par8)
}
if (par3 > 0) x <- diff(x,lag=1,difference=par3)
if (par4 > 0) x <- diff(x,lag=par5,difference=par4)
bitmap(file='picts.png')
op <- par(mfrow=c(2,1))
plot(ox,type='l',main='Original Time Series',xlab='time',ylab='value')
if (par8=='') {
mytitle <- paste('Working Time Series (lambda=',par2,', d=',par3,', D=',par4,')',sep='')
mysub <- paste('(lambda=',par2,', d=',par3,', D=',par4,', CI=', par7, ', CI type=',par6,')',sep='')
} else {
mytitle <- paste('Working Time Series (base=',par8,', d=',par3,', D=',par4,')',sep='')
mysub <- paste('(base=',par8,', d=',par3,', D=',par4,', CI=', par7, ', CI type=',par6,')',sep='')
}
plot(x,type='l', main=mytitle,xlab='time',ylab='value')
par(op)
dev.off()
bitmap(file='pic1.png')
racf <- acf(x, par1, main='Autocorrelation', xlab='time lag', ylab='ACF', ci.type=par6, ci=par7, sub=mysub)
dev.off()
bitmap(file='pic2.png')
rpacf <- pacf(x,par1,main='Partial Autocorrelation',xlab='lags',ylab='PACF',sub=mysub)
dev.off()
(myacf <- c(racf$acf))
(mypacf <- c(rpacf$acf))
lengthx <- length(x)
sqrtn <- sqrt(lengthx)
load(file='createtable')
a<-table.start()
a<-table.row.start(a)
a<-table.element(a,'Autocorrelation Function',4,TRUE)
a<-table.row.end(a)
a<-table.row.start(a)
a<-table.element(a,'Time lag k',header=TRUE)
a<-table.element(a,hyperlink('basics.htm','ACF(k)','click here for more information about the Autocorrelation Function'),header=TRUE)
a<-table.element(a,'T-STAT',header=TRUE)
a<-table.element(a,'P-value',header=TRUE)
a<-table.row.end(a)
for (i in 2:(par1+1)) {
a<-table.row.start(a)
a<-table.element(a,i-1,header=TRUE)
a<-table.element(a,round(myacf[i],6))
mytstat <- myacf[i]*sqrtn
a<-table.element(a,round(mytstat,4))
a<-table.element(a,round(1-pt(abs(mytstat),lengthx),6))
a<-table.row.end(a)
}
a<-table.end(a)
table.save(a,file='mytable.tab')
a<-table.start()
a<-table.row.start(a)
a<-table.element(a,'Partial Autocorrelation Function',4,TRUE)
a<-table.row.end(a)
a<-table.row.start(a)
a<-table.element(a,'Time lag k',header=TRUE)
a<-table.element(a,hyperlink('basics.htm','PACF(k)','click here for more information about the Partial Autocorrelation Function'),header=TRUE)
a<-table.element(a,'T-STAT',header=TRUE)
a<-table.element(a,'P-value',header=TRUE)
a<-table.row.end(a)
for (i in 1:par1) {
a<-table.row.start(a)
a<-table.element(a,i,header=TRUE)
a<-table.element(a,round(mypacf[i],6))
mytstat <- mypacf[i]*sqrtn
a<-table.element(a,round(mytstat,4))
a<-table.element(a,round(1-pt(abs(mytstat),lengthx),6))
a<-table.row.end(a)
}
a<-table.end(a)
table.save(a,file='mytable1.tab')