| Multiple Linear Regression - Estimated Regression Equation |
| Y[t] = + 6.71293311609556 -0.00434576257047783X[t] -0.00311525976549906t + e[t] |
| Multiple Linear Regression - Ordinary Least Squares | |||||
| Variable | Parameter | S.D. | T-STAT H0: parameter = 0 | 2-tail p-value | 1-tail p-value |
| (Intercept) | 6.71293311609556 | 0.191969 | 34.9688 | 0 | 0 |
| X | -0.00434576257047783 | 0.010684 | -0.4068 | 0.685704 | 0.342852 |
| t | -0.00311525976549906 | 0.003528 | -0.883 | 0.380959 | 0.19048 |
| Multiple Linear Regression - Regression Statistics | |
| Multiple R | 0.119722042525619 |
| R-squared | 0.0143333674665061 |
| Adjusted R-squared | -0.0202514266574763 |
| F-TEST (value) | 0.414441312419636 |
| F-TEST (DF numerator) | 2 |
| F-TEST (DF denominator) | 57 |
| p-value | 0.662684115741832 |
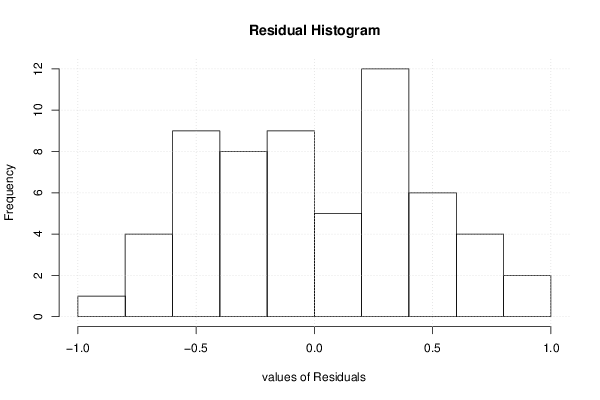
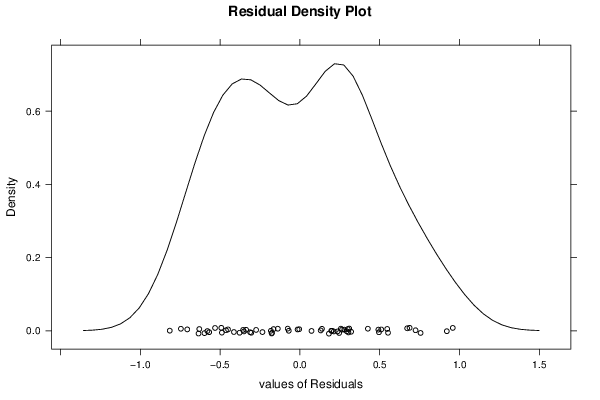
| Multiple Linear Regression - Residual Statistics | |
| Residual Standard Deviation | 0.462189079316172 |
| Sum Squared Residuals | 12.1762684672304 |
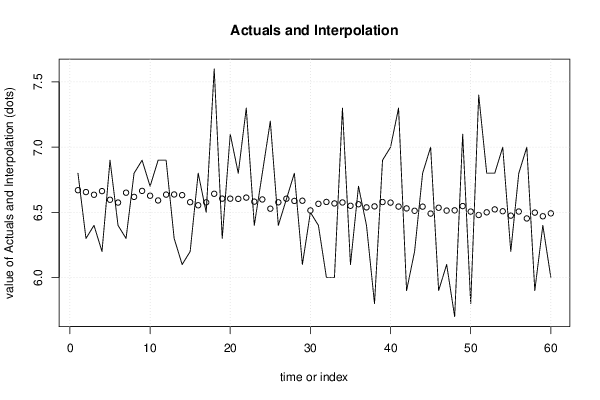
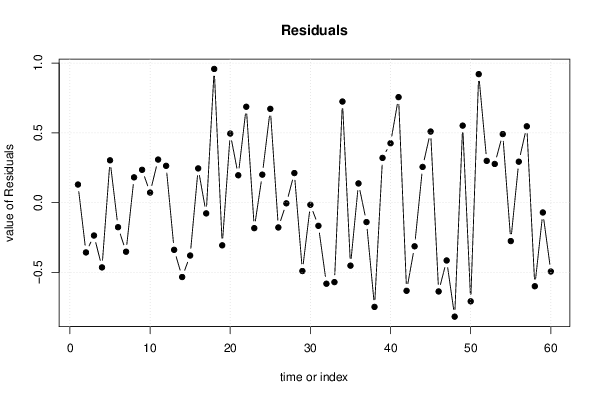
| Multiple Linear Regression - Actuals, Interpolation, and Residuals | |||
| Time or Index | Actuals | Interpolation Forecast | Residuals Prediction Error |
| 1 | 6.8 | 6.66983684068165 | 0.130163159318352 |
| 2 | 6.3 | 6.65585717448997 | -0.355857174489968 |
| 3 | 6.4 | 6.63492428818551 | -0.23492428818551 |
| 4 | 6.2 | 6.66309851892745 | -0.463098518927451 |
| 5 | 6.9 | 6.59653512563298 | 0.303464874367024 |
| 6 | 6.4 | 6.57516766307147 | -0.17516766307147 |
| 7 | 6.3 | 6.65071070583162 | -0.35071070583162 |
| 8 | 6.8 | 6.61847883684392 | 0.181521163156081 |
| 9 | 6.9 | 6.66447069412482 | 0.235529305875181 |
| 10 | 6.7 | 6.62745848630959 | 0.0725415136904068 |
| 11 | 6.9 | 6.59131543100846 | 0.308684568991538 |
| 12 | 6.9 | 6.63600355951822 | 0.26399644048178 |
| 13 | 6.3 | 6.6372340623232 | -0.337234062323199 |
| 14 | 6.1 | 6.63194592127246 | -0.531945921272461 |
| 15 | 6.2 | 6.57798523943237 | -0.377985239432371 |
| 16 | 6.8 | 6.55444489558563 | 0.245555104414374 |
| 17 | 6.5 | 6.5765350587289 | -0.0765350587288985 |
| 18 | 7.6 | 6.642517423834 | 0.957482576166003 |
| 19 | 6.3 | 6.60507063976172 | -0.305070639761723 |
| 20 | 7.1 | 6.60499741379556 | 0.495002586204441 |
| 21 | 6.8 | 6.60362045905825 | 0.196379540941749 |
| 22 | 7.3 | 6.61310791074714 | 0.686892089252863 |
| 23 | 6.4 | 6.58217977053058 | -0.18217977053058 |
| 24 | 6.8 | 6.59905501858928 | 0.200944981410721 |
| 25 | 7.2 | 6.52814586272433 | 0.671854137275675 |
| 26 | 6.4 | 6.57717975380456 | -0.17717975380456 |
| 27 | 6.6 | 6.60448483203241 | -0.00448483203240671 |
| 28 | 6.8 | 6.58789770829843 | 0.212102291701574 |
| 29 | 6.1 | 6.5891282111034 | -0.489128211103405 |
| 30 | 6.5 | 6.51474244518207 | -0.0147424451820692 |
| 31 | 6.4 | 6.5655146412905 | -0.165514641290495 |
| 32 | 6 | 6.57978243180691 | -0.579782431806907 |
| 33 | 6 | 6.5684102231575 | -0.568410223157501 |
| 34 | 7.3 | 6.57572479356115 | 0.724275206438851 |
| 35 | 6.1 | 6.55044614468621 | -0.450446144686213 |
| 36 | 6.7 | 6.56210647766034 | 0.137893522339662 |
| 37 | 6.4 | 6.53856613381359 | -0.138566133813593 |
| 38 | 5.8 | 6.54588070421724 | -0.745880704217241 |
| 39 | 6.9 | 6.57926985004376 | 0.320730149956245 |
| 40 | 7 | 6.57441628525007 | 0.425583714749935 |
| 41 | 7.3 | 6.5443572975476 | 0.755642702452396 |
| 42 | 5.9 | 6.53037763135591 | -0.63037763135591 |
| 43 | 6.2 | 6.51205220259374 | -0.312052202593738 |
| 44 | 6.8 | 6.54370304339206 | 0.256296956607938 |
| 45 | 7 | 6.49061151406607 | 0.509388485933932 |
| 46 | 5.9 | 6.53529964257582 | -0.635299642575825 |
| 47 | 6.1 | 6.51349760375727 | -0.413497603757272 |
| 48 | 5.7 | 6.51559725907635 | -0.815597259076345 |
| 49 | 7.1 | 6.54811725238876 | 0.551882747611235 |
| 50 | 5.8 | 6.50589012948897 | -0.705890129488965 |
| 51 | 7.4 | 6.47974232809993 | 0.920257671900067 |
| 52 | 6.8 | 6.50052876247206 | 0.299471237527937 |
| 53 | 6.8 | 6.52261892561534 | 0.277381074384665 |
| 54 | 7 | 6.50863925942364 | 0.491360740576358 |
| 55 | 6.2 | 6.47466908540775 | -0.27466908540775 |
| 56 | 6.8 | 6.50631992620607 | 0.293680073793926 |
| 57 | 7 | 6.45322839688008 | 0.546771603119921 |
| 58 | 5.9 | 6.49791652538984 | -0.597916525389836 |
| 59 | 6.4 | 6.47003041897261 | -0.0700304189726133 |
| 60 | 6 | 6.49255515837293 | -0.492555158372934 |
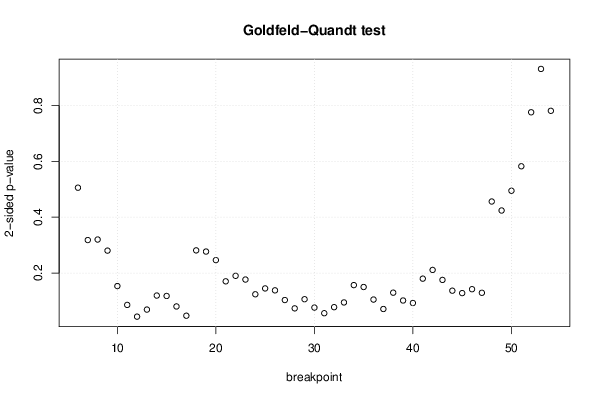
| Goldfeld-Quandt test for Heteroskedasticity | |||
| p-values | Alternative Hypothesis | ||
| breakpoint index | greater | 2-sided | less |
| 6 | 0.252685689653677 | 0.505371379307354 | 0.747314310346323 |
| 7 | 0.159075410535965 | 0.31815082107193 | 0.840924589464035 |
| 8 | 0.159977442273363 | 0.319954884546727 | 0.840022557726637 |
| 9 | 0.140137455605795 | 0.280274911211591 | 0.859862544394205 |
| 10 | 0.0767106022721175 | 0.153421204544235 | 0.923289397727883 |
| 11 | 0.0430279135021628 | 0.0860558270043257 | 0.956972086497837 |
| 12 | 0.0220412835061009 | 0.0440825670122017 | 0.977958716493899 |
| 13 | 0.0346991826757099 | 0.0693983653514199 | 0.96530081732429 |
| 14 | 0.0597851839054805 | 0.119570367810961 | 0.940214816094519 |
| 15 | 0.0590798568959308 | 0.118159713791862 | 0.940920143104069 |
| 16 | 0.0402758144210909 | 0.0805516288421818 | 0.959724185578909 |
| 17 | 0.0236970948515937 | 0.0473941897031874 | 0.976302905148406 |
| 18 | 0.140593197672948 | 0.281186395345896 | 0.859406802327052 |
| 19 | 0.138471926113383 | 0.276943852226766 | 0.861528073886617 |
| 20 | 0.123183178919042 | 0.246366357838084 | 0.876816821080958 |
| 21 | 0.0852483495547953 | 0.170496699109591 | 0.914751650445205 |
| 22 | 0.0950593425472566 | 0.190118685094513 | 0.904940657452743 |
| 23 | 0.0884222855108155 | 0.176844571021631 | 0.911577714489185 |
| 24 | 0.0620722234286096 | 0.124144446857219 | 0.93792777657139 |
| 25 | 0.0725480298863156 | 0.145096059772631 | 0.927451970113684 |
| 26 | 0.0691177860876155 | 0.138235572175231 | 0.930882213912385 |
| 27 | 0.051759561343707 | 0.103519122687414 | 0.948240438656293 |
| 28 | 0.0368663374681968 | 0.0737326749363936 | 0.963133662531803 |
| 29 | 0.0532024045081747 | 0.106404809016349 | 0.946797595491825 |
| 30 | 0.0382568480002326 | 0.0765136960004652 | 0.961743151999767 |
| 31 | 0.0281712190976611 | 0.0563424381953221 | 0.971828780902339 |
| 32 | 0.0389719578943813 | 0.0779439157887625 | 0.961028042105619 |
| 33 | 0.0474587742672167 | 0.0949175485344333 | 0.952541225732783 |
| 34 | 0.0784811484594098 | 0.15696229691882 | 0.92151885154059 |
| 35 | 0.0750568720277571 | 0.150113744055514 | 0.924943127972243 |
| 36 | 0.052630185660726 | 0.105260371321452 | 0.947369814339274 |
| 37 | 0.0357279124737714 | 0.0714558249475427 | 0.964272087526229 |
| 38 | 0.0649262832552645 | 0.129852566510529 | 0.935073716744735 |
| 39 | 0.0509412594528096 | 0.101882518905619 | 0.94905874054719 |
| 40 | 0.046448673597845 | 0.09289734719569 | 0.953551326402155 |
| 41 | 0.0899951128633846 | 0.179990225726769 | 0.910004887136615 |
| 42 | 0.105607949705957 | 0.211215899411913 | 0.894392050294043 |
| 43 | 0.0877488744015966 | 0.175497748803193 | 0.912251125598403 |
| 44 | 0.0684700330422258 | 0.136940066084452 | 0.931529966957774 |
| 45 | 0.0641855395046121 | 0.128371079009224 | 0.935814460495388 |
| 46 | 0.071131289610224 | 0.142262579220448 | 0.928868710389776 |
| 47 | 0.0647245300970261 | 0.129449060194052 | 0.935275469902974 |
| 48 | 0.227998924038653 | 0.455997848077306 | 0.772001075961347 |
| 49 | 0.211922679264572 | 0.423845358529144 | 0.788077320735428 |
| 50 | 0.752764574022909 | 0.494470851954183 | 0.247235425977091 |
| 51 | 0.708967750316456 | 0.582064499367088 | 0.291032249683544 |
| 52 | 0.612350926127128 | 0.775298147745743 | 0.387649073872872 |
| 53 | 0.465120421470539 | 0.930240842941078 | 0.534879578529461 |
| 54 | 0.39025725569269 | 0.780514511385379 | 0.60974274430731 |
| Meta Analysis of Goldfeld-Quandt test for Heteroskedasticity | |||
| Description | # significant tests | % significant tests | OK/NOK |
| 1% type I error level | 0 | 0 | OK |
| 5% type I error level | 2 | 0.0408163265306122 | OK |
| 10% type I error level | 12 | 0.244897959183673 | NOK |