| Multiple Linear Regression - Estimated Regression Equation |
| Y[t] = + 6.44877539516265 -0.0031482926873799X[t] + 0.3479336975722M1[t] -0.333577482917745M2[t] + 0.290011570745868M3[t] + 0.307178107327226M4[t] + 0.312341307334529M5[t] + 0.278448995148046M6[t] -0.129106907301665M7[t] + 0.282077873173671M8[t] + 0.330389365868354M9[t] + 0.198111024387572M10[t] -0.0235659121718769M11[t] + e[t] |
| Multiple Linear Regression - Ordinary Least Squares | |||||
| Variable | Parameter | S.D. | T-STAT H0: parameter = 0 | 2-tail p-value | 1-tail p-value |
| (Intercept) | 6.44877539516265 | 0.225273 | 28.6265 | 0 | 0 |
| X | -0.0031482926873799 | 0.010812 | -0.2912 | 0.772201 | 0.3861 |
| M1 | 0.3479336975722 | 0.287585 | 1.2098 | 0.232388 | 0.116194 |
| M2 | -0.333577482917745 | 0.28714 | -1.1617 | 0.251213 | 0.125607 |
| M3 | 0.290011570745868 | 0.288349 | 1.0058 | 0.319678 | 0.159839 |
| M4 | 0.307178107327226 | 0.287351 | 1.069 | 0.290529 | 0.145265 |
| M5 | 0.312341307334529 | 0.289412 | 1.0792 | 0.285994 | 0.142997 |
| M6 | 0.278448995148046 | 0.293219 | 0.9496 | 0.347159 | 0.17358 |
| M7 | -0.129106907301665 | 0.288725 | -0.4472 | 0.656812 | 0.328406 |
| M8 | 0.282077873173671 | 0.28638 | 0.985 | 0.329679 | 0.16484 |
| M9 | 0.330389365868354 | 0.288506 | 1.1452 | 0.257936 | 0.128968 |
| M10 | 0.198111024387572 | 0.286365 | 0.6918 | 0.492458 | 0.246229 |
| M11 | -0.0235659121718769 | 0.291802 | -0.0808 | 0.935976 | 0.467988 |
| Multiple Linear Regression - Regression Statistics | |
| Multiple R | 0.469470451732412 |
| R-squared | 0.220402505049835 |
| Adjusted R-squared | 0.0213563361263889 |
| F-TEST (value) | 1.10729337942999 |
| F-TEST (DF numerator) | 12 |
| F-TEST (DF denominator) | 47 |
| p-value | 0.376864473588708 |
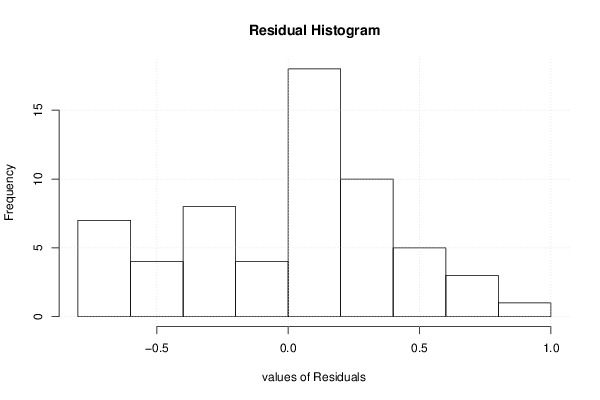
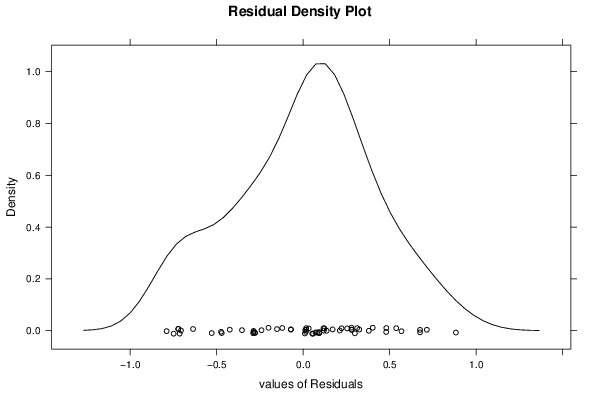
| Multiple Linear Regression - Residual Statistics | |
| Residual Standard Deviation | 0.452666513877703 |
| Sum Squared Residuals | 9.63062772095104 |
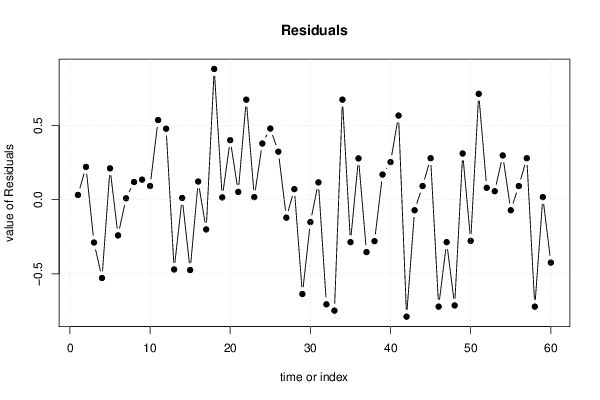
| Multiple Linear Regression - Actuals, Interpolation, and Residuals | |||
| Time or Index | Actuals | Interpolation Forecast | Residuals Prediction Error |
| 1 | 6.8 | 6.76774480001094 | 0.0322551999890557 |
| 2 | 6.3 | 6.07836288780256 | 0.221637112197438 |
| 3 | 6.4 | 6.68904394144792 | -0.289043941447918 |
| 4 | 6.2 | 6.72887818537841 | -0.528878185378411 |
| 5 | 6.9 | 6.68807631214997 | 0.211923687850032 |
| 6 | 6.4 | 6.64096117067649 | -0.240961170676489 |
| 7 | 6.3 | 6.29038936586835 | 0.0096106341316461 |
| 8 | 6.8 | 6.68048058533824 | 0.119519414661755 |
| 9 | 6.9 | 6.76436778540032 | 0.13563221459968 |
| 10 | 6.7 | 6.60753276095798 | 0.0924672390420243 |
| 11 | 6.9 | 6.36192879997444 | 0.538071200025561 |
| 12 | 6.9 | 6.4201259317075 | 0.479874068292505 |
| 13 | 6.3 | 6.77120792196707 | -0.471207921967075 |
| 14 | 6.1 | 6.08812259513344 | 0.0118774048665596 |
| 15 | 6.2 | 6.67487662435471 | -0.474876624354708 |
| 16 | 6.8 | 6.67724618530538 | 0.122753814694619 |
| 17 | 6.5 | 6.70066948289949 | -0.200669482899487 |
| 18 | 7.6 | 6.71683502444235 | 0.883164975557654 |
| 19 | 6.3 | 6.28440760976233 | 0.015592390237668 |
| 20 | 7.1 | 6.69779619511883 | 0.402203804881166 |
| 21 | 6.8 | 6.74736700488847 | 0.0526329951115309 |
| 22 | 7.3 | 6.62421871220109 | 0.675781287798911 |
| 23 | 6.4 | 6.38239270244241 | 0.0176072975575915 |
| 24 | 6.8 | 6.42044076097623 | 0.379559239023766 |
| 25 | 7.2 | 6.71926109262531 | 0.480738907374694 |
| 26 | 6.4 | 6.07552942438392 | 0.32447057561608 |
| 27 | 6.6 | 6.72115652685919 | -0.121156526859194 |
| 28 | 6.8 | 6.72856335610967 | 0.0714366438903265 |
| 29 | 6.1 | 6.73687484880436 | -0.636874848804357 |
| 30 | 6.5 | 6.65135053654484 | -0.151350536544843 |
| 31 | 6.4 | 6.28283346341864 | 0.117166536581358 |
| 32 | 6 | 6.7066114146435 | -0.706611414643498 |
| 33 | 6 | 6.74894115123216 | -0.748941151232159 |
| 34 | 7.3 | 6.62421871220109 | 0.675781287798911 |
| 35 | 6.1 | 6.386485482936 | -0.286485482936003 |
| 36 | 6.7 | 6.42075559024497 | 0.279244409755029 |
| 37 | 6.4 | 6.75389231218649 | -0.353892312186485 |
| 38 | 5.8 | 6.07993703414625 | -0.279937034146253 |
| 39 | 6.9 | 6.72997174638386 | 0.170028253616144 |
| 40 | 7 | 6.74587896589026 | 0.254121034109737 |
| 41 | 7.3 | 6.73152275123581 | 0.568477248764189 |
| 42 | 5.9 | 6.68975970733088 | -0.789759707330877 |
| 43 | 6.2 | 6.27118478047534 | -0.0711847804753361 |
| 44 | 6.8 | 6.70755590244971 | 0.0924440975502882 |
| 45 | 7 | 6.71966202923953 | 0.280337970760474 |
| 46 | 5.9 | 6.62201490731992 | -0.722014907319923 |
| 47 | 6.1 | 6.38680031220474 | -0.286800312204741 |
| 48 | 5.7 | 6.41414417560147 | -0.714144175601473 |
| 49 | 7.1 | 6.78789387321019 | 0.312106126789811 |
| 50 | 5.8 | 6.07804805853382 | -0.278048058533824 |
| 51 | 7.4 | 6.68495116095432 | 0.715048839045676 |
| 52 | 6.8 | 6.71943330731627 | 0.0805666926837283 |
| 53 | 6.8 | 6.74285660491038 | 0.0571433950896217 |
| 54 | 7 | 6.70109356100544 | 0.298906438994555 |
| 55 | 6.2 | 6.27118478047534 | -0.0711847804753361 |
| 56 | 6.8 | 6.70755590244971 | 0.0924440975502882 |
| 57 | 7 | 6.71966202923953 | 0.280337970760474 |
| 58 | 5.9 | 6.62201490731992 | -0.722014907319923 |
| 59 | 6.4 | 6.38239270244241 | 0.0176072975575915 |
| 60 | 6 | 6.42453354146983 | -0.424533541469827 |
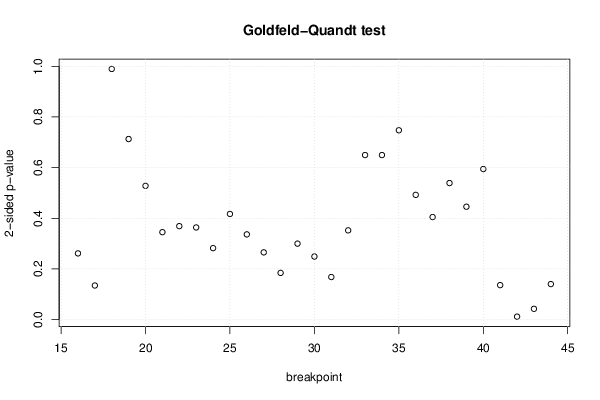
| Goldfeld-Quandt test for Heteroskedasticity | |||
| p-values | Alternative Hypothesis | ||
| breakpoint index | greater | 2-sided | less |
| 16 | 0.130646850530868 | 0.261293701061735 | 0.869353149469132 |
| 17 | 0.0672211432191979 | 0.134442286438396 | 0.932778856780802 |
| 18 | 0.494750315200675 | 0.98950063040135 | 0.505249684799325 |
| 19 | 0.356431241049523 | 0.712862482099045 | 0.643568758950477 |
| 20 | 0.264006606150949 | 0.528013212301899 | 0.735993393849051 |
| 21 | 0.172514432167775 | 0.345028864335549 | 0.827485567832225 |
| 22 | 0.184446966337007 | 0.368893932674014 | 0.815553033662993 |
| 23 | 0.181841273635505 | 0.36368254727101 | 0.818158726364495 |
| 24 | 0.140990971936223 | 0.281981943872445 | 0.859009028063777 |
| 25 | 0.208444016568573 | 0.416888033137146 | 0.791555983431427 |
| 26 | 0.168148201737856 | 0.336296403475711 | 0.831851798262144 |
| 27 | 0.132668708274445 | 0.26533741654889 | 0.867331291725555 |
| 28 | 0.0921205047055198 | 0.18424100941104 | 0.90787949529448 |
| 29 | 0.149834690048641 | 0.299669380097282 | 0.850165309951359 |
| 30 | 0.124418255168437 | 0.248836510336875 | 0.875581744831562 |
| 31 | 0.0839527256495444 | 0.167905451299089 | 0.916047274350456 |
| 32 | 0.176119471893124 | 0.352238943786249 | 0.823880528106876 |
| 33 | 0.324787876057126 | 0.649575752114252 | 0.675212123942874 |
| 34 | 0.675255326066398 | 0.649489347867203 | 0.324744673933601 |
| 35 | 0.626331184749329 | 0.747337630501342 | 0.373668815250671 |
| 36 | 0.753847697311196 | 0.492304605377609 | 0.246152302688804 |
| 37 | 0.797629205280304 | 0.404741589439392 | 0.202370794719696 |
| 38 | 0.730533293981491 | 0.538933412037017 | 0.269466706018509 |
| 39 | 0.777247378639094 | 0.445505242721813 | 0.222752621360906 |
| 40 | 0.702865949169466 | 0.594268101661069 | 0.297134050830534 |
| 41 | 0.932023252205756 | 0.135953495588489 | 0.0679767477942443 |
| 42 | 0.99427157752627 | 0.0114568449474595 | 0.00572842247372977 |
| 43 | 0.978812515262867 | 0.0423749694742661 | 0.0211874847371331 |
| 44 | 0.929943831792595 | 0.140112336414811 | 0.0700561682074053 |
| Meta Analysis of Goldfeld-Quandt test for Heteroskedasticity | |||
| Description | # significant tests | % significant tests | OK/NOK |
| 1% type I error level | 0 | 0 | OK |
| 5% type I error level | 2 | 0.0689655172413793 | NOK |
| 10% type I error level | 2 | 0.0689655172413793 | OK |