Free Statistics
of Irreproducible Research!
Description of Statistical Computation | ||||||||||||||||||||||||||||||
|---|---|---|---|---|---|---|---|---|---|---|---|---|---|---|---|---|---|---|---|---|---|---|---|---|---|---|---|---|---|---|
| Author's title | ||||||||||||||||||||||||||||||
| Author | *The author of this computation has been verified* | |||||||||||||||||||||||||||||
| R Software Module | rwasp_Distributional Plots.wasp | |||||||||||||||||||||||||||||
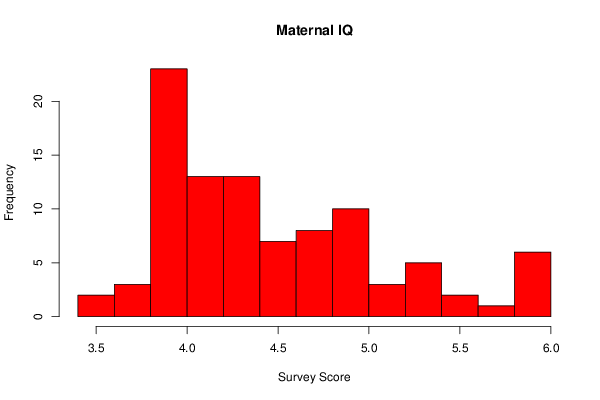
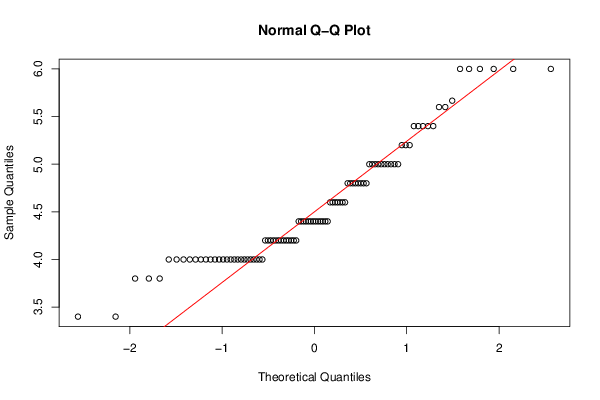
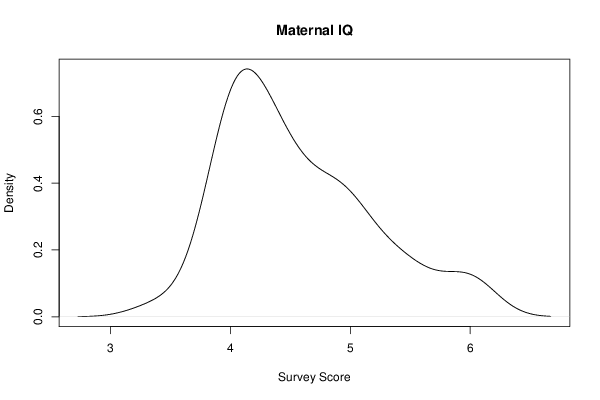
| Title produced by software | Histogram, QQplot and Density | |||||||||||||||||||||||||||||
| Date of computation | Sun, 18 Nov 2012 11:05:01 -0500 | |||||||||||||||||||||||||||||
| Cite this page as follows | Statistical Computations at FreeStatistics.org, Office for Research Development and Education, URL https://freestatistics.org/blog/index.php?v=date/2012/Nov/18/t13532547360iq0bp983dej098.htm/, Retrieved Mon, 29 Apr 2024 20:50:11 +0000 | |||||||||||||||||||||||||||||
| Statistical Computations at FreeStatistics.org, Office for Research Development and Education, URL https://freestatistics.org/blog/index.php?pk=190235, Retrieved Mon, 29 Apr 2024 20:50:11 +0000 | ||||||||||||||||||||||||||||||
| QR Codes: | ||||||||||||||||||||||||||||||
|
| ||||||||||||||||||||||||||||||
| Original text written by user: | ||||||||||||||||||||||||||||||
| IsPrivate? | No (this computation is public) | |||||||||||||||||||||||||||||
| User-defined keywords | ||||||||||||||||||||||||||||||
| Estimated Impact | 161 | |||||||||||||||||||||||||||||
Tree of Dependent Computations | ||||||||||||||||||||||||||||||
| Family? (F = Feedback message, R = changed R code, M = changed R Module, P = changed Parameters, D = changed Data) | ||||||||||||||||||||||||||||||
| - [Histogram, QQplot and Density] [compmemo mean dis...] [2012-11-18 16:05:01] [a9208f4f8d3b118336aae915785f2bd9] [Current] - R [Histogram, QQplot and Density] [WW7 Compmemo Mean...] [2012-11-18 17:00:00] [be0f7b6deff822c1e99df9393259f649] - R D [Histogram, QQplot and Density] [WW7 Compatten Mea...] [2012-11-18 17:04:50] [be0f7b6deff822c1e99df9393259f649] - R D [Histogram, QQplot and Density] [WW7 Compapplied M...] [2012-11-18 17:06:21] [be0f7b6deff822c1e99df9393259f649] - R D [Histogram, QQplot and Density] [WW7 Specmemo Mean...] [2012-11-18 17:07:57] [be0f7b6deff822c1e99df9393259f649] - R D [Histogram, QQplot and Density] [WW7 Specatten Mea...] [2012-11-18 17:09:18] [be0f7b6deff822c1e99df9393259f649] - R D [Histogram, QQplot and Density] [WW7 Specapplied M...] [2012-11-18 17:10:27] [be0f7b6deff822c1e99df9393259f649] - RM [Histogram, QQplot and Density] [Wsweek7- q1] [2012-11-18 22:17:20] [adf6e159a3755a825e40734540868e0e] - R D [Histogram, QQplot and Density] [Wsweek7-q2] [2012-11-18 22:52:08] [adf6e159a3755a825e40734540868e0e] - R D [Histogram, QQplot and Density] [wsweek7-q1] [2012-11-18 22:59:58] [adf6e159a3755a825e40734540868e0e] - D [Histogram, QQplot and Density] [wsweek7-q1] [2012-11-18 23:01:52] [adf6e159a3755a825e40734540868e0e] - D [Histogram, QQplot and Density] [wsweek7-q1] [2012-11-18 23:03:51] [adf6e159a3755a825e40734540868e0e] - D [Histogram, QQplot and Density] [week7ws1 q1] [2012-11-18 23:06:04] [adf6e159a3755a825e40734540868e0e] - R D [Histogram, QQplot and Density] [] [2013-11-22 17:54:33] [f32dc3a91cde2caeb6fb4c704c17f8cc] - D [Histogram, QQplot and Density] [] [2013-11-22 17:58:44] [f32dc3a91cde2caeb6fb4c704c17f8cc] - D [Histogram, QQplot and Density] [] [2013-11-22 18:01:59] [f32dc3a91cde2caeb6fb4c704c17f8cc] - D [Histogram, QQplot and Density] [] [2013-11-22 18:04:30] [f32dc3a91cde2caeb6fb4c704c17f8cc] - D [Histogram, QQplot and Density] [] [2013-11-22 18:08:27] [f32dc3a91cde2caeb6fb4c704c17f8cc] - R D [Histogram, QQplot and Density] [] [2013-11-22 18:11:38] [f32dc3a91cde2caeb6fb4c704c17f8cc] - R D [Histogram, QQplot and Density] [mycomp1] [2013-11-24 14:40:46] [5fa34b9af373f692a4a4d3bc1c7063df] - R D [Histogram, QQplot and Density] [comp2] [2013-11-24 14:43:12] [5fa34b9af373f692a4a4d3bc1c7063df] - R D [Histogram, QQplot and Density] [comp3] [2013-11-24 14:45:47] [5fa34b9af373f692a4a4d3bc1c7063df] - R D [Histogram, QQplot and Density] [comp4] [2013-11-24 14:48:03] [5fa34b9af373f692a4a4d3bc1c7063df] - R D [Histogram, QQplot and Density] [comp5] [2013-11-24 14:49:21] [5fa34b9af373f692a4a4d3bc1c7063df] - R D [Histogram, QQplot and Density] [comp6] [2013-11-24 14:50:20] [5fa34b9af373f692a4a4d3bc1c7063df] - R [Histogram, QQplot and Density] [] [2013-11-25 12:16:33] [0f3e3898078b2f1ec876904dc096ed72] - D [Histogram, QQplot and Density] [] [2013-11-25 12:18:37] [0f3e3898078b2f1ec876904dc096ed72] - D [Histogram, QQplot and Density] [] [2013-11-25 12:20:59] [0f3e3898078b2f1ec876904dc096ed72] - D [Histogram, QQplot and Density] [] [2013-11-25 12:22:20] [0f3e3898078b2f1ec876904dc096ed72] - D [Histogram, QQplot and Density] [] [2013-11-25 12:24:35] [0f3e3898078b2f1ec876904dc096ed72] - D [Histogram, QQplot and Density] [] [2013-11-25 12:26:24] [0f3e3898078b2f1ec876904dc096ed72] - R P [Histogram, QQplot and Density] [graphical methods...] [2013-11-25 17:40:13] [f50f3734a7b96a60c026ffbc6fc0acbf] - RM [Histogram, QQplot and Density] [graphical methods...] [2013-11-30 22:36:43] [f50f3734a7b96a60c026ffbc6fc0acbf] - R PD [Histogram, QQplot and Density] [graphical methods...] [2013-11-25 18:27:41] [f50f3734a7b96a60c026ffbc6fc0acbf] - R PD [Histogram, QQplot and Density] [compappliedmean d...] [2013-11-25 18:38:25] [f50f3734a7b96a60c026ffbc6fc0acbf] - R PD [Histogram, QQplot and Density] [Specmemmean distr...] [2013-11-25 18:44:25] [f50f3734a7b96a60c026ffbc6fc0acbf] - R PD [Histogram, QQplot and Density] [specattenmean dis...] [2013-11-25 18:49:28] [f50f3734a7b96a60c026ffbc6fc0acbf] - R PD [Histogram, QQplot and Density] [ specappliedmean ...] [2013-11-25 18:54:15] [f50f3734a7b96a60c026ffbc6fc0acbf] - RM [Histogram, QQplot and Density] [First of variables] [2013-11-26 15:16:38] [25d2ba45d5ebe8be93d39e0907163e03] | ||||||||||||||||||||||||||||||
| Feedback Forum | ||||||||||||||||||||||||||||||
Post a new message | ||||||||||||||||||||||||||||||
Dataset | ||||||||||||||||||||||||||||||
| Dataseries X: | ||||||||||||||||||||||||||||||
4.8 5.4 6 6 4 6 4.2 4.2 4.2 4 4.6 5.6666666667 3.8 4.8 4.2 4 5.4 4.6 4 4.4 5 5.4 5.2 4.4 4 3.4 4.4 4 4.4 4.4 4 4.8 4 4 5 4 3.4 4 5.4 4.2 4 5.6 4.8 4.4 4.6 4 5.2 4.8 4.6 4 4.2 4.6 4.4 5 5 4 3.8 5.2 4.2 4.4 4.2 6 4.8 4 4.4 4 4.8 4.8 5.6 6 4 4.2 5 4.4 4.2 4.6 4.4 4 4 4 4.2 4 5 4.2 5.4 4 6 3.8 5 4.4 5 4.4 5 4.2 4.6 5 | ||||||||||||||||||||||||||||||
Tables (Output of Computation) | ||||||||||||||||||||||||||||||
| ||||||||||||||||||||||||||||||
Figures (Output of Computation) | ||||||||||||||||||||||||||||||
Input Parameters & R Code | ||||||||||||||||||||||||||||||
| Parameters (Session): | ||||||||||||||||||||||||||||||
| par1 = 10 ; | ||||||||||||||||||||||||||||||
| Parameters (R input): | ||||||||||||||||||||||||||||||
| par1 = 10 ; | ||||||||||||||||||||||||||||||
| R code (references can be found in the software module): | ||||||||||||||||||||||||||||||
par1 <- '10' | ||||||||||||||||||||||||||||||