| Multiple Linear Regression - Estimated Regression Equation |
| Yt[t] = + 6.59396970329037 -0.00231512464304957Xt[t] + e[t] |
| Multiple Linear Regression - Ordinary Least Squares | |||||
| Variable | Parameter | S.D. | T-STAT H0: parameter = 0 | 2-tail p-value | 1-tail p-value |
| (Intercept) | 6.59396970329037 | 0.136487 | 48.312 | 0 | 0 |
| Xt | -0.00231512464304957 | 0.010413 | -0.2223 | 0.824845 | 0.412422 |
| Multiple Linear Regression - Regression Statistics | |
| Multiple R | 0.0291798066134438 |
| R-squared | 0.000851461113997978 |
| Adjusted R-squared | -0.0163752378323123 |
| F-TEST (value) | 0.0494268296353054 |
| F-TEST (DF numerator) | 1 |
| F-TEST (DF denominator) | 58 |
| p-value | 0.824844670462702 |
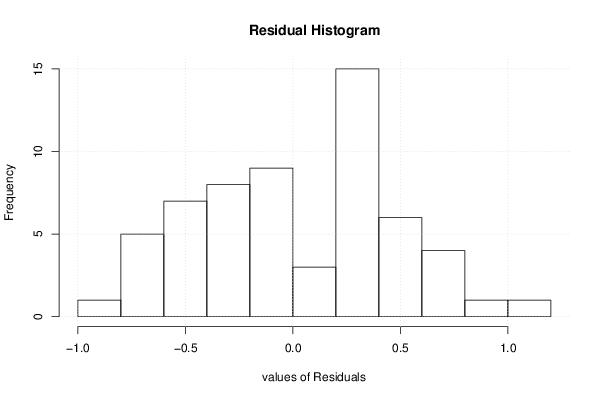
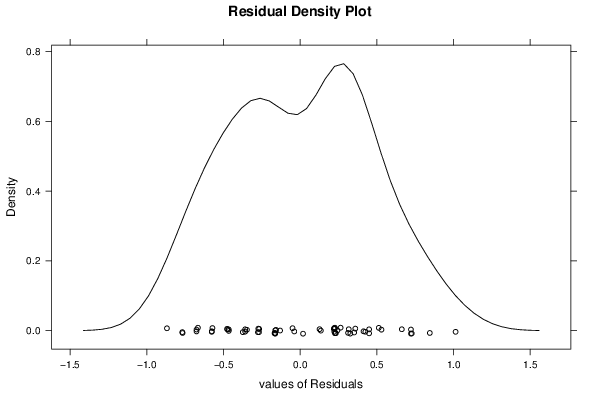
| Multiple Linear Regression - Residual Statistics | |
| Residual Standard Deviation | 0.461310258195885 |
| Sum Squared Residuals | 12.3428149503717 |
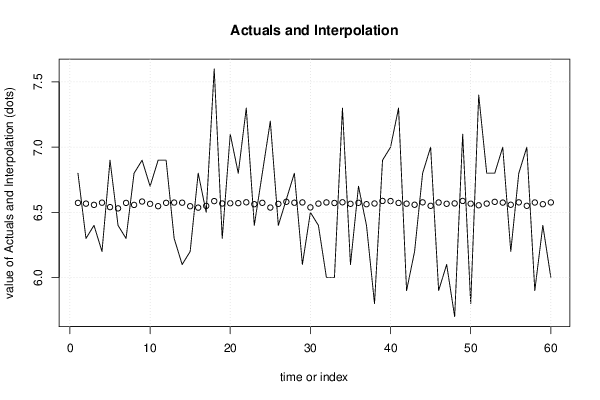
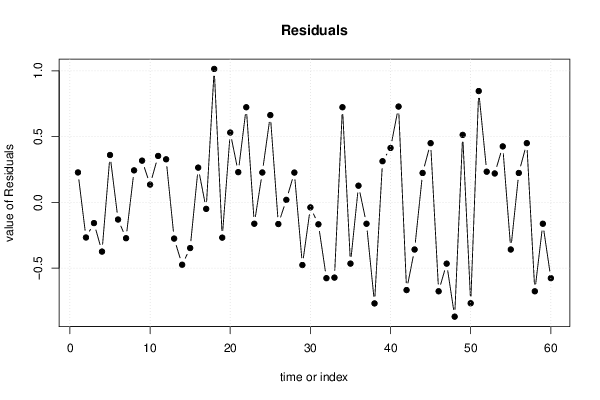
| Multiple Linear Regression - Actuals, Interpolation, and Residuals | |||
| Time or Index | Actuals | Interpolation Forecast | Residuals Prediction Error |
| 1 | 6.8 | 6.5726705565743 | 0.227329443425704 |
| 2 | 6.3 | 6.56688274496669 | -0.266882744966685 |
| 3 | 6.4 | 6.55739073393018 | -0.157390733930181 |
| 4 | 6.2 | 6.57405963136014 | -0.374059631360138 |
| 5 | 6.9 | 6.54025881157161 | 0.359741188428385 |
| 6 | 6.4 | 6.53053528807081 | -0.130535288070806 |
| 7 | 6.3 | 6.57243904411 | -0.272439044110004 |
| 8 | 6.8 | 6.55692770900157 | 0.243072290998428 |
| 9 | 6.9 | 6.58308861746803 | 0.316911382531969 |
| 10 | 6.7 | 6.56503064525225 | 0.134969354747755 |
| 11 | 6.9 | 6.54743569796507 | 0.352564302034932 |
| 12 | 6.9 | 6.57290206903861 | 0.327097930961387 |
| 13 | 6.3 | 6.57521719368166 | -0.275217193681663 |
| 14 | 6.1 | 6.57405963136014 | -0.474059631360139 |
| 15 | 6.2 | 6.54697267303646 | -0.346972673036458 |
| 16 | 6.8 | 6.53609158721413 | 0.263908412785874 |
| 17 | 6.5 | 6.54951931014381 | -0.0495193101438131 |
| 18 | 7.6 | 6.5863297919683 | 1.0136702080317 |
| 19 | 6.3 | 6.56804030728821 | -0.26804030728821 |
| 20 | 7.1 | 6.56966089453834 | 0.530339105461655 |
| 21 | 6.8 | 6.57058694439556 | 0.229413055604436 |
| 22 | 7.3 | 6.57730080586041 | 0.722699194139592 |
| 23 | 6.4 | 6.56248400814489 | -0.16248400814489 |
| 24 | 6.8 | 6.57313358150292 | 0.226866418497081 |
| 25 | 7.2 | 6.53701763707135 | 0.662982362928655 |
| 26 | 6.4 | 6.56479913278794 | -0.16479913278794 |
| 27 | 6.6 | 6.58100500528929 | 0.0189949947107124 |
| 28 | 6.8 | 6.57382811889583 | 0.226171881104166 |
| 29 | 6.1 | 6.57614324353888 | -0.476143243538883 |
| 30 | 6.5 | 6.53817519939287 | -0.0381751993928702 |
| 31 | 6.4 | 6.56688274496668 | -0.166882744966685 |
| 32 | 6 | 6.57614324353888 | -0.576143243538883 |
| 33 | 6 | 6.57174450671709 | -0.571744506717089 |
| 34 | 7.3 | 6.57730080586041 | 0.722699194139592 |
| 35 | 6.1 | 6.56549367018085 | -0.465493670180855 |
| 36 | 6.7 | 6.57336509396722 | 0.126634906032777 |
| 37 | 6.4 | 6.56248400814489 | -0.16248400814489 |
| 38 | 5.8 | 6.56804030728821 | -0.76804030728821 |
| 39 | 6.9 | 6.58748735428983 | 0.312512645710174 |
| 40 | 7 | 6.58656130443261 | 0.413438695567394 |
| 41 | 7.3 | 6.5722075316457 | 0.727792468354301 |
| 42 | 5.9 | 6.56641972003808 | -0.666419720038075 |
| 43 | 6.2 | 6.5583167837874 | -0.358316783787401 |
| 44 | 6.8 | 6.5768377809318 | 0.223162219068202 |
| 45 | 7 | 6.55021384753673 | 0.449786152463272 |
| 46 | 5.9 | 6.57568021861027 | -0.675680218610273 |
| 47 | 6.1 | 6.56572518264516 | -0.46572518264516 |
| 48 | 5.7 | 6.56850333221682 | -0.868503332216819 |
| 49 | 7.1 | 6.58748735428983 | 0.512512645710174 |
| 50 | 5.8 | 6.56665123250238 | -0.76665123250238 |
| 51 | 7.4 | 6.55438107189422 | 0.845618928105783 |
| 52 | 6.8 | 6.56711425743099 | 0.23288574256901 |
| 53 | 6.8 | 6.58054198036068 | 0.219458019639323 |
| 54 | 7 | 6.57475416875305 | 0.425245831246947 |
| 55 | 6.2 | 6.5583167837874 | -0.358316783787401 |
| 56 | 6.8 | 6.5768377809318 | 0.223162219068202 |
| 57 | 7 | 6.55021384753673 | 0.449786152463272 |
| 58 | 5.9 | 6.57568021861027 | -0.675680218610273 |
| 59 | 6.4 | 6.56248400814489 | -0.16248400814489 |
| 60 | 6 | 6.57614324353888 | -0.576143243538883 |
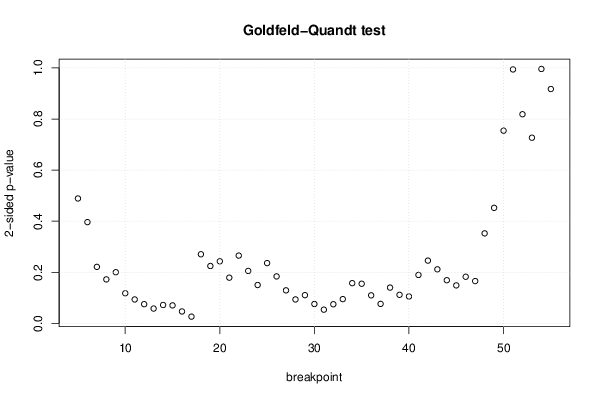
| Goldfeld-Quandt test for Heteroskedasticity | |||
| p-values | Alternative Hypothesis | ||
| breakpoint index | greater | 2-sided | less |
| 5 | 0.244568203662365 | 0.48913640732473 | 0.755431796337635 |
| 6 | 0.198242594922546 | 0.396485189845091 | 0.801757405077454 |
| 7 | 0.11065000522933 | 0.22130001045866 | 0.88934999477067 |
| 8 | 0.0861468070704676 | 0.172293614140935 | 0.913853192929532 |
| 9 | 0.100191635229598 | 0.200383270459196 | 0.899808364770402 |
| 10 | 0.0589782129739946 | 0.117956425947989 | 0.941021787026005 |
| 11 | 0.0468726696062959 | 0.0937453392125918 | 0.953127330393704 |
| 12 | 0.0375995357862871 | 0.0751990715725741 | 0.962400464213713 |
| 13 | 0.029069224559576 | 0.058138449119152 | 0.970930775440424 |
| 14 | 0.0360349359003959 | 0.0720698718007919 | 0.963965064099604 |
| 15 | 0.0352954286353552 | 0.0705908572707104 | 0.964704571364645 |
| 16 | 0.0233650265715704 | 0.0467300531431408 | 0.97663497342843 |
| 17 | 0.0132097660236726 | 0.0264195320473452 | 0.986790233976327 |
| 18 | 0.135367074420405 | 0.270734148840809 | 0.864632925579595 |
| 19 | 0.112400471910858 | 0.224800943821716 | 0.887599528089142 |
| 20 | 0.121626897776035 | 0.24325379555207 | 0.878373102223965 |
| 21 | 0.0894973047527469 | 0.178994609505494 | 0.910502695247253 |
| 22 | 0.132761414749773 | 0.265522829499546 | 0.867238585250227 |
| 23 | 0.102671126424055 | 0.205342252848109 | 0.897328873575945 |
| 24 | 0.0751258406625004 | 0.150251681325001 | 0.9248741593375 |
| 25 | 0.118024352815353 | 0.236048705630707 | 0.881975647184647 |
| 26 | 0.0919808146265402 | 0.18396162925308 | 0.90801918537346 |
| 27 | 0.0647038799877337 | 0.129407759975467 | 0.935296120012266 |
| 28 | 0.0469076175589628 | 0.0938152351179256 | 0.953092382441037 |
| 29 | 0.0552923621773853 | 0.110584724354771 | 0.944707637822615 |
| 30 | 0.0379684676750702 | 0.0759369353501404 | 0.96203153232493 |
| 31 | 0.0269062644815553 | 0.0538125289631107 | 0.973093735518445 |
| 32 | 0.0374888632799639 | 0.0749777265599277 | 0.962511136720036 |
| 33 | 0.0475294895802778 | 0.0950589791605556 | 0.952470510419722 |
| 34 | 0.0787443266593526 | 0.157488653318705 | 0.921255673340647 |
| 35 | 0.0776454548474183 | 0.155290909694837 | 0.922354545152582 |
| 36 | 0.0549122226876551 | 0.10982444537531 | 0.945087777312345 |
| 37 | 0.0382393649939378 | 0.0764787299878756 | 0.961760635006062 |
| 38 | 0.0701117127458334 | 0.140223425491667 | 0.929888287254167 |
| 39 | 0.0559585876097038 | 0.111917175219408 | 0.944041412390296 |
| 40 | 0.0527243673858944 | 0.105448734771789 | 0.947275632614106 |
| 41 | 0.0948367255199895 | 0.189673451039979 | 0.90516327448001 |
| 42 | 0.122911990478285 | 0.24582398095657 | 0.877088009521715 |
| 43 | 0.105861443511941 | 0.211722887023882 | 0.894138556488059 |
| 44 | 0.084521874496878 | 0.169043748993756 | 0.915478125503122 |
| 45 | 0.0744220895179451 | 0.14884417903589 | 0.925577910482055 |
| 46 | 0.0913188924744103 | 0.182637784948821 | 0.90868110752559 |
| 47 | 0.0828688262342288 | 0.165737652468458 | 0.917131173765771 |
| 48 | 0.176256449194229 | 0.352512898388459 | 0.823743550805771 |
| 49 | 0.226205771321507 | 0.452411542643014 | 0.773794228678493 |
| 50 | 0.377257156216783 | 0.754514312433567 | 0.622742843783217 |
| 51 | 0.497127673434862 | 0.994255346869725 | 0.502872326565138 |
| 52 | 0.409444309409048 | 0.818888618818095 | 0.590555690590952 |
| 53 | 0.363478447195815 | 0.726956894391631 | 0.636521552804185 |
| 54 | 0.50189272157713 | 0.996214556845739 | 0.49810727842287 |
| 55 | 0.458840356865328 | 0.917680713730656 | 0.541159643134672 |
| Meta Analysis of Goldfeld-Quandt test for Heteroskedasticity | |||
| Description | # significant tests | % significant tests | OK/NOK |
| 1% type I error level | 0 | 0 | OK |
| 5% type I error level | 2 | 0.0392156862745098 | OK |
| 10% type I error level | 13 | 0.254901960784314 | NOK |