Free Statistics
of Irreproducible Research!
Description of Statistical Computation | ||||||||||||||||||||||||||||||
|---|---|---|---|---|---|---|---|---|---|---|---|---|---|---|---|---|---|---|---|---|---|---|---|---|---|---|---|---|---|---|
| Author's title | ||||||||||||||||||||||||||||||
| Author | *The author of this computation has been verified* | |||||||||||||||||||||||||||||
| R Software Module | rwasp_Distributional Plots.wasp | |||||||||||||||||||||||||||||
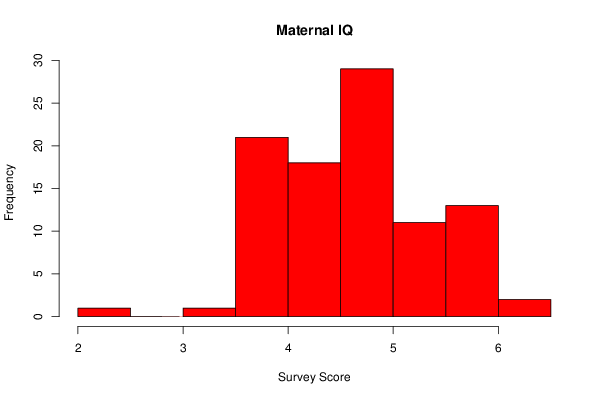
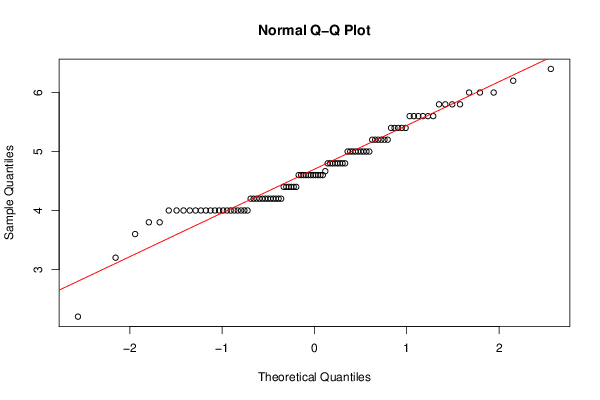
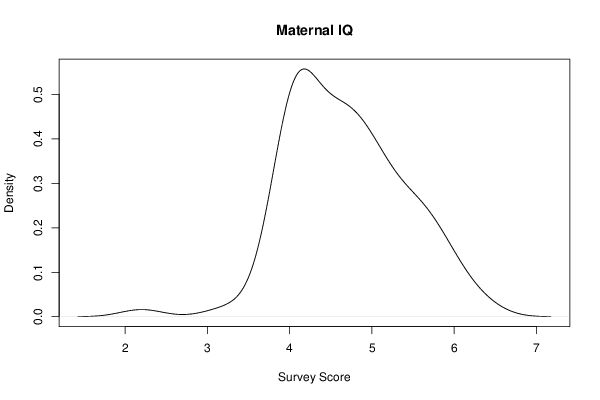
| Title produced by software | Histogram, QQplot and Density | |||||||||||||||||||||||||||||
| Date of computation | Thu, 15 Nov 2012 16:06:43 -0500 | |||||||||||||||||||||||||||||
| Cite this page as follows | Statistical Computations at FreeStatistics.org, Office for Research Development and Education, URL https://freestatistics.org/blog/index.php?v=date/2012/Nov/15/t1353013635781p0r1rmrxh436.htm/, Retrieved Thu, 02 May 2024 01:47:22 +0000 | |||||||||||||||||||||||||||||
| Statistical Computations at FreeStatistics.org, Office for Research Development and Education, URL https://freestatistics.org/blog/index.php?pk=189789, Retrieved Thu, 02 May 2024 01:47:22 +0000 | ||||||||||||||||||||||||||||||
| QR Codes: | ||||||||||||||||||||||||||||||
|
| ||||||||||||||||||||||||||||||
| Original text written by user: | ||||||||||||||||||||||||||||||
| IsPrivate? | No (this computation is public) | |||||||||||||||||||||||||||||
| User-defined keywords | ||||||||||||||||||||||||||||||
| Estimated Impact | 70 | |||||||||||||||||||||||||||||
Tree of Dependent Computations | ||||||||||||||||||||||||||||||
| Family? (F = Feedback message, R = changed R code, M = changed R Module, P = changed Parameters, D = changed Data) | ||||||||||||||||||||||||||||||
| - [Histogram, QQplot and Density] [QQ plot 2] [2012-11-15 21:06:43] [2382cedf7090729c4dd845b3143bdc60] [Current] - R D [Histogram, QQplot and Density] [QQ plot 3] [2012-11-15 21:08:01] [1aae0c5c6facab42541233b6b1e71921] - D [Histogram, QQplot and Density] [QQ plot 4] [2012-11-15 21:14:06] [1aae0c5c6facab42541233b6b1e71921] - D [Histogram, QQplot and Density] [QQ plot 5] [2012-11-15 21:15:00] [1aae0c5c6facab42541233b6b1e71921] - D [Histogram, QQplot and Density] [QQ plot 6] [2012-11-15 21:20:51] [1aae0c5c6facab42541233b6b1e71921] | ||||||||||||||||||||||||||||||
| Feedback Forum | ||||||||||||||||||||||||||||||
Post a new message | ||||||||||||||||||||||||||||||
Dataset | ||||||||||||||||||||||||||||||
| Dataseries X: | ||||||||||||||||||||||||||||||
5 5.4 5.6 5.6 5.4 6 4 4.2 4.6 4.2 4.2 4.666666667 3.6 5 4.6 4 5.8 5.8 4 5.4 4.8 5.8 5.4 4.8 4.6 4.6 4 4 4.8 5 4 5.2 4 4.4 5.6 4.6 2.2 4 4.6 4.2 4 5 5 4.8 5 3.8 4.6 4.2 5 4 5.2 4.8 4.2 5 4.2 4 3.2 6.2 5.6 4.6 5.2 6 4.8 4 4.4 4.4 4.8 4.6 6.4 6 4.2 4 5.2 4.4 4.6 4.8 4.2 4 4.2 4 5 4 5.6 4 5.8 4.4 5.4 4.2 5.2 4.6 5.2 4.4 4.2 4 3.8 5.6 | ||||||||||||||||||||||||||||||
Tables (Output of Computation) | ||||||||||||||||||||||||||||||
| ||||||||||||||||||||||||||||||
Figures (Output of Computation) | ||||||||||||||||||||||||||||||
Input Parameters & R Code | ||||||||||||||||||||||||||||||
| Parameters (Session): | ||||||||||||||||||||||||||||||
| par1 = 10 ; | ||||||||||||||||||||||||||||||
| Parameters (R input): | ||||||||||||||||||||||||||||||
| par1 = 10 ; | ||||||||||||||||||||||||||||||
| R code (references can be found in the software module): | ||||||||||||||||||||||||||||||
x <- x[!is.na(x)] | ||||||||||||||||||||||||||||||