| Multiple Linear Regression - Estimated Regression Equation |
| werkeloosheid[t] = + 347.577586584537 + 1.04313174226083onderwijshoog[t] + 1.65856049191535onderwijsmiddelbaar[t] + 0.0963565106816862onderwijslaag[t] -0.0195889378182551autochtoon[t] + 0.0729893635415538allochtonen[t] -0.0354772937823839banen[t] + e[t] |
| Multiple Linear Regression - Ordinary Least Squares | |||||
| Variable | Parameter | S.D. | T-STAT H0: parameter = 0 | 2-tail p-value | 1-tail p-value |
| (Intercept) | 347.577586584537 | 65.357759 | 5.3181 | 3e-06 | 1e-06 |
| onderwijshoog | 1.04313174226083 | 0.152271 | 6.8505 | 0 | 0 |
| onderwijsmiddelbaar | 1.65856049191535 | 0.104567 | 15.8612 | 0 | 0 |
| onderwijslaag | 0.0963565106816862 | 0.162861 | 0.5916 | 0.556807 | 0.278403 |
| autochtoon | -0.0195889378182551 | 0.107456 | -0.1823 | 0.856101 | 0.428051 |
| allochtonen | 0.0729893635415538 | 0.128404 | 0.5684 | 0.572335 | 0.286167 |
| banen | -0.0354772937823839 | 0.006974 | -5.0868 | 6e-06 | 3e-06 |
| Multiple Linear Regression - Regression Statistics | |
| Multiple R | 0.993849707145605 |
| R-squared | 0.987737240393404 |
| Adjusted R-squared | 0.986235677992596 |
| F-TEST (value) | 657.806322176237 |
| F-TEST (DF numerator) | 6 |
| F-TEST (DF denominator) | 49 |
| p-value | 0 |
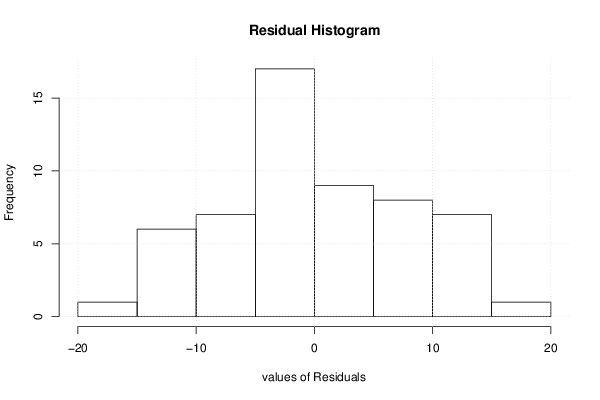
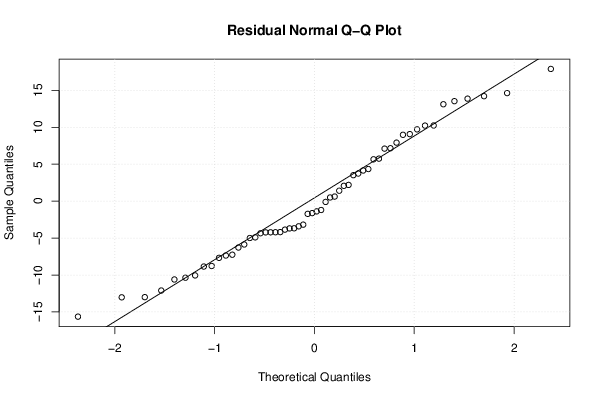
| Multiple Linear Regression - Residual Statistics | |
| Residual Standard Deviation | 8.70251469796598 |
| Sum Squared Residuals | 3710.95434134739 |
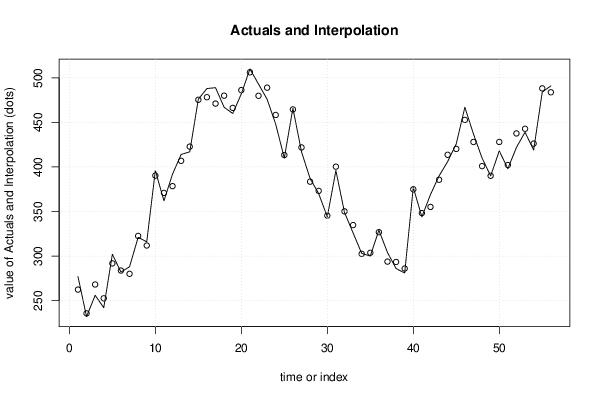
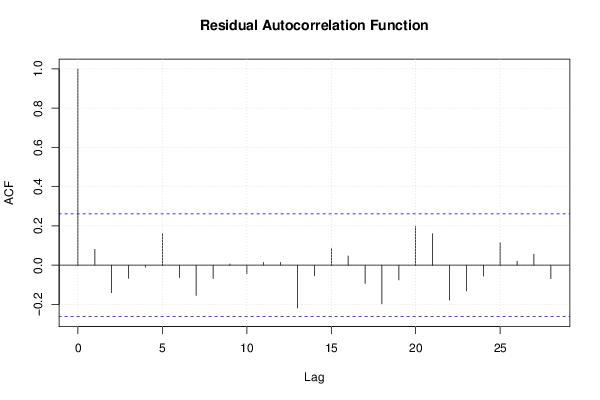
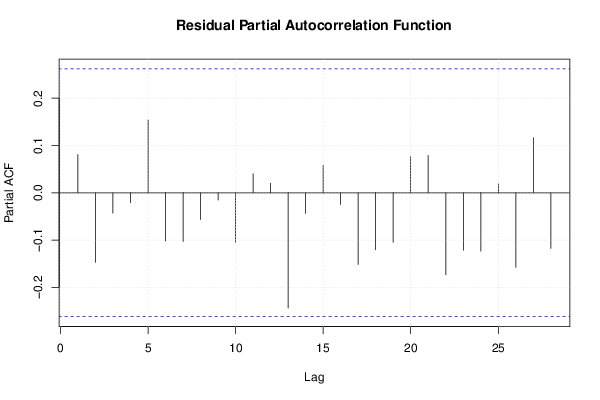
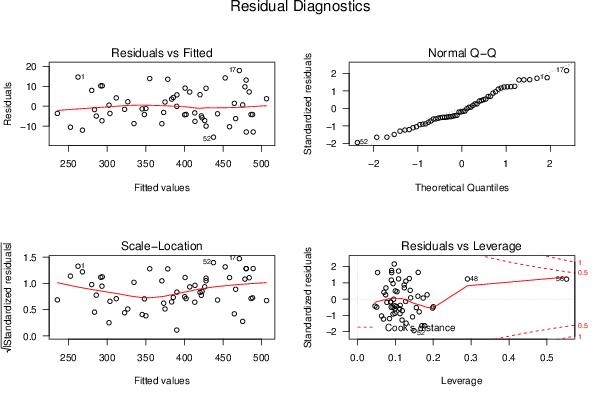
| Multiple Linear Regression - Actuals, Interpolation, and Residuals | |||
| Time or Index | Actuals | Interpolation Forecast | Residuals Prediction Error |
| 1 | 277 | 262.3686551004 | 14.6313448996001 |
| 2 | 232 | 235.670618236501 | -3.6706182365008 |
| 3 | 256 | 268.0952063494 | -12.0952063493997 |
| 4 | 242 | 252.600219865148 | -10.6002198651478 |
| 5 | 302 | 291.769627757571 | 10.2303722424293 |
| 6 | 282 | 283.718045282497 | -1.71804528249739 |
| 7 | 288 | 280.081768347073 | 7.91823165292671 |
| 8 | 321 | 322.617217475622 | -1.61721747562161 |
| 9 | 316 | 311.849918677194 | 4.15008132280635 |
| 10 | 396 | 390.332686359402 | 5.66731364059774 |
| 11 | 362 | 370.849843382683 | -8.84984338268318 |
| 12 | 392 | 378.46593532378 | 13.5340646762196 |
| 13 | 414 | 406.891135277039 | 7.10886472296133 |
| 14 | 417 | 422.86309524304 | -5.86309524303982 |
| 15 | 476 | 475.380169087434 | 0.619830912565559 |
| 16 | 488 | 478.280633216443 | 9.71936678355712 |
| 17 | 489 | 471.103755897418 | 17.8962441025822 |
| 18 | 467 | 480.015318002414 | -13.0153180024139 |
| 19 | 460 | 466.27745841015 | -6.27745841014966 |
| 20 | 482 | 486.208359181485 | -4.20835918148514 |
| 21 | 510 | 506.261747764758 | 3.73825223524173 |
| 22 | 493 | 479.881806914514 | 13.1181930854857 |
| 23 | 476 | 488.993181058437 | -12.9931810584367 |
| 24 | 448 | 458.364739973191 | -10.364739973191 |
| 25 | 410 | 413.404979424846 | -3.40497942484599 |
| 26 | 466 | 464.5882765177 | 1.41172348229952 |
| 27 | 417 | 421.898914112557 | -4.8989141125568 |
| 28 | 387 | 383.482386916283 | 3.51761308371668 |
| 29 | 370 | 373.180902887401 | -3.18090288740138 |
| 30 | 344 | 345.38371308293 | -1.38371308292987 |
| 31 | 396 | 400.346759168915 | -4.34675916891457 |
| 32 | 349 | 350.196795113377 | -1.19679511337652 |
| 33 | 326 | 334.775218203894 | -8.77521820389401 |
| 34 | 303 | 302.500316032091 | 0.499683967908872 |
| 35 | 300 | 303.686656771706 | -3.68665677170593 |
| 36 | 329 | 326.799687625358 | 2.20031237464205 |
| 37 | 304 | 293.757388430054 | 10.2426115699457 |
| 38 | 286 | 293.35957889744 | -7.35957889744041 |
| 39 | 281 | 285.986295492933 | -4.98629549293344 |
| 40 | 377 | 374.926215726309 | 2.07378427369086 |
| 41 | 344 | 348.224509694128 | -4.22450969412763 |
| 42 | 369 | 355.125106112632 | 13.8748938873679 |
| 43 | 390 | 385.649741286888 | 4.35025871311244 |
| 44 | 406 | 413.676413099491 | -7.6764130994909 |
| 45 | 426 | 420.244072870903 | 5.75592712909724 |
| 46 | 467 | 452.789442956761 | 14.2105570432391 |
| 47 | 437 | 428.019058189701 | 8.98094181029916 |
| 48 | 410 | 400.921231543186 | 9.07876845681388 |
| 49 | 390 | 390.103393803677 | -0.103393803677157 |
| 50 | 418 | 428.054721672489 | -10.054721672489 |
| 51 | 398 | 402.188240195469 | -4.1882401954689 |
| 52 | 422 | 437.632602233193 | -15.6326022331929 |
| 53 | 439 | 442.855440348637 | -3.85544034863745 |
| 54 | 419 | 426.249003300492 | -7.24900330049198 |
| 55 | 484 | 488.214874218207 | -4.21487421820737 |
| 56 | 491 | 483.836921886758 | 7.16307811324212 |
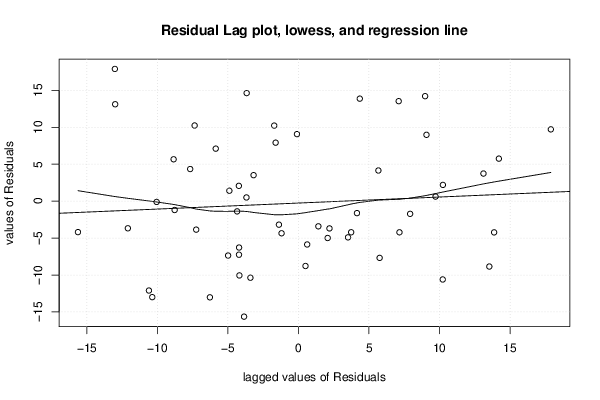
| Goldfeld-Quandt test for Heteroskedasticity | |||
| p-values | Alternative Hypothesis | ||
| breakpoint index | greater | 2-sided | less |
| 10 | 0.81557884702345 | 0.3688423059531 | 0.18442115297655 |
| 11 | 0.773645603205896 | 0.452708793588208 | 0.226354396794104 |
| 12 | 0.698409388703864 | 0.603181222592271 | 0.301590611296136 |
| 13 | 0.601759742844351 | 0.796480514311298 | 0.398240257155649 |
| 14 | 0.484321736362483 | 0.968643472724966 | 0.515678263637517 |
| 15 | 0.406022189481137 | 0.812044378962274 | 0.593977810518863 |
| 16 | 0.337220819559404 | 0.674441639118808 | 0.662779180440596 |
| 17 | 0.423304081868304 | 0.846608163736608 | 0.576695918131696 |
| 18 | 0.560092989526632 | 0.879814020946737 | 0.439907010473368 |
| 19 | 0.526231024024302 | 0.947537951951397 | 0.473768975975698 |
| 20 | 0.655029764437647 | 0.689940471124706 | 0.344970235562353 |
| 21 | 0.657876289896627 | 0.684247420206746 | 0.342123710103373 |
| 22 | 0.804466324820139 | 0.391067350359722 | 0.195533675179861 |
| 23 | 0.94811763133999 | 0.103764737320019 | 0.0518823686600095 |
| 24 | 0.947627158530414 | 0.104745682939172 | 0.0523728414695862 |
| 25 | 0.922552220519512 | 0.154895558960975 | 0.0774477794804877 |
| 26 | 0.897959558457832 | 0.204080883084336 | 0.102040441542168 |
| 27 | 0.884387232356129 | 0.231225535287741 | 0.11561276764387 |
| 28 | 0.851144048958348 | 0.297711902083305 | 0.148855951041652 |
| 29 | 0.815939123785136 | 0.368121752429729 | 0.184060876214864 |
| 30 | 0.769457785138766 | 0.461084429722468 | 0.230542214861234 |
| 31 | 0.713486248672617 | 0.573027502654766 | 0.286513751327383 |
| 32 | 0.641509067195371 | 0.716981865609258 | 0.358490932804629 |
| 33 | 0.667069384368684 | 0.665861231262632 | 0.332930615631316 |
| 34 | 0.630890126293083 | 0.738219747413833 | 0.369109873706917 |
| 35 | 0.54883204577645 | 0.9023359084471 | 0.45116795422355 |
| 36 | 0.453479522081198 | 0.906959044162397 | 0.546520477918802 |
| 37 | 0.454114368979575 | 0.90822873795915 | 0.545885631020425 |
| 38 | 0.378937425351518 | 0.757874850703036 | 0.621062574648482 |
| 39 | 0.31354401536651 | 0.627088030733021 | 0.68645598463349 |
| 40 | 0.252653560063815 | 0.505307120127631 | 0.747346439936185 |
| 41 | 0.235282417194306 | 0.470564834388612 | 0.764717582805694 |
| 42 | 0.367574071839336 | 0.735148143678672 | 0.632425928160664 |
| 43 | 0.794192535489591 | 0.411614929020818 | 0.205807464510409 |
| 44 | 0.907954819010826 | 0.184090361978348 | 0.092045180989174 |
| 45 | 0.829496704809369 | 0.341006590381262 | 0.170503295190631 |
| 46 | 0.944027975838255 | 0.11194404832349 | 0.0559720241617448 |
| Meta Analysis of Goldfeld-Quandt test for Heteroskedasticity | |||
| Description | # significant tests | % significant tests | OK/NOK |
| 1% type I error level | 0 | 0 | OK |
| 5% type I error level | 0 | 0 | OK |
| 10% type I error level | 0 | 0 | OK |