| Multiple Linear Regression - Estimated Regression Equation |
| marriages[t] = -95.7589169571333 + 0.0628532671797702year[t] + 2.55171334463017mortality[t] + e[t] |
| Multiple Linear Regression - Ordinary Least Squares | |||||
| Variable | Parameter | S.D. | T-STAT H0: parameter = 0 | 2-tail p-value | 1-tail p-value |
| (Intercept) | -95.7589169571333 | 184.713053 | -0.5184 | 0.606823 | 0.303411 |
| year | 0.0628532671797702 | 0.092272 | 0.6812 | 0.499415 | 0.249708 |
| mortality | 2.55171334463017 | 0.579944 | 4.3999 | 7e-05 | 3.5e-05 |
| Multiple Linear Regression - Regression Statistics | |
| Multiple R | 0.952073063013806 |
| R-squared | 0.90644311731649 |
| Adjusted R-squared | 0.902091634400978 |
| F-TEST (value) | 208.306716334613 |
| F-TEST (DF numerator) | 2 |
| F-TEST (DF denominator) | 43 |
| p-value | 0 |
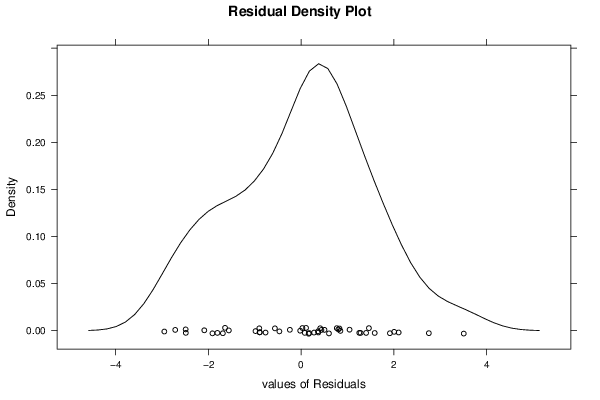
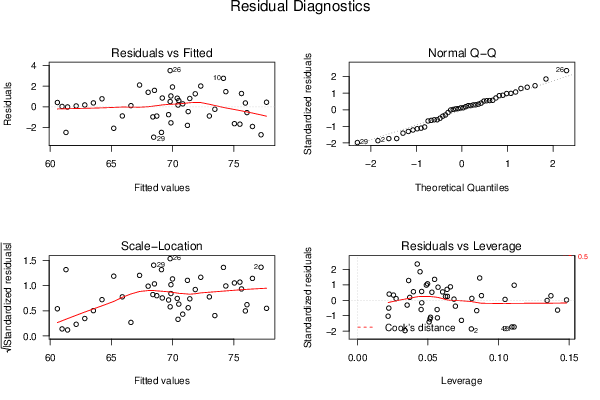
| Multiple Linear Regression - Residual Statistics | |
| Residual Standard Deviation | 1.51924520741372 |
| Sum Squared Residuals | 99.2485580107304 |
| Multiple Linear Regression - Actuals, Interpolation, and Residuals | |||
| Time or Index | Actuals | Interpolation Forecast | Residuals Prediction Error |
| 1 | 78.1 | 77.6629731821818 | 0.437026817818173 |
| 2 | 74.5 | 77.2154837804355 | -2.71548378043555 |
| 3 | 74.6 | 76.5128230442263 | -1.91282304422627 |
| 4 | 75.5 | 76.06533364248 | -0.56533364248 |
| 5 | 76.9 | 75.6178442407337 | 1.28215575926627 |
| 6 | 76.3 | 75.9358688423765 | 0.364131157623477 |
| 7 | 73.8 | 75.4883794406303 | -1.68837944063026 |
| 8 | 73.4 | 75.040890038884 | -1.64089003888399 |
| 9 | 75.8 | 74.3382293026747 | 1.46177069732529 |
| 10 | 76.9 | 74.1459112353915 | 2.75408876460855 |
| 11 | 73.2 | 73.4432504991822 | -0.243250499182182 |
| 12 | 72.1 | 72.9957610974359 | -0.895761097435918 |
| 13 | 74.3 | 72.2931003612266 | 2.00689963877336 |
| 14 | 73.1 | 71.8456109594804 | 1.25438904051963 |
| 15 | 72.2 | 71.3981215577341 | 0.801878442265899 |
| 16 | 69.4 | 71.2058034904509 | -1.80580349045086 |
| 17 | 70.8 | 71.2686567576306 | -0.468656757630635 |
| 18 | 71.1 | 70.8211673558844 | 0.278832644115634 |
| 19 | 71.2 | 70.3736779541381 | 0.826322045861905 |
| 20 | 70.6 | 70.4365312213179 | 0.163468778682127 |
| 21 | 71.1 | 70.4993844884976 | 0.600615511502356 |
| 22 | 70.3 | 69.7967237522884 | 0.503276247711643 |
| 23 | 68.3 | 69.8595770194681 | -1.55957701946813 |
| 24 | 68.9 | 69.6672589521849 | -0.767258952184877 |
| 25 | 71.9 | 69.9852835538277 | 1.91471644617234 |
| 26 | 73.3 | 69.7929654865444 | 3.50703451345557 |
| 27 | 70.9 | 69.8558187537242 | 1.04418124627581 |
| 28 | 70 | 69.1531580175149 | 0.84684198248509 |
| 29 | 65.5 | 68.4504972813056 | -2.95049728130563 |
| 30 | 70.1 | 68.5133505484854 | 1.5866494515146 |
| 31 | 66.6 | 69.0865464845912 | -2.48654648459121 |
| 32 | 67.4 | 68.3838857483819 | -0.983885748381919 |
| 33 | 67.8 | 68.7019103500247 | -0.90191035002471 |
| 34 | 69.4 | 67.9992496138154 | 1.40075038618458 |
| 35 | 69.4 | 67.2965888776062 | 2.10341112239386 |
| 36 | 66.7 | 66.5939281413969 | 0.106071858603138 |
| 37 | 65 | 65.8912674051876 | -0.891267405187582 |
| 38 | 63.1 | 65.1886066689783 | -2.0886066689783 |
| 39 | 65 | 64.230774598306 | 0.769225401693998 |
| 40 | 63.9 | 63.5281138620967 | 0.37188613790328 |
| 41 | 63 | 62.8254531258874 | 0.174546874112565 |
| 42 | 62.2 | 62.1227923896782 | 0.0772076103218483 |
| 43 | 61.4 | 61.4201316534689 | -0.0201316534688726 |
| 44 | 61 | 60.9726422517226 | 0.0273577482773916 |
| 45 | 58.8 | 61.2906668533654 | -2.4906668533654 |
| 46 | 61 | 60.5880061171561 | 0.411993882843889 |
| Goldfeld-Quandt test for Heteroskedasticity | |||
| p-values | Alternative Hypothesis | ||
| breakpoint index | greater | 2-sided | less |
| 6 | 0.729022327296051 | 0.541955345407899 | 0.270977672703949 |
| 7 | 0.734512142183264 | 0.530975715633473 | 0.265487857816736 |
| 8 | 0.682386693248934 | 0.635226613502131 | 0.317613306751066 |
| 9 | 0.653217667535371 | 0.693564664929258 | 0.346782332464629 |
| 10 | 0.734474060560259 | 0.531051878879482 | 0.265525939439741 |
| 11 | 0.726431206443715 | 0.54713758711257 | 0.273568793556285 |
| 12 | 0.738039295833035 | 0.52392140833393 | 0.261960704166965 |
| 13 | 0.69399815422854 | 0.61200369154292 | 0.30600184577146 |
| 14 | 0.612154064037192 | 0.775691871925617 | 0.387845935962808 |
| 15 | 0.534454093271321 | 0.931091813457358 | 0.465545906728679 |
| 16 | 0.696696078747655 | 0.60660784250469 | 0.303303921252345 |
| 17 | 0.635219293735538 | 0.729561412528923 | 0.364780706264462 |
| 18 | 0.544213269663036 | 0.911573460673928 | 0.455786730336964 |
| 19 | 0.455945719457858 | 0.911891438915715 | 0.544054280542142 |
| 20 | 0.366740077091221 | 0.733480154182442 | 0.633259922908779 |
| 21 | 0.289820799536548 | 0.579641599073097 | 0.710179200463452 |
| 22 | 0.216732857987999 | 0.433465715975997 | 0.783267142012001 |
| 23 | 0.247791959384407 | 0.495583918768814 | 0.752208040615593 |
| 24 | 0.240777486318138 | 0.481554972636277 | 0.759222513681862 |
| 25 | 0.270576281487358 | 0.541152562974715 | 0.729423718512642 |
| 26 | 0.487755692205825 | 0.975511384411651 | 0.512244307794175 |
| 27 | 0.432642128101823 | 0.865284256203645 | 0.567357871898178 |
| 28 | 0.398488681317298 | 0.796977362634597 | 0.601511318682701 |
| 29 | 0.70313507174018 | 0.593729856519641 | 0.29686492825982 |
| 30 | 0.680396236408337 | 0.639207527183326 | 0.319603763591663 |
| 31 | 0.824095848322597 | 0.351808303354805 | 0.175904151677403 |
| 32 | 0.834489077301367 | 0.331021845397265 | 0.165510922698633 |
| 33 | 0.815100529745141 | 0.369798940509717 | 0.184899470254859 |
| 34 | 0.782375177984799 | 0.435249644030401 | 0.217624822015201 |
| 35 | 0.916505854453843 | 0.166988291092313 | 0.0834941455461566 |
| 36 | 0.90316156567884 | 0.19367686864232 | 0.0968384343211598 |
| 37 | 0.8433707677179 | 0.313258464564201 | 0.1566292322821 |
| 38 | 0.877889987035123 | 0.244220025929754 | 0.122110012964877 |
| 39 | 0.799326043741418 | 0.401347912517165 | 0.200673956258582 |
| 40 | 0.684110590260656 | 0.631778819478688 | 0.315889409739344 |
| Meta Analysis of Goldfeld-Quandt test for Heteroskedasticity | |||
| Description | # significant tests | % significant tests | OK/NOK |
| 1% type I error level | 0 | 0 | OK |
| 5% type I error level | 0 | 0 | OK |
| 10% type I error level | 0 | 0 | OK |