Free Statistics

of Irreproducible Research!

Author's title

Author*The author of this computation has been verified*
R Software Modulerwasp_multipleregression.wasp
Title produced by softwareMultiple Regression
Date of computationThu, 15 Nov 2012 10:16:57 -0500
Cite this page as followsStatistical Computations at FreeStatistics.org, Office for Research Development and Education, URL https://freestatistics.org/blog/index.php?v=date/2012/Nov/15/t1352992734129rcv5q4ez7jcz.htm/, Retrieved Thu, 02 May 2024 06:15:19 +0000
Statistical Computations at FreeStatistics.org, Office for Research Development and Education, URL https://freestatistics.org/blog/index.php?pk=189703, Retrieved Thu, 02 May 2024 06:15:19 +0000
QR Codes:

Original text written by user:
IsPrivate?No (this computation is public)
User-defined keywords
Estimated Impact57
Family? (F = Feedback message, R = changed R code, M = changed R Module, P = changed Parameters, D = changed Data)
-     [Multiple Regression] [Competence to learn] [2010-11-17 07:43:53] [b98453cac15ba1066b407e146608df68]
-    D    [Multiple Regression] [Multiple Regressi...] [2012-11-15 15:16:57] [b126d3b292555ea554033ae826bcef2a] [Current]
Feedback Forum

Post a new message
Dataseries X:
1866	22	78.1
1867	21.8	74.5
1868	21.5	74.6
1869	21.3	75.5
1870	21.1	76.9
1871	21.2	76.3
1872	21	73.8
1873	20.8	73.4
1874	20.5	75.8
1875	20.4	76.9
1876	20.1	73.2
1877	19.9	72.1
1878	19.6	74.3
1879	19.4	73.1
1880	19.2	72.2
1881	19.1	69.4
1882	19.1	70.8
1883	18.9	71.1
1884	18.7	71.2
1885	18.7	70.6
1886	18.7	71.1
1887	18.4	70.3
1888	18.4	68.3
1889	18.3	68.9
1890	18.4	71.9
1891	18.3	73.3
1892	18.3	70.9
1893	18	70
1894	17.7	65.5
1895	17.7	70.1
1896	17.9	66.6
1897	17.6	67.4
1898	17.7	67.8
1899	17.4	69.4
1900	17.1	69.4
1901	16.8	66.7
1902	16.5	65
1903	16.2	63.1
1904	15.8	65
1905	15.5	63.9
1906	15.2	63
1907	14.9	62.2
1908	14.6	61.4
1909	14.4	61
1910	14.5	58.8
1911	14.2	61


Summary of computational transaction
Raw Inputview raw input (R code)
Raw Outputview raw output of R engine
Computing time9 seconds
R Server'Gertrude Mary Cox' @ cox.wessa.net

\begin{tabular}{lllllllll}
\hline
Summary of computational transaction \tabularnewline
Raw Input & view raw input (R code)  \tabularnewline
Raw Output & view raw output of R engine  \tabularnewline
Computing time & 9 seconds \tabularnewline
R Server & 'Gertrude Mary Cox' @ cox.wessa.net \tabularnewline
\hline
\end{tabular}
%Source: https://freestatistics.org/blog/index.php?pk=189703&T=0

[TABLE]
[ROW][C]Summary of computational transaction[/C][/ROW]
[ROW][C]Raw Input[/C][C]view raw input (R code) [/C][/ROW]
[ROW][C]Raw Output[/C][C]view raw output of R engine [/C][/ROW]
[ROW][C]Computing time[/C][C]9 seconds[/C][/ROW]
[ROW][C]R Server[/C][C]'Gertrude Mary Cox' @ cox.wessa.net[/C][/ROW]
[/TABLE]
Source: https://freestatistics.org/blog/index.php?pk=189703&T=0

Globally Unique Identifier (entire table): ba.freestatistics.org/blog/index.php?pk=189703&T=0

As an alternative you can also use a QR Code:  

The GUIDs for individual cells are displayed in the table below:

Summary of computational transaction
Raw Inputview raw input (R code)
Raw Outputview raw output of R engine
Computing time9 seconds
R Server'Gertrude Mary Cox' @ cox.wessa.net


Multiple Linear Regression - Estimated Regression Equation
marriages[t] = -95.7589169571333 + 0.0628532671797702year[t] + 2.55171334463017mortality[t] + e[t]

\begin{tabular}{lllllllll}
\hline
Multiple Linear Regression - Estimated Regression Equation \tabularnewline
marriages[t] =  -95.7589169571333 +  0.0628532671797702year[t] +  2.55171334463017mortality[t]  + e[t] \tabularnewline
\hline
\end{tabular}
%Source: https://freestatistics.org/blog/index.php?pk=189703&T=1

[TABLE]
[ROW][C]Multiple Linear Regression - Estimated Regression Equation[/C][/ROW]
[ROW][C]marriages[t] =  -95.7589169571333 +  0.0628532671797702year[t] +  2.55171334463017mortality[t]  + e[t][/C][/ROW]
[/TABLE]
Source: https://freestatistics.org/blog/index.php?pk=189703&T=1

Globally Unique Identifier (entire table): ba.freestatistics.org/blog/index.php?pk=189703&T=1

As an alternative you can also use a QR Code:  

The GUIDs for individual cells are displayed in the table below:

Multiple Linear Regression - Estimated Regression Equation
marriages[t] = -95.7589169571333 + 0.0628532671797702year[t] + 2.55171334463017mortality[t] + e[t]


Multiple Linear Regression - Ordinary Least Squares
VariableParameterS.D.T-STATH0: parameter = 02-tail p-value1-tail p-value
(Intercept)-95.7589169571333184.713053-0.51840.6068230.303411
year0.06285326717977020.0922720.68120.4994150.249708
mortality2.551713344630170.5799444.39997e-053.5e-05

\begin{tabular}{lllllllll}
\hline
Multiple Linear Regression - Ordinary Least Squares \tabularnewline
Variable & Parameter & S.D. & T-STATH0: parameter = 0 & 2-tail p-value & 1-tail p-value \tabularnewline
(Intercept) & -95.7589169571333 & 184.713053 & -0.5184 & 0.606823 & 0.303411 \tabularnewline
year & 0.0628532671797702 & 0.092272 & 0.6812 & 0.499415 & 0.249708 \tabularnewline
mortality & 2.55171334463017 & 0.579944 & 4.3999 & 7e-05 & 3.5e-05 \tabularnewline
\hline
\end{tabular}
%Source: https://freestatistics.org/blog/index.php?pk=189703&T=2

[TABLE]
[ROW][C]Multiple Linear Regression - Ordinary Least Squares[/C][/ROW]
[ROW][C]Variable[/C][C]Parameter[/C][C]S.D.[/C][C]T-STATH0: parameter = 0[/C][C]2-tail p-value[/C][C]1-tail p-value[/C][/ROW]
[ROW][C](Intercept)[/C][C]-95.7589169571333[/C][C]184.713053[/C][C]-0.5184[/C][C]0.606823[/C][C]0.303411[/C][/ROW]
[ROW][C]year[/C][C]0.0628532671797702[/C][C]0.092272[/C][C]0.6812[/C][C]0.499415[/C][C]0.249708[/C][/ROW]
[ROW][C]mortality[/C][C]2.55171334463017[/C][C]0.579944[/C][C]4.3999[/C][C]7e-05[/C][C]3.5e-05[/C][/ROW]
[/TABLE]
Source: https://freestatistics.org/blog/index.php?pk=189703&T=2

Globally Unique Identifier (entire table): ba.freestatistics.org/blog/index.php?pk=189703&T=2

As an alternative you can also use a QR Code:  

The GUIDs for individual cells are displayed in the table below:

Multiple Linear Regression - Ordinary Least Squares
VariableParameterS.D.T-STATH0: parameter = 02-tail p-value1-tail p-value
(Intercept)-95.7589169571333184.713053-0.51840.6068230.303411
year0.06285326717977020.0922720.68120.4994150.249708
mortality2.551713344630170.5799444.39997e-053.5e-05


Multiple Linear Regression - Regression Statistics
Multiple R0.952073063013806
R-squared0.90644311731649
Adjusted R-squared0.902091634400978
F-TEST (value)208.306716334613
F-TEST (DF numerator)2
F-TEST (DF denominator)43
p-value0
Multiple Linear Regression - Residual Statistics
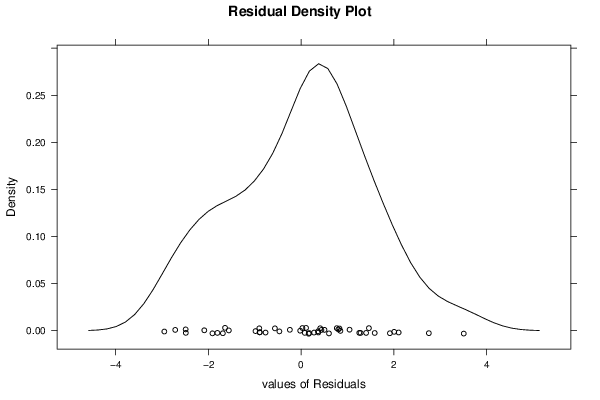
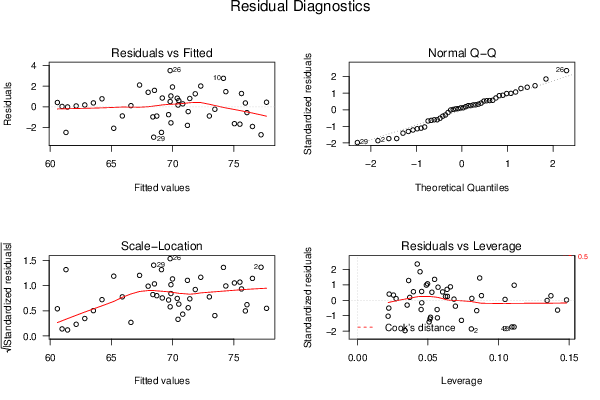
Residual Standard Deviation1.51924520741372
Sum Squared Residuals99.2485580107304

\begin{tabular}{lllllllll}
\hline
Multiple Linear Regression - Regression Statistics \tabularnewline
Multiple R & 0.952073063013806 \tabularnewline
R-squared & 0.90644311731649 \tabularnewline
Adjusted R-squared & 0.902091634400978 \tabularnewline
F-TEST (value) & 208.306716334613 \tabularnewline
F-TEST (DF numerator) & 2 \tabularnewline
F-TEST (DF denominator) & 43 \tabularnewline
p-value & 0 \tabularnewline
Multiple Linear Regression - Residual Statistics \tabularnewline
Residual Standard Deviation & 1.51924520741372 \tabularnewline
Sum Squared Residuals & 99.2485580107304 \tabularnewline
\hline
\end{tabular}
%Source: https://freestatistics.org/blog/index.php?pk=189703&T=3

[TABLE]
[ROW][C]Multiple Linear Regression - Regression Statistics[/C][/ROW]
[ROW][C]Multiple R[/C][C]0.952073063013806[/C][/ROW]
[ROW][C]R-squared[/C][C]0.90644311731649[/C][/ROW]
[ROW][C]Adjusted R-squared[/C][C]0.902091634400978[/C][/ROW]
[ROW][C]F-TEST (value)[/C][C]208.306716334613[/C][/ROW]
[ROW][C]F-TEST (DF numerator)[/C][C]2[/C][/ROW]
[ROW][C]F-TEST (DF denominator)[/C][C]43[/C][/ROW]
[ROW][C]p-value[/C][C]0[/C][/ROW]
[ROW][C]Multiple Linear Regression - Residual Statistics[/C][/ROW]
[ROW][C]Residual Standard Deviation[/C][C]1.51924520741372[/C][/ROW]
[ROW][C]Sum Squared Residuals[/C][C]99.2485580107304[/C][/ROW]
[/TABLE]
Source: https://freestatistics.org/blog/index.php?pk=189703&T=3

Globally Unique Identifier (entire table): ba.freestatistics.org/blog/index.php?pk=189703&T=3

As an alternative you can also use a QR Code:  

The GUIDs for individual cells are displayed in the table below:

Multiple Linear Regression - Regression Statistics
Multiple R0.952073063013806
R-squared0.90644311731649
Adjusted R-squared0.902091634400978
F-TEST (value)208.306716334613
F-TEST (DF numerator)2
F-TEST (DF denominator)43
p-value0
Multiple Linear Regression - Residual Statistics
Residual Standard Deviation1.51924520741372
Sum Squared Residuals99.2485580107304


Multiple Linear Regression - Actuals, Interpolation, and Residuals
Time or IndexActualsInterpolationForecastResidualsPrediction Error
178.177.66297318218180.437026817818173
274.577.2154837804355-2.71548378043555
374.676.5128230442263-1.91282304422627
475.576.06533364248-0.56533364248
576.975.61784424073371.28215575926627
676.375.93586884237650.364131157623477
773.875.4883794406303-1.68837944063026
873.475.040890038884-1.64089003888399
975.874.33822930267471.46177069732529
1076.974.14591123539152.75408876460855
1173.273.4432504991822-0.243250499182182
1272.172.9957610974359-0.895761097435918
1374.372.29310036122662.00689963877336
1473.171.84561095948041.25438904051963
1572.271.39812155773410.801878442265899
1669.471.2058034904509-1.80580349045086
1770.871.2686567576306-0.468656757630635
1871.170.82116735588440.278832644115634
1971.270.37367795413810.826322045861905
2070.670.43653122131790.163468778682127
2171.170.49938448849760.600615511502356
2270.369.79672375228840.503276247711643
2368.369.8595770194681-1.55957701946813
2468.969.6672589521849-0.767258952184877
2571.969.98528355382771.91471644617234
2673.369.79296548654443.50703451345557
2770.969.85581875372421.04418124627581
287069.15315801751490.84684198248509
2965.568.4504972813056-2.95049728130563
3070.168.51335054848541.5866494515146
3166.669.0865464845912-2.48654648459121
3267.468.3838857483819-0.983885748381919
3367.868.7019103500247-0.90191035002471
3469.467.99924961381541.40075038618458
3569.467.29658887760622.10341112239386
3666.766.59392814139690.106071858603138
376565.8912674051876-0.891267405187582
3863.165.1886066689783-2.0886066689783
396564.2307745983060.769225401693998
4063.963.52811386209670.37188613790328
416362.82545312588740.174546874112565
4262.262.12279238967820.0772076103218483
4361.461.4201316534689-0.0201316534688726
446160.97264225172260.0273577482773916
4558.861.2906668533654-2.4906668533654
466160.58800611715610.411993882843889

\begin{tabular}{lllllllll}
\hline
Multiple Linear Regression - Actuals, Interpolation, and Residuals \tabularnewline
Time or Index & Actuals & InterpolationForecast & ResidualsPrediction Error \tabularnewline
1 & 78.1 & 77.6629731821818 & 0.437026817818173 \tabularnewline
2 & 74.5 & 77.2154837804355 & -2.71548378043555 \tabularnewline
3 & 74.6 & 76.5128230442263 & -1.91282304422627 \tabularnewline
4 & 75.5 & 76.06533364248 & -0.56533364248 \tabularnewline
5 & 76.9 & 75.6178442407337 & 1.28215575926627 \tabularnewline
6 & 76.3 & 75.9358688423765 & 0.364131157623477 \tabularnewline
7 & 73.8 & 75.4883794406303 & -1.68837944063026 \tabularnewline
8 & 73.4 & 75.040890038884 & -1.64089003888399 \tabularnewline
9 & 75.8 & 74.3382293026747 & 1.46177069732529 \tabularnewline
10 & 76.9 & 74.1459112353915 & 2.75408876460855 \tabularnewline
11 & 73.2 & 73.4432504991822 & -0.243250499182182 \tabularnewline
12 & 72.1 & 72.9957610974359 & -0.895761097435918 \tabularnewline
13 & 74.3 & 72.2931003612266 & 2.00689963877336 \tabularnewline
14 & 73.1 & 71.8456109594804 & 1.25438904051963 \tabularnewline
15 & 72.2 & 71.3981215577341 & 0.801878442265899 \tabularnewline
16 & 69.4 & 71.2058034904509 & -1.80580349045086 \tabularnewline
17 & 70.8 & 71.2686567576306 & -0.468656757630635 \tabularnewline
18 & 71.1 & 70.8211673558844 & 0.278832644115634 \tabularnewline
19 & 71.2 & 70.3736779541381 & 0.826322045861905 \tabularnewline
20 & 70.6 & 70.4365312213179 & 0.163468778682127 \tabularnewline
21 & 71.1 & 70.4993844884976 & 0.600615511502356 \tabularnewline
22 & 70.3 & 69.7967237522884 & 0.503276247711643 \tabularnewline
23 & 68.3 & 69.8595770194681 & -1.55957701946813 \tabularnewline
24 & 68.9 & 69.6672589521849 & -0.767258952184877 \tabularnewline
25 & 71.9 & 69.9852835538277 & 1.91471644617234 \tabularnewline
26 & 73.3 & 69.7929654865444 & 3.50703451345557 \tabularnewline
27 & 70.9 & 69.8558187537242 & 1.04418124627581 \tabularnewline
28 & 70 & 69.1531580175149 & 0.84684198248509 \tabularnewline
29 & 65.5 & 68.4504972813056 & -2.95049728130563 \tabularnewline
30 & 70.1 & 68.5133505484854 & 1.5866494515146 \tabularnewline
31 & 66.6 & 69.0865464845912 & -2.48654648459121 \tabularnewline
32 & 67.4 & 68.3838857483819 & -0.983885748381919 \tabularnewline
33 & 67.8 & 68.7019103500247 & -0.90191035002471 \tabularnewline
34 & 69.4 & 67.9992496138154 & 1.40075038618458 \tabularnewline
35 & 69.4 & 67.2965888776062 & 2.10341112239386 \tabularnewline
36 & 66.7 & 66.5939281413969 & 0.106071858603138 \tabularnewline
37 & 65 & 65.8912674051876 & -0.891267405187582 \tabularnewline
38 & 63.1 & 65.1886066689783 & -2.0886066689783 \tabularnewline
39 & 65 & 64.230774598306 & 0.769225401693998 \tabularnewline
40 & 63.9 & 63.5281138620967 & 0.37188613790328 \tabularnewline
41 & 63 & 62.8254531258874 & 0.174546874112565 \tabularnewline
42 & 62.2 & 62.1227923896782 & 0.0772076103218483 \tabularnewline
43 & 61.4 & 61.4201316534689 & -0.0201316534688726 \tabularnewline
44 & 61 & 60.9726422517226 & 0.0273577482773916 \tabularnewline
45 & 58.8 & 61.2906668533654 & -2.4906668533654 \tabularnewline
46 & 61 & 60.5880061171561 & 0.411993882843889 \tabularnewline
\hline
\end{tabular}
%Source: https://freestatistics.org/blog/index.php?pk=189703&T=4

[TABLE]
[ROW][C]Multiple Linear Regression - Actuals, Interpolation, and Residuals[/C][/ROW]
[ROW][C]Time or Index[/C][C]Actuals[/C][C]InterpolationForecast[/C][C]ResidualsPrediction Error[/C][/ROW]
[ROW][C]1[/C][C]78.1[/C][C]77.6629731821818[/C][C]0.437026817818173[/C][/ROW]
[ROW][C]2[/C][C]74.5[/C][C]77.2154837804355[/C][C]-2.71548378043555[/C][/ROW]
[ROW][C]3[/C][C]74.6[/C][C]76.5128230442263[/C][C]-1.91282304422627[/C][/ROW]
[ROW][C]4[/C][C]75.5[/C][C]76.06533364248[/C][C]-0.56533364248[/C][/ROW]
[ROW][C]5[/C][C]76.9[/C][C]75.6178442407337[/C][C]1.28215575926627[/C][/ROW]
[ROW][C]6[/C][C]76.3[/C][C]75.9358688423765[/C][C]0.364131157623477[/C][/ROW]
[ROW][C]7[/C][C]73.8[/C][C]75.4883794406303[/C][C]-1.68837944063026[/C][/ROW]
[ROW][C]8[/C][C]73.4[/C][C]75.040890038884[/C][C]-1.64089003888399[/C][/ROW]
[ROW][C]9[/C][C]75.8[/C][C]74.3382293026747[/C][C]1.46177069732529[/C][/ROW]
[ROW][C]10[/C][C]76.9[/C][C]74.1459112353915[/C][C]2.75408876460855[/C][/ROW]
[ROW][C]11[/C][C]73.2[/C][C]73.4432504991822[/C][C]-0.243250499182182[/C][/ROW]
[ROW][C]12[/C][C]72.1[/C][C]72.9957610974359[/C][C]-0.895761097435918[/C][/ROW]
[ROW][C]13[/C][C]74.3[/C][C]72.2931003612266[/C][C]2.00689963877336[/C][/ROW]
[ROW][C]14[/C][C]73.1[/C][C]71.8456109594804[/C][C]1.25438904051963[/C][/ROW]
[ROW][C]15[/C][C]72.2[/C][C]71.3981215577341[/C][C]0.801878442265899[/C][/ROW]
[ROW][C]16[/C][C]69.4[/C][C]71.2058034904509[/C][C]-1.80580349045086[/C][/ROW]
[ROW][C]17[/C][C]70.8[/C][C]71.2686567576306[/C][C]-0.468656757630635[/C][/ROW]
[ROW][C]18[/C][C]71.1[/C][C]70.8211673558844[/C][C]0.278832644115634[/C][/ROW]
[ROW][C]19[/C][C]71.2[/C][C]70.3736779541381[/C][C]0.826322045861905[/C][/ROW]
[ROW][C]20[/C][C]70.6[/C][C]70.4365312213179[/C][C]0.163468778682127[/C][/ROW]
[ROW][C]21[/C][C]71.1[/C][C]70.4993844884976[/C][C]0.600615511502356[/C][/ROW]
[ROW][C]22[/C][C]70.3[/C][C]69.7967237522884[/C][C]0.503276247711643[/C][/ROW]
[ROW][C]23[/C][C]68.3[/C][C]69.8595770194681[/C][C]-1.55957701946813[/C][/ROW]
[ROW][C]24[/C][C]68.9[/C][C]69.6672589521849[/C][C]-0.767258952184877[/C][/ROW]
[ROW][C]25[/C][C]71.9[/C][C]69.9852835538277[/C][C]1.91471644617234[/C][/ROW]
[ROW][C]26[/C][C]73.3[/C][C]69.7929654865444[/C][C]3.50703451345557[/C][/ROW]
[ROW][C]27[/C][C]70.9[/C][C]69.8558187537242[/C][C]1.04418124627581[/C][/ROW]
[ROW][C]28[/C][C]70[/C][C]69.1531580175149[/C][C]0.84684198248509[/C][/ROW]
[ROW][C]29[/C][C]65.5[/C][C]68.4504972813056[/C][C]-2.95049728130563[/C][/ROW]
[ROW][C]30[/C][C]70.1[/C][C]68.5133505484854[/C][C]1.5866494515146[/C][/ROW]
[ROW][C]31[/C][C]66.6[/C][C]69.0865464845912[/C][C]-2.48654648459121[/C][/ROW]
[ROW][C]32[/C][C]67.4[/C][C]68.3838857483819[/C][C]-0.983885748381919[/C][/ROW]
[ROW][C]33[/C][C]67.8[/C][C]68.7019103500247[/C][C]-0.90191035002471[/C][/ROW]
[ROW][C]34[/C][C]69.4[/C][C]67.9992496138154[/C][C]1.40075038618458[/C][/ROW]
[ROW][C]35[/C][C]69.4[/C][C]67.2965888776062[/C][C]2.10341112239386[/C][/ROW]
[ROW][C]36[/C][C]66.7[/C][C]66.5939281413969[/C][C]0.106071858603138[/C][/ROW]
[ROW][C]37[/C][C]65[/C][C]65.8912674051876[/C][C]-0.891267405187582[/C][/ROW]
[ROW][C]38[/C][C]63.1[/C][C]65.1886066689783[/C][C]-2.0886066689783[/C][/ROW]
[ROW][C]39[/C][C]65[/C][C]64.230774598306[/C][C]0.769225401693998[/C][/ROW]
[ROW][C]40[/C][C]63.9[/C][C]63.5281138620967[/C][C]0.37188613790328[/C][/ROW]
[ROW][C]41[/C][C]63[/C][C]62.8254531258874[/C][C]0.174546874112565[/C][/ROW]
[ROW][C]42[/C][C]62.2[/C][C]62.1227923896782[/C][C]0.0772076103218483[/C][/ROW]
[ROW][C]43[/C][C]61.4[/C][C]61.4201316534689[/C][C]-0.0201316534688726[/C][/ROW]
[ROW][C]44[/C][C]61[/C][C]60.9726422517226[/C][C]0.0273577482773916[/C][/ROW]
[ROW][C]45[/C][C]58.8[/C][C]61.2906668533654[/C][C]-2.4906668533654[/C][/ROW]
[ROW][C]46[/C][C]61[/C][C]60.5880061171561[/C][C]0.411993882843889[/C][/ROW]
[/TABLE]
Source: https://freestatistics.org/blog/index.php?pk=189703&T=4

Globally Unique Identifier (entire table): ba.freestatistics.org/blog/index.php?pk=189703&T=4

As an alternative you can also use a QR Code:  

The GUIDs for individual cells are displayed in the table below:

Multiple Linear Regression - Actuals, Interpolation, and Residuals
Time or IndexActualsInterpolationForecastResidualsPrediction Error
178.177.66297318218180.437026817818173
274.577.2154837804355-2.71548378043555
374.676.5128230442263-1.91282304422627
475.576.06533364248-0.56533364248
576.975.61784424073371.28215575926627
676.375.93586884237650.364131157623477
773.875.4883794406303-1.68837944063026
873.475.040890038884-1.64089003888399
975.874.33822930267471.46177069732529
1076.974.14591123539152.75408876460855
1173.273.4432504991822-0.243250499182182
1272.172.9957610974359-0.895761097435918
1374.372.29310036122662.00689963877336
1473.171.84561095948041.25438904051963
1572.271.39812155773410.801878442265899
1669.471.2058034904509-1.80580349045086
1770.871.2686567576306-0.468656757630635
1871.170.82116735588440.278832644115634
1971.270.37367795413810.826322045861905
2070.670.43653122131790.163468778682127
2171.170.49938448849760.600615511502356
2270.369.79672375228840.503276247711643
2368.369.8595770194681-1.55957701946813
2468.969.6672589521849-0.767258952184877
2571.969.98528355382771.91471644617234
2673.369.79296548654443.50703451345557
2770.969.85581875372421.04418124627581
287069.15315801751490.84684198248509
2965.568.4504972813056-2.95049728130563
3070.168.51335054848541.5866494515146
3166.669.0865464845912-2.48654648459121
3267.468.3838857483819-0.983885748381919
3367.868.7019103500247-0.90191035002471
3469.467.99924961381541.40075038618458
3569.467.29658887760622.10341112239386
3666.766.59392814139690.106071858603138
376565.8912674051876-0.891267405187582
3863.165.1886066689783-2.0886066689783
396564.2307745983060.769225401693998
4063.963.52811386209670.37188613790328
416362.82545312588740.174546874112565
4262.262.12279238967820.0772076103218483
4361.461.4201316534689-0.0201316534688726
446160.97264225172260.0273577482773916
4558.861.2906668533654-2.4906668533654
466160.58800611715610.411993882843889


Goldfeld-Quandt test for Heteroskedasticity
p-valuesAlternative Hypothesis
breakpoint indexgreater2-sidedless
60.7290223272960510.5419553454078990.270977672703949
70.7345121421832640.5309757156334730.265487857816736
80.6823866932489340.6352266135021310.317613306751066
90.6532176675353710.6935646649292580.346782332464629
100.7344740605602590.5310518788794820.265525939439741
110.7264312064437150.547137587112570.273568793556285
120.7380392958330350.523921408333930.261960704166965
130.693998154228540.612003691542920.30600184577146
140.6121540640371920.7756918719256170.387845935962808
150.5344540932713210.9310918134573580.465545906728679
160.6966960787476550.606607842504690.303303921252345
170.6352192937355380.7295614125289230.364780706264462
180.5442132696630360.9115734606739280.455786730336964
190.4559457194578580.9118914389157150.544054280542142
200.3667400770912210.7334801541824420.633259922908779
210.2898207995365480.5796415990730970.710179200463452
220.2167328579879990.4334657159759970.783267142012001
230.2477919593844070.4955839187688140.752208040615593
240.2407774863181380.4815549726362770.759222513681862
250.2705762814873580.5411525629747150.729423718512642
260.4877556922058250.9755113844116510.512244307794175
270.4326421281018230.8652842562036450.567357871898178
280.3984886813172980.7969773626345970.601511318682701
290.703135071740180.5937298565196410.29686492825982
300.6803962364083370.6392075271833260.319603763591663
310.8240958483225970.3518083033548050.175904151677403
320.8344890773013670.3310218453972650.165510922698633
330.8151005297451410.3697989405097170.184899470254859
340.7823751779847990.4352496440304010.217624822015201
350.9165058544538430.1669882910923130.0834941455461566
360.903161565678840.193676868642320.0968384343211598
370.84337076771790.3132584645642010.1566292322821
380.8778899870351230.2442200259297540.122110012964877
390.7993260437414180.4013479125171650.200673956258582
400.6841105902606560.6317788194786880.315889409739344

\begin{tabular}{lllllllll}
\hline
Goldfeld-Quandt test for Heteroskedasticity \tabularnewline
p-values & Alternative Hypothesis \tabularnewline
breakpoint index & greater & 2-sided & less \tabularnewline
6 & 0.729022327296051 & 0.541955345407899 & 0.270977672703949 \tabularnewline
7 & 0.734512142183264 & 0.530975715633473 & 0.265487857816736 \tabularnewline
8 & 0.682386693248934 & 0.635226613502131 & 0.317613306751066 \tabularnewline
9 & 0.653217667535371 & 0.693564664929258 & 0.346782332464629 \tabularnewline
10 & 0.734474060560259 & 0.531051878879482 & 0.265525939439741 \tabularnewline
11 & 0.726431206443715 & 0.54713758711257 & 0.273568793556285 \tabularnewline
12 & 0.738039295833035 & 0.52392140833393 & 0.261960704166965 \tabularnewline
13 & 0.69399815422854 & 0.61200369154292 & 0.30600184577146 \tabularnewline
14 & 0.612154064037192 & 0.775691871925617 & 0.387845935962808 \tabularnewline
15 & 0.534454093271321 & 0.931091813457358 & 0.465545906728679 \tabularnewline
16 & 0.696696078747655 & 0.60660784250469 & 0.303303921252345 \tabularnewline
17 & 0.635219293735538 & 0.729561412528923 & 0.364780706264462 \tabularnewline
18 & 0.544213269663036 & 0.911573460673928 & 0.455786730336964 \tabularnewline
19 & 0.455945719457858 & 0.911891438915715 & 0.544054280542142 \tabularnewline
20 & 0.366740077091221 & 0.733480154182442 & 0.633259922908779 \tabularnewline
21 & 0.289820799536548 & 0.579641599073097 & 0.710179200463452 \tabularnewline
22 & 0.216732857987999 & 0.433465715975997 & 0.783267142012001 \tabularnewline
23 & 0.247791959384407 & 0.495583918768814 & 0.752208040615593 \tabularnewline
24 & 0.240777486318138 & 0.481554972636277 & 0.759222513681862 \tabularnewline
25 & 0.270576281487358 & 0.541152562974715 & 0.729423718512642 \tabularnewline
26 & 0.487755692205825 & 0.975511384411651 & 0.512244307794175 \tabularnewline
27 & 0.432642128101823 & 0.865284256203645 & 0.567357871898178 \tabularnewline
28 & 0.398488681317298 & 0.796977362634597 & 0.601511318682701 \tabularnewline
29 & 0.70313507174018 & 0.593729856519641 & 0.29686492825982 \tabularnewline
30 & 0.680396236408337 & 0.639207527183326 & 0.319603763591663 \tabularnewline
31 & 0.824095848322597 & 0.351808303354805 & 0.175904151677403 \tabularnewline
32 & 0.834489077301367 & 0.331021845397265 & 0.165510922698633 \tabularnewline
33 & 0.815100529745141 & 0.369798940509717 & 0.184899470254859 \tabularnewline
34 & 0.782375177984799 & 0.435249644030401 & 0.217624822015201 \tabularnewline
35 & 0.916505854453843 & 0.166988291092313 & 0.0834941455461566 \tabularnewline
36 & 0.90316156567884 & 0.19367686864232 & 0.0968384343211598 \tabularnewline
37 & 0.8433707677179 & 0.313258464564201 & 0.1566292322821 \tabularnewline
38 & 0.877889987035123 & 0.244220025929754 & 0.122110012964877 \tabularnewline
39 & 0.799326043741418 & 0.401347912517165 & 0.200673956258582 \tabularnewline
40 & 0.684110590260656 & 0.631778819478688 & 0.315889409739344 \tabularnewline
\hline
\end{tabular}
%Source: https://freestatistics.org/blog/index.php?pk=189703&T=5

[TABLE]
[ROW][C]Goldfeld-Quandt test for Heteroskedasticity[/C][/ROW]
[ROW][C]p-values[/C][C]Alternative Hypothesis[/C][/ROW]
[ROW][C]breakpoint index[/C][C]greater[/C][C]2-sided[/C][C]less[/C][/ROW]
[ROW][C]6[/C][C]0.729022327296051[/C][C]0.541955345407899[/C][C]0.270977672703949[/C][/ROW]
[ROW][C]7[/C][C]0.734512142183264[/C][C]0.530975715633473[/C][C]0.265487857816736[/C][/ROW]
[ROW][C]8[/C][C]0.682386693248934[/C][C]0.635226613502131[/C][C]0.317613306751066[/C][/ROW]
[ROW][C]9[/C][C]0.653217667535371[/C][C]0.693564664929258[/C][C]0.346782332464629[/C][/ROW]
[ROW][C]10[/C][C]0.734474060560259[/C][C]0.531051878879482[/C][C]0.265525939439741[/C][/ROW]
[ROW][C]11[/C][C]0.726431206443715[/C][C]0.54713758711257[/C][C]0.273568793556285[/C][/ROW]
[ROW][C]12[/C][C]0.738039295833035[/C][C]0.52392140833393[/C][C]0.261960704166965[/C][/ROW]
[ROW][C]13[/C][C]0.69399815422854[/C][C]0.61200369154292[/C][C]0.30600184577146[/C][/ROW]
[ROW][C]14[/C][C]0.612154064037192[/C][C]0.775691871925617[/C][C]0.387845935962808[/C][/ROW]
[ROW][C]15[/C][C]0.534454093271321[/C][C]0.931091813457358[/C][C]0.465545906728679[/C][/ROW]
[ROW][C]16[/C][C]0.696696078747655[/C][C]0.60660784250469[/C][C]0.303303921252345[/C][/ROW]
[ROW][C]17[/C][C]0.635219293735538[/C][C]0.729561412528923[/C][C]0.364780706264462[/C][/ROW]
[ROW][C]18[/C][C]0.544213269663036[/C][C]0.911573460673928[/C][C]0.455786730336964[/C][/ROW]
[ROW][C]19[/C][C]0.455945719457858[/C][C]0.911891438915715[/C][C]0.544054280542142[/C][/ROW]
[ROW][C]20[/C][C]0.366740077091221[/C][C]0.733480154182442[/C][C]0.633259922908779[/C][/ROW]
[ROW][C]21[/C][C]0.289820799536548[/C][C]0.579641599073097[/C][C]0.710179200463452[/C][/ROW]
[ROW][C]22[/C][C]0.216732857987999[/C][C]0.433465715975997[/C][C]0.783267142012001[/C][/ROW]
[ROW][C]23[/C][C]0.247791959384407[/C][C]0.495583918768814[/C][C]0.752208040615593[/C][/ROW]
[ROW][C]24[/C][C]0.240777486318138[/C][C]0.481554972636277[/C][C]0.759222513681862[/C][/ROW]
[ROW][C]25[/C][C]0.270576281487358[/C][C]0.541152562974715[/C][C]0.729423718512642[/C][/ROW]
[ROW][C]26[/C][C]0.487755692205825[/C][C]0.975511384411651[/C][C]0.512244307794175[/C][/ROW]
[ROW][C]27[/C][C]0.432642128101823[/C][C]0.865284256203645[/C][C]0.567357871898178[/C][/ROW]
[ROW][C]28[/C][C]0.398488681317298[/C][C]0.796977362634597[/C][C]0.601511318682701[/C][/ROW]
[ROW][C]29[/C][C]0.70313507174018[/C][C]0.593729856519641[/C][C]0.29686492825982[/C][/ROW]
[ROW][C]30[/C][C]0.680396236408337[/C][C]0.639207527183326[/C][C]0.319603763591663[/C][/ROW]
[ROW][C]31[/C][C]0.824095848322597[/C][C]0.351808303354805[/C][C]0.175904151677403[/C][/ROW]
[ROW][C]32[/C][C]0.834489077301367[/C][C]0.331021845397265[/C][C]0.165510922698633[/C][/ROW]
[ROW][C]33[/C][C]0.815100529745141[/C][C]0.369798940509717[/C][C]0.184899470254859[/C][/ROW]
[ROW][C]34[/C][C]0.782375177984799[/C][C]0.435249644030401[/C][C]0.217624822015201[/C][/ROW]
[ROW][C]35[/C][C]0.916505854453843[/C][C]0.166988291092313[/C][C]0.0834941455461566[/C][/ROW]
[ROW][C]36[/C][C]0.90316156567884[/C][C]0.19367686864232[/C][C]0.0968384343211598[/C][/ROW]
[ROW][C]37[/C][C]0.8433707677179[/C][C]0.313258464564201[/C][C]0.1566292322821[/C][/ROW]
[ROW][C]38[/C][C]0.877889987035123[/C][C]0.244220025929754[/C][C]0.122110012964877[/C][/ROW]
[ROW][C]39[/C][C]0.799326043741418[/C][C]0.401347912517165[/C][C]0.200673956258582[/C][/ROW]
[ROW][C]40[/C][C]0.684110590260656[/C][C]0.631778819478688[/C][C]0.315889409739344[/C][/ROW]
[/TABLE]
Source: https://freestatistics.org/blog/index.php?pk=189703&T=5

Globally Unique Identifier (entire table): ba.freestatistics.org/blog/index.php?pk=189703&T=5

As an alternative you can also use a QR Code:  

The GUIDs for individual cells are displayed in the table below:

Goldfeld-Quandt test for Heteroskedasticity
p-valuesAlternative Hypothesis
breakpoint indexgreater2-sidedless
60.7290223272960510.5419553454078990.270977672703949
70.7345121421832640.5309757156334730.265487857816736
80.6823866932489340.6352266135021310.317613306751066
90.6532176675353710.6935646649292580.346782332464629
100.7344740605602590.5310518788794820.265525939439741
110.7264312064437150.547137587112570.273568793556285
120.7380392958330350.523921408333930.261960704166965
130.693998154228540.612003691542920.30600184577146
140.6121540640371920.7756918719256170.387845935962808
150.5344540932713210.9310918134573580.465545906728679
160.6966960787476550.606607842504690.303303921252345
170.6352192937355380.7295614125289230.364780706264462
180.5442132696630360.9115734606739280.455786730336964
190.4559457194578580.9118914389157150.544054280542142
200.3667400770912210.7334801541824420.633259922908779
210.2898207995365480.5796415990730970.710179200463452
220.2167328579879990.4334657159759970.783267142012001
230.2477919593844070.4955839187688140.752208040615593
240.2407774863181380.4815549726362770.759222513681862
250.2705762814873580.5411525629747150.729423718512642
260.4877556922058250.9755113844116510.512244307794175
270.4326421281018230.8652842562036450.567357871898178
280.3984886813172980.7969773626345970.601511318682701
290.703135071740180.5937298565196410.29686492825982
300.6803962364083370.6392075271833260.319603763591663
310.8240958483225970.3518083033548050.175904151677403
320.8344890773013670.3310218453972650.165510922698633
330.8151005297451410.3697989405097170.184899470254859
340.7823751779847990.4352496440304010.217624822015201
350.9165058544538430.1669882910923130.0834941455461566
360.903161565678840.193676868642320.0968384343211598
370.84337076771790.3132584645642010.1566292322821
380.8778899870351230.2442200259297540.122110012964877
390.7993260437414180.4013479125171650.200673956258582
400.6841105902606560.6317788194786880.315889409739344


Meta Analysis of Goldfeld-Quandt test for Heteroskedasticity
Description# significant tests% significant testsOK/NOK
1% type I error level00OK
5% type I error level00OK
10% type I error level00OK

\begin{tabular}{lllllllll}
\hline
Meta Analysis of Goldfeld-Quandt test for Heteroskedasticity \tabularnewline
Description & # significant tests & % significant tests & OK/NOK \tabularnewline
1% type I error level & 0 & 0 & OK \tabularnewline
5% type I error level & 0 & 0 & OK \tabularnewline
10% type I error level & 0 & 0 & OK \tabularnewline
\hline
\end{tabular}
%Source: https://freestatistics.org/blog/index.php?pk=189703&T=6

[TABLE]
[ROW][C]Meta Analysis of Goldfeld-Quandt test for Heteroskedasticity[/C][/ROW]
[ROW][C]Description[/C][C]# significant tests[/C][C]% significant tests[/C][C]OK/NOK[/C][/ROW]
[ROW][C]1% type I error level[/C][C]0[/C][C]0[/C][C]OK[/C][/ROW]
[ROW][C]5% type I error level[/C][C]0[/C][C]0[/C][C]OK[/C][/ROW]
[ROW][C]10% type I error level[/C][C]0[/C][C]0[/C][C]OK[/C][/ROW]
[/TABLE]
Source: https://freestatistics.org/blog/index.php?pk=189703&T=6

Globally Unique Identifier (entire table): ba.freestatistics.org/blog/index.php?pk=189703&T=6

As an alternative you can also use a QR Code:  

The GUIDs for individual cells are displayed in the table below:

Meta Analysis of Goldfeld-Quandt test for Heteroskedasticity
Description# significant tests% significant testsOK/NOK
1% type I error level00OK
5% type I error level00OK
10% type I error level00OK


Parameters (Session):
par1 = 3 ; par2 = Do not include Seasonal Dummies ; par3 = No Linear Trend ;
Parameters (R input):
par1 = 3 ; par2 = Do not include Seasonal Dummies ; par3 = No Linear Trend ;
R code (references can be found in the software module):
library(lattice)
library(lmtest)
n25 <- 25 #minimum number of obs. for Goldfeld-Quandt test
par1 <- as.numeric(par1)
x <- t(y)
k <- length(x[1,])
n <- length(x[,1])
x1 <- cbind(x[,par1], x[,1:k!=par1])
mycolnames <- c(colnames(x)[par1], colnames(x)[1:k!=par1])
colnames(x1) <- mycolnames #colnames(x)[par1]
x <- x1
if (par3 == 'First Differences'){
x2 <- array(0, dim=c(n-1,k), dimnames=list(1:(n-1), paste('(1-B)',colnames(x),sep='')))
for (i in 1:n-1) {
for (j in 1:k) {
x2[i,j] <- x[i+1,j] - x[i,j]
}
}
x <- x2
}
if (par2 == 'Include Monthly Dummies'){
x2 <- array(0, dim=c(n,11), dimnames=list(1:n, paste('M', seq(1:11), sep ='')))
for (i in 1:11){
x2[seq(i,n,12),i] <- 1
}
x <- cbind(x, x2)
}
if (par2 == 'Include Quarterly Dummies'){
x2 <- array(0, dim=c(n,3), dimnames=list(1:n, paste('Q', seq(1:3), sep ='')))
for (i in 1:3){
x2[seq(i,n,4),i] <- 1
}
x <- cbind(x, x2)
}
k <- length(x[1,])
if (par3 == 'Linear Trend'){
x <- cbind(x, c(1:n))
colnames(x)[k+1] <- 't'
}
x
k <- length(x[1,])
df <- as.data.frame(x)
(mylm <- lm(df))
(mysum <- summary(mylm))
if (n > n25) {
kp3 <- k + 3
nmkm3 <- n - k - 3
gqarr <- array(NA, dim=c(nmkm3-kp3+1,3))
numgqtests <- 0
numsignificant1 <- 0
numsignificant5 <- 0
numsignificant10 <- 0
for (mypoint in kp3:nmkm3) {
j <- 0
numgqtests <- numgqtests + 1
for (myalt in c('greater', 'two.sided', 'less')) {
j <- j + 1
gqarr[mypoint-kp3+1,j] <- gqtest(mylm, point=mypoint, alternative=myalt)$p.value
}
if (gqarr[mypoint-kp3+1,2] < 0.01) numsignificant1 <- numsignificant1 + 1
if (gqarr[mypoint-kp3+1,2] < 0.05) numsignificant5 <- numsignificant5 + 1
if (gqarr[mypoint-kp3+1,2] < 0.10) numsignificant10 <- numsignificant10 + 1
}
gqarr
}
bitmap(file='test0.png')
plot(x[,1], type='l', main='Actuals and Interpolation', ylab='value of Actuals and Interpolation (dots)', xlab='time or index')
points(x[,1]-mysum$resid)
grid()
dev.off()
bitmap(file='test1.png')
plot(mysum$resid, type='b', pch=19, main='Residuals', ylab='value of Residuals', xlab='time or index')
grid()
dev.off()
bitmap(file='test2.png')
hist(mysum$resid, main='Residual Histogram', xlab='values of Residuals')
grid()
dev.off()
bitmap(file='test3.png')
densityplot(~mysum$resid,col='black',main='Residual Density Plot', xlab='values of Residuals')
dev.off()
bitmap(file='test4.png')
qqnorm(mysum$resid, main='Residual Normal Q-Q Plot')
qqline(mysum$resid)
grid()
dev.off()
(myerror <- as.ts(mysum$resid))
bitmap(file='test5.png')
dum <- cbind(lag(myerror,k=1),myerror)
dum
dum1 <- dum[2:length(myerror),]
dum1
z <- as.data.frame(dum1)
z
plot(z,main=paste('Residual Lag plot, lowess, and regression line'), ylab='values of Residuals', xlab='lagged values of Residuals')
lines(lowess(z))
abline(lm(z))
grid()
dev.off()
bitmap(file='test6.png')
acf(mysum$resid, lag.max=length(mysum$resid)/2, main='Residual Autocorrelation Function')
grid()
dev.off()
bitmap(file='test7.png')
pacf(mysum$resid, lag.max=length(mysum$resid)/2, main='Residual Partial Autocorrelation Function')
grid()
dev.off()
bitmap(file='test8.png')
opar <- par(mfrow = c(2,2), oma = c(0, 0, 1.1, 0))
plot(mylm, las = 1, sub='Residual Diagnostics')
par(opar)
dev.off()
if (n > n25) {
bitmap(file='test9.png')
plot(kp3:nmkm3,gqarr[,2], main='Goldfeld-Quandt test',ylab='2-sided p-value',xlab='breakpoint')
grid()
dev.off()
}
load(file='createtable')
a<-table.start()
a<-table.row.start(a)
a<-table.element(a, 'Multiple Linear Regression - Estimated Regression Equation', 1, TRUE)
a<-table.row.end(a)
myeq <- colnames(x)[1]
myeq <- paste(myeq, '[t] = ', sep='')
for (i in 1:k){
if (mysum$coefficients[i,1] > 0) myeq <- paste(myeq, '+', '')
myeq <- paste(myeq, mysum$coefficients[i,1], sep=' ')
if (rownames(mysum$coefficients)[i] != '(Intercept)') {
myeq <- paste(myeq, rownames(mysum$coefficients)[i], sep='')
if (rownames(mysum$coefficients)[i] != 't') myeq <- paste(myeq, '[t]', sep='')
}
}
myeq <- paste(myeq, ' + e[t]')
a<-table.row.start(a)
a<-table.element(a, myeq)
a<-table.row.end(a)
a<-table.end(a)
table.save(a,file='mytable1.tab')
a<-table.start()
a<-table.row.start(a)
a<-table.element(a,hyperlink('ols1.htm','Multiple Linear Regression - Ordinary Least Squares',''), 6, TRUE)
a<-table.row.end(a)
a<-table.row.start(a)
a<-table.element(a,'Variable',header=TRUE)
a<-table.element(a,'Parameter',header=TRUE)
a<-table.element(a,'S.D.',header=TRUE)
a<-table.element(a,'T-STAT
H0: parameter = 0',header=TRUE)
a<-table.element(a,'2-tail p-value',header=TRUE)
a<-table.element(a,'1-tail p-value',header=TRUE)
a<-table.row.end(a)
for (i in 1:k){
a<-table.row.start(a)
a<-table.element(a,rownames(mysum$coefficients)[i],header=TRUE)
a<-table.element(a,mysum$coefficients[i,1])
a<-table.element(a, round(mysum$coefficients[i,2],6))
a<-table.element(a, round(mysum$coefficients[i,3],4))
a<-table.element(a, round(mysum$coefficients[i,4],6))
a<-table.element(a, round(mysum$coefficients[i,4]/2,6))
a<-table.row.end(a)
}
a<-table.end(a)
table.save(a,file='mytable2.tab')
a<-table.start()
a<-table.row.start(a)
a<-table.element(a, 'Multiple Linear Regression - Regression Statistics', 2, TRUE)
a<-table.row.end(a)
a<-table.row.start(a)
a<-table.element(a, 'Multiple R',1,TRUE)
a<-table.element(a, sqrt(mysum$r.squared))
a<-table.row.end(a)
a<-table.row.start(a)
a<-table.element(a, 'R-squared',1,TRUE)
a<-table.element(a, mysum$r.squared)
a<-table.row.end(a)
a<-table.row.start(a)
a<-table.element(a, 'Adjusted R-squared',1,TRUE)
a<-table.element(a, mysum$adj.r.squared)
a<-table.row.end(a)
a<-table.row.start(a)
a<-table.element(a, 'F-TEST (value)',1,TRUE)
a<-table.element(a, mysum$fstatistic[1])
a<-table.row.end(a)
a<-table.row.start(a)
a<-table.element(a, 'F-TEST (DF numerator)',1,TRUE)
a<-table.element(a, mysum$fstatistic[2])
a<-table.row.end(a)
a<-table.row.start(a)
a<-table.element(a, 'F-TEST (DF denominator)',1,TRUE)
a<-table.element(a, mysum$fstatistic[3])
a<-table.row.end(a)
a<-table.row.start(a)
a<-table.element(a, 'p-value',1,TRUE)
a<-table.element(a, 1-pf(mysum$fstatistic[1],mysum$fstatistic[2],mysum$fstatistic[3]))
a<-table.row.end(a)
a<-table.row.start(a)
a<-table.element(a, 'Multiple Linear Regression - Residual Statistics', 2, TRUE)
a<-table.row.end(a)
a<-table.row.start(a)
a<-table.element(a, 'Residual Standard Deviation',1,TRUE)
a<-table.element(a, mysum$sigma)
a<-table.row.end(a)
a<-table.row.start(a)
a<-table.element(a, 'Sum Squared Residuals',1,TRUE)
a<-table.element(a, sum(myerror*myerror))
a<-table.row.end(a)
a<-table.end(a)
table.save(a,file='mytable3.tab')
a<-table.start()
a<-table.row.start(a)
a<-table.element(a, 'Multiple Linear Regression - Actuals, Interpolation, and Residuals', 4, TRUE)
a<-table.row.end(a)
a<-table.row.start(a)
a<-table.element(a, 'Time or Index', 1, TRUE)
a<-table.element(a, 'Actuals', 1, TRUE)
a<-table.element(a, 'Interpolation
Forecast', 1, TRUE)
a<-table.element(a, 'Residuals
Prediction Error', 1, TRUE)
a<-table.row.end(a)
for (i in 1:n) {
a<-table.row.start(a)
a<-table.element(a,i, 1, TRUE)
a<-table.element(a,x[i])
a<-table.element(a,x[i]-mysum$resid[i])
a<-table.element(a,mysum$resid[i])
a<-table.row.end(a)
}
a<-table.end(a)
table.save(a,file='mytable4.tab')
if (n > n25) {
a<-table.start()
a<-table.row.start(a)
a<-table.element(a,'Goldfeld-Quandt test for Heteroskedasticity',4,TRUE)
a<-table.row.end(a)
a<-table.row.start(a)
a<-table.element(a,'p-values',header=TRUE)
a<-table.element(a,'Alternative Hypothesis',3,header=TRUE)
a<-table.row.end(a)
a<-table.row.start(a)
a<-table.element(a,'breakpoint index',header=TRUE)
a<-table.element(a,'greater',header=TRUE)
a<-table.element(a,'2-sided',header=TRUE)
a<-table.element(a,'less',header=TRUE)
a<-table.row.end(a)
for (mypoint in kp3:nmkm3) {
a<-table.row.start(a)
a<-table.element(a,mypoint,header=TRUE)
a<-table.element(a,gqarr[mypoint-kp3+1,1])
a<-table.element(a,gqarr[mypoint-kp3+1,2])
a<-table.element(a,gqarr[mypoint-kp3+1,3])
a<-table.row.end(a)
}
a<-table.end(a)
table.save(a,file='mytable5.tab')
a<-table.start()
a<-table.row.start(a)
a<-table.element(a,'Meta Analysis of Goldfeld-Quandt test for Heteroskedasticity',4,TRUE)
a<-table.row.end(a)
a<-table.row.start(a)
a<-table.element(a,'Description',header=TRUE)
a<-table.element(a,'# significant tests',header=TRUE)
a<-table.element(a,'% significant tests',header=TRUE)
a<-table.element(a,'OK/NOK',header=TRUE)
a<-table.row.end(a)
a<-table.row.start(a)
a<-table.element(a,'1% type I error level',header=TRUE)
a<-table.element(a,numsignificant1)
a<-table.element(a,numsignificant1/numgqtests)
if (numsignificant1/numgqtests < 0.01) dum <- 'OK' else dum <- 'NOK'
a<-table.element(a,dum)
a<-table.row.end(a)
a<-table.row.start(a)
a<-table.element(a,'5% type I error level',header=TRUE)
a<-table.element(a,numsignificant5)
a<-table.element(a,numsignificant5/numgqtests)
if (numsignificant5/numgqtests < 0.05) dum <- 'OK' else dum <- 'NOK'
a<-table.element(a,dum)
a<-table.row.end(a)
a<-table.row.start(a)
a<-table.element(a,'10% type I error level',header=TRUE)
a<-table.element(a,numsignificant10)
a<-table.element(a,numsignificant10/numgqtests)
if (numsignificant10/numgqtests < 0.1) dum <- 'OK' else dum <- 'NOK'
a<-table.element(a,dum)
a<-table.row.end(a)
a<-table.end(a)
table.save(a,file='mytable6.tab')
}