Free Statistics

of Irreproducible Research!

Author's title

Author*Unverified author*
R Software Modulerwasp_multipleregression.wasp
Title produced by softwareMultiple Regression
Date of computationThu, 15 Nov 2012 07:25:56 -0500
Cite this page as followsStatistical Computations at FreeStatistics.org, Office for Research Development and Education, URL https://freestatistics.org/blog/index.php?v=date/2012/Nov/15/t13529823957h4to9gsnglbg8x.htm/, Retrieved Thu, 02 May 2024 09:35:47 +0000
Statistical Computations at FreeStatistics.org, Office for Research Development and Education, URL https://freestatistics.org/blog/index.php?pk=189317, Retrieved Thu, 02 May 2024 09:35:47 +0000
QR Codes:

Original text written by user:
IsPrivate?No (this computation is public)
User-defined keywords
Estimated Impact110
Family? (F = Feedback message, R = changed R code, M = changed R Module, P = changed Parameters, D = changed Data)
-     [Multiple Regression] [Competence to learn] [2010-11-17 07:43:53] [b98453cac15ba1066b407e146608df68]
- R PD    [Multiple Regression] [WS7] [2012-11-15 12:25:56] [d0f95aac7f57db23d4da86d121b837fb] [Current]
Feedback Forum

Post a new message
Dataseries X:
22.3	187023	77526	226932
22.9	207806	84259	246076
22.8	225633	90322	260658
22.7	235344	94075	266978
22.3	216762	97099	274400
22.2	180396	93671	258391
23.1	168890	92114	243861
25.2	202808	99377	252344
24.9	208242	106390	252560
25.2	195008	106503	244959


Summary of computational transaction
Raw Inputview raw input (R code)
Raw Outputview raw output of R engine
Computing time8 seconds
R Server'Herman Ole Andreas Wold' @ wold.wessa.net

\begin{tabular}{lllllllll}
\hline
Summary of computational transaction \tabularnewline
Raw Input & view raw input (R code)  \tabularnewline
Raw Output & view raw output of R engine  \tabularnewline
Computing time & 8 seconds \tabularnewline
R Server & 'Herman Ole Andreas Wold' @ wold.wessa.net \tabularnewline
\hline
\end{tabular}
%Source: https://freestatistics.org/blog/index.php?pk=189317&T=0

[TABLE]
[ROW][C]Summary of computational transaction[/C][/ROW]
[ROW][C]Raw Input[/C][C]view raw input (R code) [/C][/ROW]
[ROW][C]Raw Output[/C][C]view raw output of R engine [/C][/ROW]
[ROW][C]Computing time[/C][C]8 seconds[/C][/ROW]
[ROW][C]R Server[/C][C]'Herman Ole Andreas Wold' @ wold.wessa.net[/C][/ROW]
[/TABLE]
Source: https://freestatistics.org/blog/index.php?pk=189317&T=0

Globally Unique Identifier (entire table): ba.freestatistics.org/blog/index.php?pk=189317&T=0

As an alternative you can also use a QR Code:  

The GUIDs for individual cells are displayed in the table below:

Summary of computational transaction
Raw Inputview raw input (R code)
Raw Outputview raw output of R engine
Computing time8 seconds
R Server'Herman Ole Andreas Wold' @ wold.wessa.net


Multiple Linear Regression - Estimated Regression Equation
Sociale_uitkeringen_(in_%_van_BBP)[t] = + 24.7864921233454 + 2.11578501819898e-05`#_werklozen_Vl`[t] + 0.000139357402800176`#_werklozen_Br`[t] -7.45316458655826e-05`#_werklozen_Wa`[t] + e[t]

\begin{tabular}{lllllllll}
\hline
Multiple Linear Regression - Estimated Regression Equation \tabularnewline
Sociale_uitkeringen_(in_%_van_BBP)[t] =  +  24.7864921233454 +  2.11578501819898e-05`#_werklozen_Vl`[t] +  0.000139357402800176`#_werklozen_Br`[t] -7.45316458655826e-05`#_werklozen_Wa`[t]  + e[t] \tabularnewline
\hline
\end{tabular}
%Source: https://freestatistics.org/blog/index.php?pk=189317&T=1

[TABLE]
[ROW][C]Multiple Linear Regression - Estimated Regression Equation[/C][/ROW]
[ROW][C]Sociale_uitkeringen_(in_%_van_BBP)[t] =  +  24.7864921233454 +  2.11578501819898e-05`#_werklozen_Vl`[t] +  0.000139357402800176`#_werklozen_Br`[t] -7.45316458655826e-05`#_werklozen_Wa`[t]  + e[t][/C][/ROW]
[/TABLE]
Source: https://freestatistics.org/blog/index.php?pk=189317&T=1

Globally Unique Identifier (entire table): ba.freestatistics.org/blog/index.php?pk=189317&T=1

As an alternative you can also use a QR Code:  

The GUIDs for individual cells are displayed in the table below:

Multiple Linear Regression - Estimated Regression Equation
Sociale_uitkeringen_(in_%_van_BBP)[t] = + 24.7864921233454 + 2.11578501819898e-05`#_werklozen_Vl`[t] + 0.000139357402800176`#_werklozen_Br`[t] -7.45316458655826e-05`#_werklozen_Wa`[t] + e[t]


Multiple Linear Regression - Ordinary Least Squares
VariableParameterS.D.T-STATH0: parameter = 02-tail p-value1-tail p-value
(Intercept)24.78649212334543.4190497.24950.000350.000175
`#_werklozen_Vl`2.11578501819898e-051.1e-051.87020.1106410.055321
`#_werklozen_Br`0.0001393574028001762.2e-056.35150.0007140.000357
`#_werklozen_Wa`-7.45316458655826e-051.9e-05-3.96270.0074290.003714

\begin{tabular}{lllllllll}
\hline
Multiple Linear Regression - Ordinary Least Squares \tabularnewline
Variable & Parameter & S.D. & T-STATH0: parameter = 0 & 2-tail p-value & 1-tail p-value \tabularnewline
(Intercept) & 24.7864921233454 & 3.419049 & 7.2495 & 0.00035 & 0.000175 \tabularnewline
`#_werklozen_Vl` & 2.11578501819898e-05 & 1.1e-05 & 1.8702 & 0.110641 & 0.055321 \tabularnewline
`#_werklozen_Br` & 0.000139357402800176 & 2.2e-05 & 6.3515 & 0.000714 & 0.000357 \tabularnewline
`#_werklozen_Wa` & -7.45316458655826e-05 & 1.9e-05 & -3.9627 & 0.007429 & 0.003714 \tabularnewline
\hline
\end{tabular}
%Source: https://freestatistics.org/blog/index.php?pk=189317&T=2

[TABLE]
[ROW][C]Multiple Linear Regression - Ordinary Least Squares[/C][/ROW]
[ROW][C]Variable[/C][C]Parameter[/C][C]S.D.[/C][C]T-STATH0: parameter = 0[/C][C]2-tail p-value[/C][C]1-tail p-value[/C][/ROW]
[ROW][C](Intercept)[/C][C]24.7864921233454[/C][C]3.419049[/C][C]7.2495[/C][C]0.00035[/C][C]0.000175[/C][/ROW]
[ROW][C]`#_werklozen_Vl`[/C][C]2.11578501819898e-05[/C][C]1.1e-05[/C][C]1.8702[/C][C]0.110641[/C][C]0.055321[/C][/ROW]
[ROW][C]`#_werklozen_Br`[/C][C]0.000139357402800176[/C][C]2.2e-05[/C][C]6.3515[/C][C]0.000714[/C][C]0.000357[/C][/ROW]
[ROW][C]`#_werklozen_Wa`[/C][C]-7.45316458655826e-05[/C][C]1.9e-05[/C][C]-3.9627[/C][C]0.007429[/C][C]0.003714[/C][/ROW]
[/TABLE]
Source: https://freestatistics.org/blog/index.php?pk=189317&T=2

Globally Unique Identifier (entire table): ba.freestatistics.org/blog/index.php?pk=189317&T=2

As an alternative you can also use a QR Code:  

The GUIDs for individual cells are displayed in the table below:

Multiple Linear Regression - Ordinary Least Squares
VariableParameterS.D.T-STATH0: parameter = 02-tail p-value1-tail p-value
(Intercept)24.78649212334543.4190497.24950.000350.000175
`#_werklozen_Vl`2.11578501819898e-051.1e-051.87020.1106410.055321
`#_werklozen_Br`0.0001393574028001762.2e-056.35150.0007140.000357
`#_werklozen_Wa`-7.45316458655826e-051.9e-05-3.96270.0074290.003714


Multiple Linear Regression - Regression Statistics
Multiple R0.935919717283761
R-squared0.875945717200515
Adjusted R-squared0.813918575800772
F-TEST (value)14.1219746297086
F-TEST (DF numerator)3
F-TEST (DF denominator)6
p-value0.00397685325272923
Multiple Linear Regression - Residual Statistics
Residual Standard Deviation0.533460893357722
Sum Squared Residuals1.70748314845211

\begin{tabular}{lllllllll}
\hline
Multiple Linear Regression - Regression Statistics \tabularnewline
Multiple R & 0.935919717283761 \tabularnewline
R-squared & 0.875945717200515 \tabularnewline
Adjusted R-squared & 0.813918575800772 \tabularnewline
F-TEST (value) & 14.1219746297086 \tabularnewline
F-TEST (DF numerator) & 3 \tabularnewline
F-TEST (DF denominator) & 6 \tabularnewline
p-value & 0.00397685325272923 \tabularnewline
Multiple Linear Regression - Residual Statistics \tabularnewline
Residual Standard Deviation & 0.533460893357722 \tabularnewline
Sum Squared Residuals & 1.70748314845211 \tabularnewline
\hline
\end{tabular}
%Source: https://freestatistics.org/blog/index.php?pk=189317&T=3

[TABLE]
[ROW][C]Multiple Linear Regression - Regression Statistics[/C][/ROW]
[ROW][C]Multiple R[/C][C]0.935919717283761[/C][/ROW]
[ROW][C]R-squared[/C][C]0.875945717200515[/C][/ROW]
[ROW][C]Adjusted R-squared[/C][C]0.813918575800772[/C][/ROW]
[ROW][C]F-TEST (value)[/C][C]14.1219746297086[/C][/ROW]
[ROW][C]F-TEST (DF numerator)[/C][C]3[/C][/ROW]
[ROW][C]F-TEST (DF denominator)[/C][C]6[/C][/ROW]
[ROW][C]p-value[/C][C]0.00397685325272923[/C][/ROW]
[ROW][C]Multiple Linear Regression - Residual Statistics[/C][/ROW]
[ROW][C]Residual Standard Deviation[/C][C]0.533460893357722[/C][/ROW]
[ROW][C]Sum Squared Residuals[/C][C]1.70748314845211[/C][/ROW]
[/TABLE]
Source: https://freestatistics.org/blog/index.php?pk=189317&T=3

Globally Unique Identifier (entire table): ba.freestatistics.org/blog/index.php?pk=189317&T=3

As an alternative you can also use a QR Code:  

The GUIDs for individual cells are displayed in the table below:

Multiple Linear Regression - Regression Statistics
Multiple R0.935919717283761
R-squared0.875945717200515
Adjusted R-squared0.813918575800772
F-TEST (value)14.1219746297086
F-TEST (DF numerator)3
F-TEST (DF denominator)6
p-value0.00397685325272923
Multiple Linear Regression - Residual Statistics
Residual Standard Deviation0.533460893357722
Sum Squared Residuals1.70748314845211


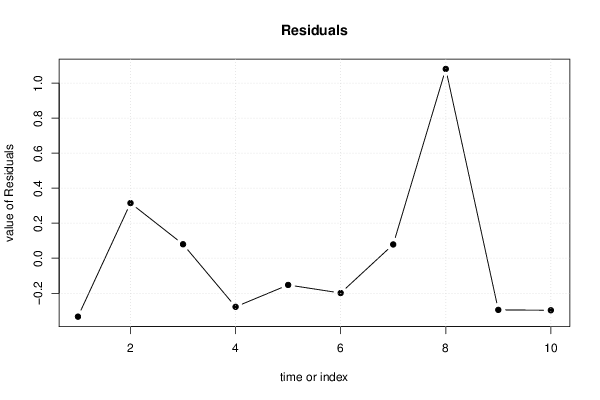
Multiple Linear Regression - Actuals, Interpolation, and Residuals
Time or IndexActualsInterpolationForecastResidualsPrediction Error
122.322.6337032878497-0.333703287849747
222.922.58488645278490.315113547215093
322.822.72017092114480.0798290788552228
422.722.9776031351007-0.277603135100659
522.322.4526908734723-0.152690873472303
622.222.3987244356172-0.198724435617173
723.123.02124754969020.0787524503097615
825.224.11878037682291.08121962317709
924.925.1949667650425-0.294966765042513
1025.225.4972262024748-0.297226202474773

\begin{tabular}{lllllllll}
\hline
Multiple Linear Regression - Actuals, Interpolation, and Residuals \tabularnewline
Time or Index & Actuals & InterpolationForecast & ResidualsPrediction Error \tabularnewline
1 & 22.3 & 22.6337032878497 & -0.333703287849747 \tabularnewline
2 & 22.9 & 22.5848864527849 & 0.315113547215093 \tabularnewline
3 & 22.8 & 22.7201709211448 & 0.0798290788552228 \tabularnewline
4 & 22.7 & 22.9776031351007 & -0.277603135100659 \tabularnewline
5 & 22.3 & 22.4526908734723 & -0.152690873472303 \tabularnewline
6 & 22.2 & 22.3987244356172 & -0.198724435617173 \tabularnewline
7 & 23.1 & 23.0212475496902 & 0.0787524503097615 \tabularnewline
8 & 25.2 & 24.1187803768229 & 1.08121962317709 \tabularnewline
9 & 24.9 & 25.1949667650425 & -0.294966765042513 \tabularnewline
10 & 25.2 & 25.4972262024748 & -0.297226202474773 \tabularnewline
\hline
\end{tabular}
%Source: https://freestatistics.org/blog/index.php?pk=189317&T=4

[TABLE]
[ROW][C]Multiple Linear Regression - Actuals, Interpolation, and Residuals[/C][/ROW]
[ROW][C]Time or Index[/C][C]Actuals[/C][C]InterpolationForecast[/C][C]ResidualsPrediction Error[/C][/ROW]
[ROW][C]1[/C][C]22.3[/C][C]22.6337032878497[/C][C]-0.333703287849747[/C][/ROW]
[ROW][C]2[/C][C]22.9[/C][C]22.5848864527849[/C][C]0.315113547215093[/C][/ROW]
[ROW][C]3[/C][C]22.8[/C][C]22.7201709211448[/C][C]0.0798290788552228[/C][/ROW]
[ROW][C]4[/C][C]22.7[/C][C]22.9776031351007[/C][C]-0.277603135100659[/C][/ROW]
[ROW][C]5[/C][C]22.3[/C][C]22.4526908734723[/C][C]-0.152690873472303[/C][/ROW]
[ROW][C]6[/C][C]22.2[/C][C]22.3987244356172[/C][C]-0.198724435617173[/C][/ROW]
[ROW][C]7[/C][C]23.1[/C][C]23.0212475496902[/C][C]0.0787524503097615[/C][/ROW]
[ROW][C]8[/C][C]25.2[/C][C]24.1187803768229[/C][C]1.08121962317709[/C][/ROW]
[ROW][C]9[/C][C]24.9[/C][C]25.1949667650425[/C][C]-0.294966765042513[/C][/ROW]
[ROW][C]10[/C][C]25.2[/C][C]25.4972262024748[/C][C]-0.297226202474773[/C][/ROW]
[/TABLE]
Source: https://freestatistics.org/blog/index.php?pk=189317&T=4

Globally Unique Identifier (entire table): ba.freestatistics.org/blog/index.php?pk=189317&T=4

As an alternative you can also use a QR Code:  

The GUIDs for individual cells are displayed in the table below:

Multiple Linear Regression - Actuals, Interpolation, and Residuals
Time or IndexActualsInterpolationForecastResidualsPrediction Error
122.322.6337032878497-0.333703287849747
222.922.58488645278490.315113547215093
322.822.72017092114480.0798290788552228
422.722.9776031351007-0.277603135100659
522.322.4526908734723-0.152690873472303
622.222.3987244356172-0.198724435617173
723.123.02124754969020.0787524503097615
825.224.11878037682291.08121962317709
924.925.1949667650425-0.294966765042513
1025.225.4972262024748-0.297226202474773


Parameters (Session):
par1 = 1 ; par2 = Do not include Seasonal Dummies ; par3 = No Linear Trend ;
Parameters (R input):
par1 = 1 ; par2 = Do not include Seasonal Dummies ; par3 = No Linear Trend ;
R code (references can be found in the software module):
library(lattice)
library(lmtest)
n25 <- 25 #minimum number of obs. for Goldfeld-Quandt test
par1 <- as.numeric(par1)
x <- t(y)
k <- length(x[1,])
n <- length(x[,1])
x1 <- cbind(x[,par1], x[,1:k!=par1])
mycolnames <- c(colnames(x)[par1], colnames(x)[1:k!=par1])
colnames(x1) <- mycolnames #colnames(x)[par1]
x <- x1
if (par3 == 'First Differences'){
x2 <- array(0, dim=c(n-1,k), dimnames=list(1:(n-1), paste('(1-B)',colnames(x),sep='')))
for (i in 1:n-1) {
for (j in 1:k) {
x2[i,j] <- x[i+1,j] - x[i,j]
}
}
x <- x2
}
if (par2 == 'Include Monthly Dummies'){
x2 <- array(0, dim=c(n,11), dimnames=list(1:n, paste('M', seq(1:11), sep ='')))
for (i in 1:11){
x2[seq(i,n,12),i] <- 1
}
x <- cbind(x, x2)
}
if (par2 == 'Include Quarterly Dummies'){
x2 <- array(0, dim=c(n,3), dimnames=list(1:n, paste('Q', seq(1:3), sep ='')))
for (i in 1:3){
x2[seq(i,n,4),i] <- 1
}
x <- cbind(x, x2)
}
k <- length(x[1,])
if (par3 == 'Linear Trend'){
x <- cbind(x, c(1:n))
colnames(x)[k+1] <- 't'
}
x
k <- length(x[1,])
df <- as.data.frame(x)
(mylm <- lm(df))
(mysum <- summary(mylm))
if (n > n25) {
kp3 <- k + 3
nmkm3 <- n - k - 3
gqarr <- array(NA, dim=c(nmkm3-kp3+1,3))
numgqtests <- 0
numsignificant1 <- 0
numsignificant5 <- 0
numsignificant10 <- 0
for (mypoint in kp3:nmkm3) {
j <- 0
numgqtests <- numgqtests + 1
for (myalt in c('greater', 'two.sided', 'less')) {
j <- j + 1
gqarr[mypoint-kp3+1,j] <- gqtest(mylm, point=mypoint, alternative=myalt)$p.value
}
if (gqarr[mypoint-kp3+1,2] < 0.01) numsignificant1 <- numsignificant1 + 1
if (gqarr[mypoint-kp3+1,2] < 0.05) numsignificant5 <- numsignificant5 + 1
if (gqarr[mypoint-kp3+1,2] < 0.10) numsignificant10 <- numsignificant10 + 1
}
gqarr
}
bitmap(file='test0.png')
plot(x[,1], type='l', main='Actuals and Interpolation', ylab='value of Actuals and Interpolation (dots)', xlab='time or index')
points(x[,1]-mysum$resid)
grid()
dev.off()
bitmap(file='test1.png')
plot(mysum$resid, type='b', pch=19, main='Residuals', ylab='value of Residuals', xlab='time or index')
grid()
dev.off()
bitmap(file='test2.png')
hist(mysum$resid, main='Residual Histogram', xlab='values of Residuals')
grid()
dev.off()
bitmap(file='test3.png')
densityplot(~mysum$resid,col='black',main='Residual Density Plot', xlab='values of Residuals')
dev.off()
bitmap(file='test4.png')
qqnorm(mysum$resid, main='Residual Normal Q-Q Plot')
qqline(mysum$resid)
grid()
dev.off()
(myerror <- as.ts(mysum$resid))
bitmap(file='test5.png')
dum <- cbind(lag(myerror,k=1),myerror)
dum
dum1 <- dum[2:length(myerror),]
dum1
z <- as.data.frame(dum1)
z
plot(z,main=paste('Residual Lag plot, lowess, and regression line'), ylab='values of Residuals', xlab='lagged values of Residuals')
lines(lowess(z))
abline(lm(z))
grid()
dev.off()
bitmap(file='test6.png')
acf(mysum$resid, lag.max=length(mysum$resid)/2, main='Residual Autocorrelation Function')
grid()
dev.off()
bitmap(file='test7.png')
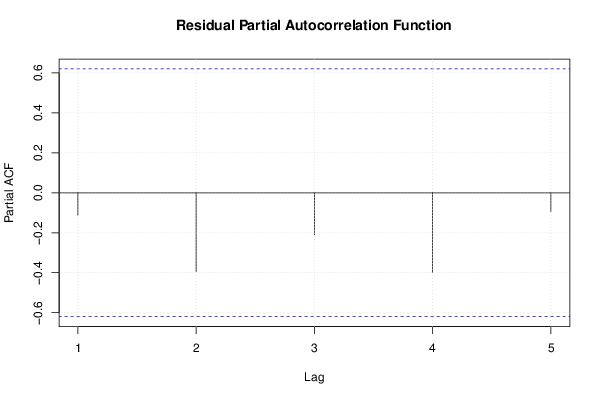
pacf(mysum$resid, lag.max=length(mysum$resid)/2, main='Residual Partial Autocorrelation Function')
grid()
dev.off()
bitmap(file='test8.png')
opar <- par(mfrow = c(2,2), oma = c(0, 0, 1.1, 0))
plot(mylm, las = 1, sub='Residual Diagnostics')
par(opar)
dev.off()
if (n > n25) {
bitmap(file='test9.png')
plot(kp3:nmkm3,gqarr[,2], main='Goldfeld-Quandt test',ylab='2-sided p-value',xlab='breakpoint')
grid()
dev.off()
}
load(file='createtable')
a<-table.start()
a<-table.row.start(a)
a<-table.element(a, 'Multiple Linear Regression - Estimated Regression Equation', 1, TRUE)
a<-table.row.end(a)
myeq <- colnames(x)[1]
myeq <- paste(myeq, '[t] = ', sep='')
for (i in 1:k){
if (mysum$coefficients[i,1] > 0) myeq <- paste(myeq, '+', '')
myeq <- paste(myeq, mysum$coefficients[i,1], sep=' ')
if (rownames(mysum$coefficients)[i] != '(Intercept)') {
myeq <- paste(myeq, rownames(mysum$coefficients)[i], sep='')
if (rownames(mysum$coefficients)[i] != 't') myeq <- paste(myeq, '[t]', sep='')
}
}
myeq <- paste(myeq, ' + e[t]')
a<-table.row.start(a)
a<-table.element(a, myeq)
a<-table.row.end(a)
a<-table.end(a)
table.save(a,file='mytable1.tab')
a<-table.start()
a<-table.row.start(a)
a<-table.element(a,hyperlink('ols1.htm','Multiple Linear Regression - Ordinary Least Squares',''), 6, TRUE)
a<-table.row.end(a)
a<-table.row.start(a)
a<-table.element(a,'Variable',header=TRUE)
a<-table.element(a,'Parameter',header=TRUE)
a<-table.element(a,'S.D.',header=TRUE)
a<-table.element(a,'T-STAT
H0: parameter = 0',header=TRUE)
a<-table.element(a,'2-tail p-value',header=TRUE)
a<-table.element(a,'1-tail p-value',header=TRUE)
a<-table.row.end(a)
for (i in 1:k){
a<-table.row.start(a)
a<-table.element(a,rownames(mysum$coefficients)[i],header=TRUE)
a<-table.element(a,mysum$coefficients[i,1])
a<-table.element(a, round(mysum$coefficients[i,2],6))
a<-table.element(a, round(mysum$coefficients[i,3],4))
a<-table.element(a, round(mysum$coefficients[i,4],6))
a<-table.element(a, round(mysum$coefficients[i,4]/2,6))
a<-table.row.end(a)
}
a<-table.end(a)
table.save(a,file='mytable2.tab')
a<-table.start()
a<-table.row.start(a)
a<-table.element(a, 'Multiple Linear Regression - Regression Statistics', 2, TRUE)
a<-table.row.end(a)
a<-table.row.start(a)
a<-table.element(a, 'Multiple R',1,TRUE)
a<-table.element(a, sqrt(mysum$r.squared))
a<-table.row.end(a)
a<-table.row.start(a)
a<-table.element(a, 'R-squared',1,TRUE)
a<-table.element(a, mysum$r.squared)
a<-table.row.end(a)
a<-table.row.start(a)
a<-table.element(a, 'Adjusted R-squared',1,TRUE)
a<-table.element(a, mysum$adj.r.squared)
a<-table.row.end(a)
a<-table.row.start(a)
a<-table.element(a, 'F-TEST (value)',1,TRUE)
a<-table.element(a, mysum$fstatistic[1])
a<-table.row.end(a)
a<-table.row.start(a)
a<-table.element(a, 'F-TEST (DF numerator)',1,TRUE)
a<-table.element(a, mysum$fstatistic[2])
a<-table.row.end(a)
a<-table.row.start(a)
a<-table.element(a, 'F-TEST (DF denominator)',1,TRUE)
a<-table.element(a, mysum$fstatistic[3])
a<-table.row.end(a)
a<-table.row.start(a)
a<-table.element(a, 'p-value',1,TRUE)
a<-table.element(a, 1-pf(mysum$fstatistic[1],mysum$fstatistic[2],mysum$fstatistic[3]))
a<-table.row.end(a)
a<-table.row.start(a)
a<-table.element(a, 'Multiple Linear Regression - Residual Statistics', 2, TRUE)
a<-table.row.end(a)
a<-table.row.start(a)
a<-table.element(a, 'Residual Standard Deviation',1,TRUE)
a<-table.element(a, mysum$sigma)
a<-table.row.end(a)
a<-table.row.start(a)
a<-table.element(a, 'Sum Squared Residuals',1,TRUE)
a<-table.element(a, sum(myerror*myerror))
a<-table.row.end(a)
a<-table.end(a)
table.save(a,file='mytable3.tab')
a<-table.start()
a<-table.row.start(a)
a<-table.element(a, 'Multiple Linear Regression - Actuals, Interpolation, and Residuals', 4, TRUE)
a<-table.row.end(a)
a<-table.row.start(a)
a<-table.element(a, 'Time or Index', 1, TRUE)
a<-table.element(a, 'Actuals', 1, TRUE)
a<-table.element(a, 'Interpolation
Forecast', 1, TRUE)
a<-table.element(a, 'Residuals
Prediction Error', 1, TRUE)
a<-table.row.end(a)
for (i in 1:n) {
a<-table.row.start(a)
a<-table.element(a,i, 1, TRUE)
a<-table.element(a,x[i])
a<-table.element(a,x[i]-mysum$resid[i])
a<-table.element(a,mysum$resid[i])
a<-table.row.end(a)
}
a<-table.end(a)
table.save(a,file='mytable4.tab')
if (n > n25) {
a<-table.start()
a<-table.row.start(a)
a<-table.element(a,'Goldfeld-Quandt test for Heteroskedasticity',4,TRUE)
a<-table.row.end(a)
a<-table.row.start(a)
a<-table.element(a,'p-values',header=TRUE)
a<-table.element(a,'Alternative Hypothesis',3,header=TRUE)
a<-table.row.end(a)
a<-table.row.start(a)
a<-table.element(a,'breakpoint index',header=TRUE)
a<-table.element(a,'greater',header=TRUE)
a<-table.element(a,'2-sided',header=TRUE)
a<-table.element(a,'less',header=TRUE)
a<-table.row.end(a)
for (mypoint in kp3:nmkm3) {
a<-table.row.start(a)
a<-table.element(a,mypoint,header=TRUE)
a<-table.element(a,gqarr[mypoint-kp3+1,1])
a<-table.element(a,gqarr[mypoint-kp3+1,2])
a<-table.element(a,gqarr[mypoint-kp3+1,3])
a<-table.row.end(a)
}
a<-table.end(a)
table.save(a,file='mytable5.tab')
a<-table.start()
a<-table.row.start(a)
a<-table.element(a,'Meta Analysis of Goldfeld-Quandt test for Heteroskedasticity',4,TRUE)
a<-table.row.end(a)
a<-table.row.start(a)
a<-table.element(a,'Description',header=TRUE)
a<-table.element(a,'# significant tests',header=TRUE)
a<-table.element(a,'% significant tests',header=TRUE)
a<-table.element(a,'OK/NOK',header=TRUE)
a<-table.row.end(a)
a<-table.row.start(a)
a<-table.element(a,'1% type I error level',header=TRUE)
a<-table.element(a,numsignificant1)
a<-table.element(a,numsignificant1/numgqtests)
if (numsignificant1/numgqtests < 0.01) dum <- 'OK' else dum <- 'NOK'
a<-table.element(a,dum)
a<-table.row.end(a)
a<-table.row.start(a)
a<-table.element(a,'5% type I error level',header=TRUE)
a<-table.element(a,numsignificant5)
a<-table.element(a,numsignificant5/numgqtests)
if (numsignificant5/numgqtests < 0.05) dum <- 'OK' else dum <- 'NOK'
a<-table.element(a,dum)
a<-table.row.end(a)
a<-table.row.start(a)
a<-table.element(a,'10% type I error level',header=TRUE)
a<-table.element(a,numsignificant10)
a<-table.element(a,numsignificant10/numgqtests)
if (numsignificant10/numgqtests < 0.1) dum <- 'OK' else dum <- 'NOK'
a<-table.element(a,dum)
a<-table.row.end(a)
a<-table.end(a)
table.save(a,file='mytable6.tab')
}