| Tabulation of Results | |||
| Happiness x Depression | |||
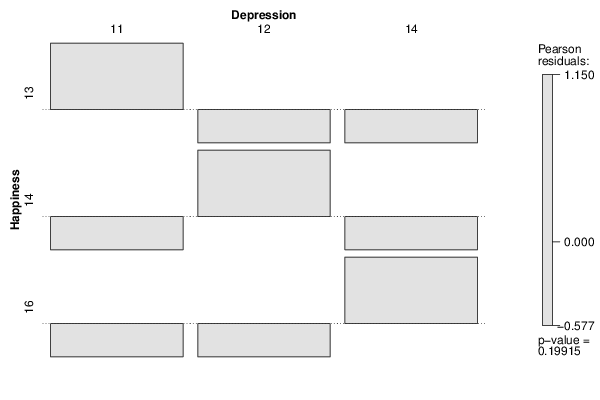
| 11 | 12 | 14 | 13 | 1 | 0 | 0 | 14 | 0 | 1 | 0 | 16 | 0 | 0 | 1 |
| Tabulation of Expected Results | |||
| Happiness x Depression | |||
| 11 | 12 | 14 | 13 | 0.33 | 0.33 | 0.33 | 14 | 0.33 | 0.33 | 0.33 | 16 | 0.33 | 0.33 | 0.33 |
| Statistical Results | |
| Pearson's Chi-squared test | |
| Pearson Chi Square Statistic | 6 |
| Degrees of Freedom | 4 |
| P value | 0.2 |