| Multiple Linear Regression - Estimated Regression Equation |
| Cons[t] = + 141.648090178319 + 0.660084237790883Inc[t] -1.13957260765924Price[t] + 1.90575805616525M1[t] + 9.46692807187031M2[t] + 4.2938865424838M3[t] + 0.0205018786537541M4[t] + 10.9336372586813M5[t] + 2.29076793304609M6[t] + 5.35801031121686M7[t] + 9.77895415519412M8[t] + 14.8863712917001M9[t] + 10.9704535272708M10[t] + 12.9742456323207M11[t] + 0.600263459594387t + e[t] |
| Multiple Linear Regression - Ordinary Least Squares | |||||
| Variable | Parameter | S.D. | T-STAT H0: parameter = 0 | 2-tail p-value | 1-tail p-value |
| (Intercept) | 141.648090178319 | 371.220354 | 0.3816 | 0.739502 | 0.369751 |
| Inc | 0.660084237790883 | 3.401459 | 0.1941 | 0.864053 | 0.432027 |
| Price | -1.13957260765924 | 0.810546 | -1.4059 | 0.294973 | 0.147486 |
| M1 | 1.90575805616525 | 12.346393 | 0.1544 | 0.891497 | 0.445749 |
| M2 | 9.46692807187031 | 13.671871 | 0.6924 | 0.560254 | 0.280127 |
| M3 | 4.2938865424838 | 25.529205 | 0.1682 | 0.8819 | 0.44095 |
| M4 | 0.0205018786537541 | 31.11733 | 7e-04 | 0.999534 | 0.499767 |
| M5 | 10.9336372586813 | 35.637695 | 0.3068 | 0.787991 | 0.393996 |
| M6 | 2.29076793304609 | 52.410089 | 0.0437 | 0.969108 | 0.484554 |
| M7 | 5.35801031121686 | 58.652923 | 0.0914 | 0.935539 | 0.46777 |
| M8 | 9.77895415519412 | 61.533945 | 0.1589 | 0.88833 | 0.444165 |
| M9 | 14.8863712917001 | 47.856552 | 0.3111 | 0.785181 | 0.39259 |
| M10 | 10.9704535272708 | 34.477717 | 0.3182 | 0.780493 | 0.390247 |
| M11 | 12.9742456323207 | 23.339099 | 0.5559 | 0.634166 | 0.317083 |
| t | 0.600263459594387 | 2.571551 | 0.2334 | 0.837147 | 0.418574 |
| Multiple Linear Regression - Regression Statistics | |
| Multiple R | 0.991570863798807 |
| R-squared | 0.983212777934713 |
| Adjusted R-squared | 0.865702223477705 |
| F-TEST (value) | 8.36701675417961 |
| F-TEST (DF numerator) | 14 |
| F-TEST (DF denominator) | 2 |
| p-value | 0.111755354104154 |
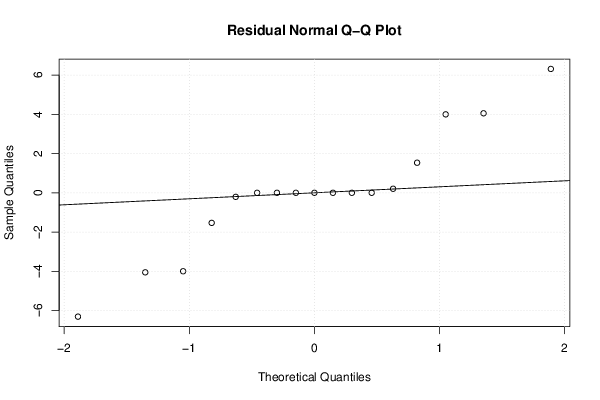
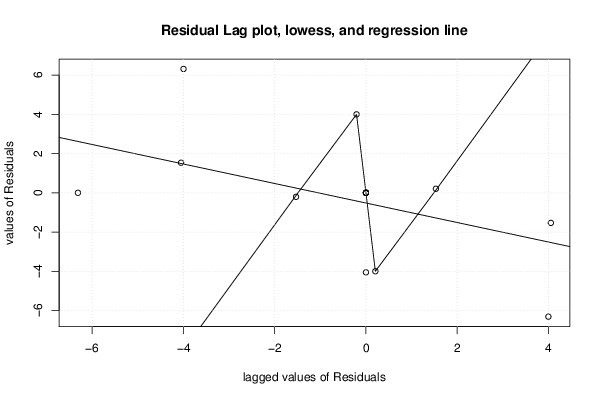
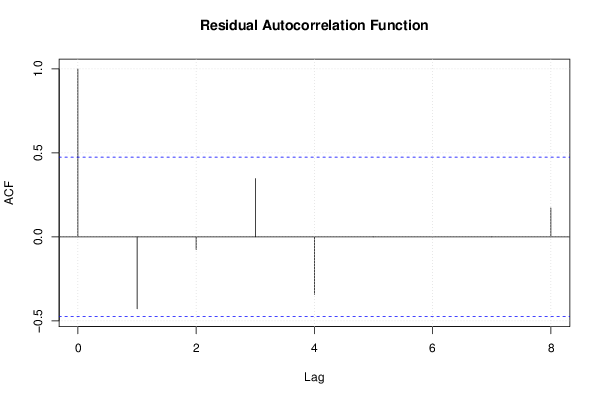
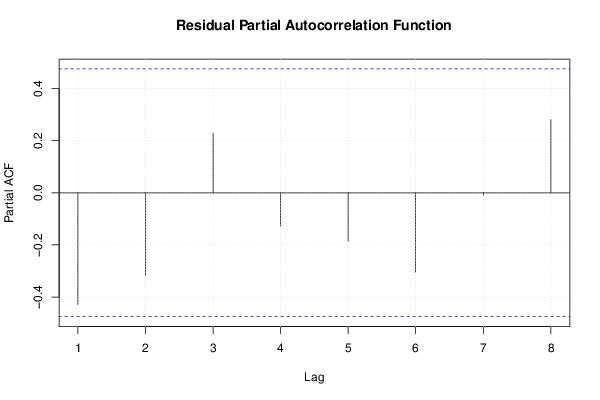
| Multiple Linear Regression - Residual Statistics | |
| Residual Standard Deviation | 8.64030497087169 |
| Sum Squared Residuals | 149.30973997934 |
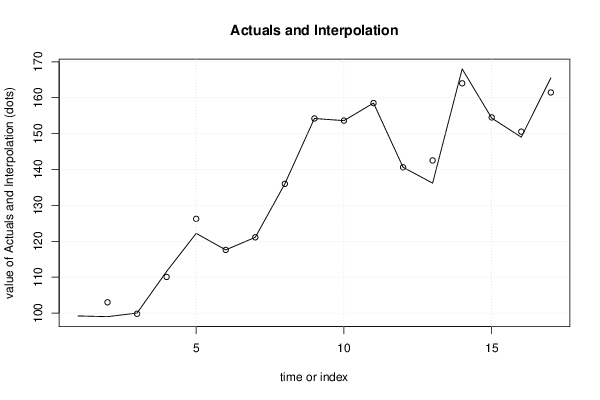
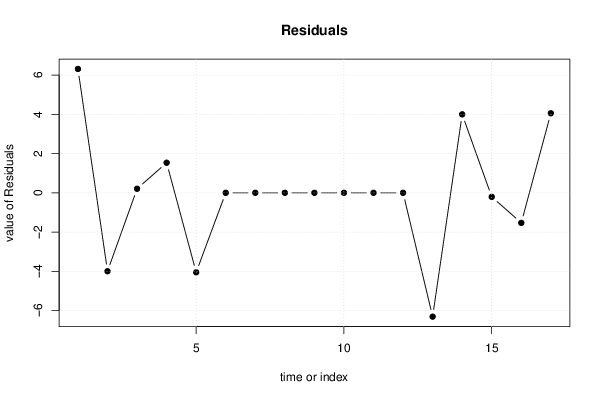
| Multiple Linear Regression - Actuals, Interpolation, and Residuals | |||
| Time or Index | Actuals | Interpolation Forecast | Residuals Prediction Error |
| 1 | 99.2 | 92.8874241148746 | 6.31257588512536 |
| 2 | 99 | 102.998590869975 | -3.99859086997455 |
| 3 | 100 | 99.793930112751 | 0.206069887248988 |
| 4 | 111.6 | 110.067204185688 | 1.53279581431248 |
| 5 | 122.2 | 126.252850716712 | -4.05285071671228 |
| 6 | 117.6 | 117.6 | -5.12610787151146e-16 |
| 7 | 121.1 | 121.1 | -2.90566182226115e-16 |
| 8 | 136 | 136 | 1.53523027623947e-16 |
| 9 | 154.2 | 154.2 | 3.75567632548979e-16 |
| 10 | 153.6 | 153.6 | 1.04170144732407e-15 |
| 11 | 158.5 | 158.5 | -6.85215773010839e-17 |
| 12 | 140.6 | 140.6 | -6.85215773010839e-17 |
| 13 | 136.2 | 142.512575885125 | -6.31257588512536 |
| 14 | 168 | 164.001409130025 | 3.99859086997455 |
| 15 | 154.3 | 154.506069887249 | -0.206069887248988 |
| 16 | 149 | 150.532795814312 | -1.53279581431248 |
| 17 | 165.5 | 161.447149283288 | 4.05285071671228 |