| Tabulation of Results | ||
| Depression x Separate | ||
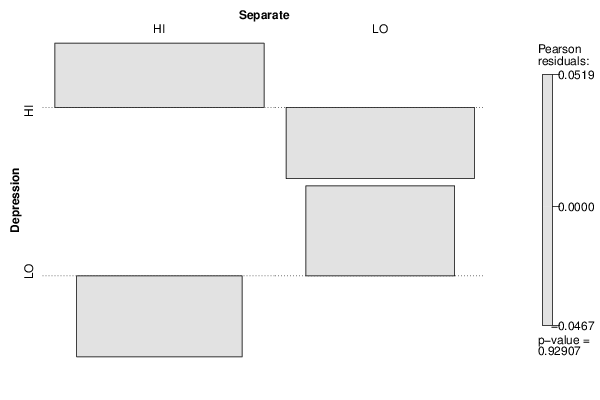
| HI | LO | HI | 55 | 44 | LO | 34 | 28 |
| Tabulation of Expected Results | ||
| Depression x Separate | ||
| HI | LO | HI | 54.73 | 44.27 | LO | 34.27 | 27.73 |
| Statistical Results | |
| Pearson's Chi-squared test with simulated p-value (based on 2000 replicates) | |
| Exact Pearson Chi Square Statistic | 0.01 |
| P value | 1 |