| Tabulation of Results | ||
| Happiness x Separate | ||
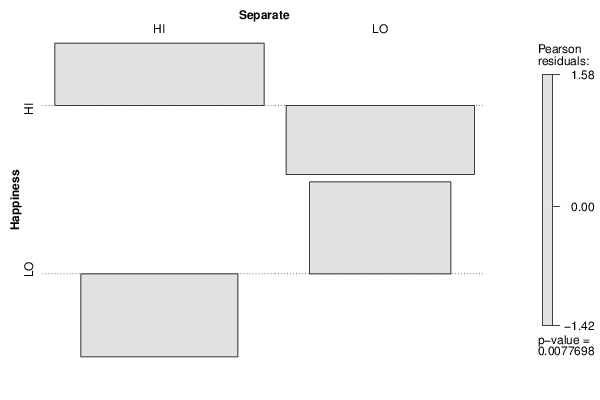
| HI | LO | HI | 65 | 38 | LO | 24 | 34 |
| Tabulation of Expected Results | ||
| Happiness x Separate | ||
| HI | LO | HI | 56.94 | 46.06 | LO | 32.06 | 25.94 |
| Statistical Results | |
| Pearson's Chi-squared test with simulated p-value (based on 2000 replicates) | |
| Exact Pearson Chi Square Statistic | 7.09 |
| P value | 0.01 |