| Tabulation of Results | ||
| Happiness x Connected | ||
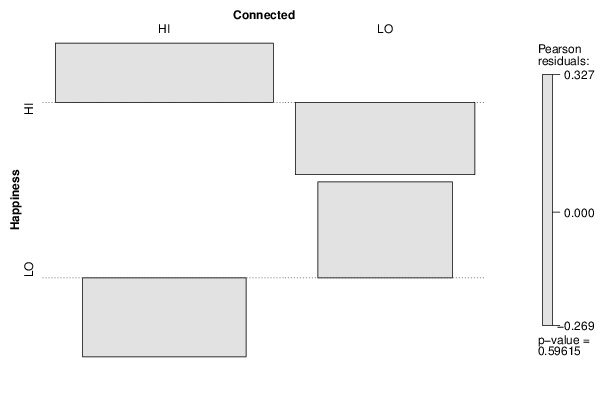
| HI | LO | HI | 63 | 40 | LO | 33 | 25 |
| Tabulation of Expected Results | ||
| Happiness x Connected | ||
| HI | LO | HI | 61.42 | 41.58 | LO | 34.58 | 23.42 |
| Statistical Results | |
| Pearson's Chi-squared test with simulated p-value (based on 2000 replicates) | |
| Exact Pearson Chi Square Statistic | 0.28 |
| P value | 0.62 |