| Tabulation of Results | ||
| Connected x Separate | ||
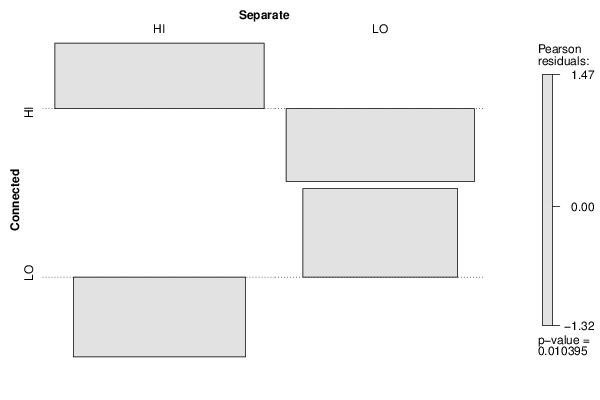
| HI | LO | HI | 61 | 35 | LO | 28 | 37 |
| Tabulation of Expected Results | ||
| Connected x Separate | ||
| HI | LO | HI | 53.07 | 42.93 | LO | 35.93 | 29.07 |
| Statistical Results | |
| Pearson's Chi-squared test with simulated p-value (based on 2000 replicates) | |
| Exact Pearson Chi Square Statistic | 6.57 |
| P value | 0.02 |