| Multiple Linear Regression - Estimated Regression Equation |
| LAND[t] = -2.09207385848736e-08 + 1.35060365726823e-12maand[t] + 1.02370630654816e-11jaar[t] + 1.00000000000001Antwerpen[t] + 0.999999999999998Vlaams_Brabant[t] + 0.999999999999982Waals_Brabant[t] + 0.999999999999999West_vlaanderen[t] + 1Oost_Vlaanderen[t] + 1.00000000000001Henehouwen[t] + 0.999999999999997Luik[t] + 0.99999999999999Limburg[t] + 0.999999999999987Luxemburg[t] + 1.00000000000001Namen[t] + 1.00000000000102Buitenland[t] + 0.999999999999998Brussel[t] + e[t] |
| Multiple Linear Regression - Ordinary Least Squares | |||||
| Variable | Parameter | S.D. | T-STAT H0: parameter = 0 | 2-tail p-value | 1-tail p-value |
| (Intercept) | -2.09207385848736e-08 | 0 | -0.8904 | 0.37801 | 0.189005 |
| maand | 1.35060365726823e-12 | 0 | 0.8495 | 0.400127 | 0.200064 |
| jaar | 1.02370630654816e-11 | 0 | 0.8817 | 0.38261 | 0.191305 |
| Antwerpen | 1.00000000000001 | 0 | 199042542586793 | 0 | 0 |
| Vlaams_Brabant | 0.999999999999998 | 0 | 100739119686198 | 0 | 0 |
| Waals_Brabant | 0.999999999999982 | 0 | 48330713801979.2 | 0 | 0 |
| West_vlaanderen | 0.999999999999999 | 0 | 148613675426965 | 0 | 0 |
| Oost_Vlaanderen | 1 | 0 | 144808726442383 | 0 | 0 |
| Henehouwen | 1.00000000000001 | 0 | 122768754229783 | 0 | 0 |
| Luik | 0.999999999999997 | 0 | 193935867175072 | 0 | 0 |
| Limburg | 0.99999999999999 | 0 | 111161316396882 | 0 | 0 |
| Luxemburg | 0.999999999999987 | 0 | 50935295628651.2 | 0 | 0 |
| Namen | 1.00000000000001 | 0 | 84635575122375.2 | 0 | 0 |
| Buitenland | 1.00000000000102 | 0 | 3882870771598.02 | 0 | 0 |
| Brussel | 0.999999999999998 | 0 | 479890446435121 | 0 | 0 |
| Multiple Linear Regression - Regression Statistics | |
| Multiple R | 1 |
| R-squared | 1 |
| Adjusted R-squared | 1 |
| F-TEST (value) | 1.90204320071234e+31 |
| F-TEST (DF numerator) | 14 |
| F-TEST (DF denominator) | 45 |
| p-value | 0 |
| Multiple Linear Regression - Residual Statistics | |
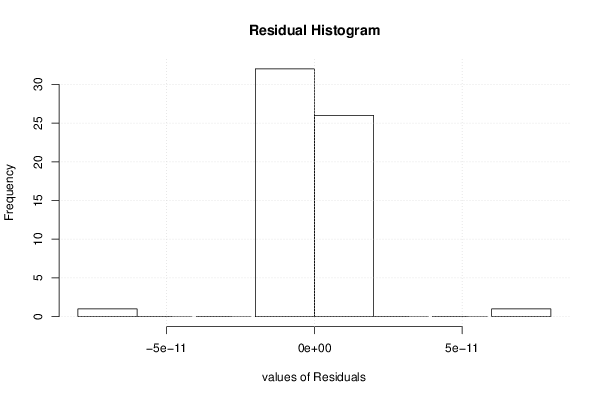
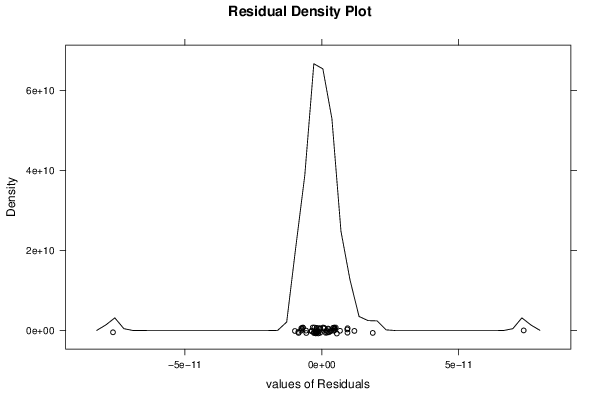
| Residual Standard Deviation | 1.70113827139306e-11 |
| Sum Squared Residuals | 1.30224213827917e-20 |
| Multiple Linear Regression - Actuals, Interpolation, and Residuals | |||
| Time or Index | Actuals | Interpolation Forecast | Residuals Prediction Error |
| 1 | 593408 | 593408 | 7.37975077133622e-11 |
| 2 | 590072 | 590072 | -7.62850641531385e-11 |
| 3 | 579799 | 579799 | -6.90318485236653e-12 |
| 4 | 574205 | 574205 | 1.86278916484214e-11 |
| 5 | 572775 | 572775 | -5.72774822648984e-12 |
| 6 | 572942 | 572942 | -7.25584802997321e-12 |
| 7 | 619567 | 619567 | -1.26915734374448e-12 |
| 8 | 625809 | 625809 | -8.44279239055413e-12 |
| 9 | 619916 | 619916 | 5.50872034576466e-12 |
| 10 | 587625 | 587625 | 1.19211638667888e-11 |
| 11 | 565742 | 565742 | 4.72085643997451e-12 |
| 12 | 557274 | 557274 | -1.38280651752708e-12 |
| 13 | 560576 | 560576 | -1.67830060809423e-12 |
| 14 | 548854 | 548854 | -2.32360008636023e-12 |
| 15 | 531673 | 531673 | -2.67757279104338e-12 |
| 16 | 525919 | 525919 | -7.46063963872379e-12 |
| 17 | 511038 | 511038 | 3.53561981909556e-12 |
| 18 | 498662 | 498662 | 9.43816601210396e-12 |
| 19 | 555362 | 555362 | 2.33596915187685e-12 |
| 20 | 564591 | 564591 | -2.79324021454671e-12 |
| 21 | 541657 | 541657 | -2.05102776002348e-12 |
| 22 | 527070 | 527070 | -5.99137053779999e-13 |
| 23 | 509846 | 509846 | -7.19793732567421e-12 |
| 24 | 514258 | 514258 | 2.26547552636e-12 |
| 25 | 516922 | 516922 | 9.82840286931747e-13 |
| 26 | 507561 | 507561 | -9.80018124327868e-12 |
| 27 | 492622 | 492622 | 4.54769081978181e-12 |
| 28 | 490243 | 490243 | -3.70523395088314e-12 |
| 29 | 469357 | 469357 | -8.54297291295696e-12 |
| 30 | 477580 | 477580 | 9.33676263352122e-12 |
| 31 | 528379 | 528379 | 4.61425832624992e-12 |
| 32 | 533590 | 533590 | -5.66253013739248e-12 |
| 33 | 517945 | 517945 | -2.89228139140726e-12 |
| 34 | 506174 | 506174 | 9.40079022788247e-12 |
| 35 | 501866 | 501866 | 1.89485138892519e-12 |
| 36 | 516141 | 516141 | -3.29967448754348e-12 |
| 37 | 528222 | 528222 | 5.08972750538585e-12 |
| 38 | 532638 | 532638 | 4.42319308695324e-12 |
| 39 | 536322 | 536322 | -9.89169848893337e-13 |
| 40 | 536535 | 536535 | 6.67190325070782e-12 |
| 41 | 523597 | 523597 | -7.52561472554644e-12 |
| 42 | 536214 | 536214 | -1.85561302342513e-12 |
| 43 | 586570 | 586570 | -2.19191366569891e-12 |
| 44 | 596594 | 596594 | 4.18862168101818e-12 |
| 45 | 580523 | 580523 | -1.90220860971938e-12 |
| 46 | 564478 | 564478 | 1.38233683733179e-12 |
| 47 | 557560 | 557560 | -7.86797148852274e-13 |
| 48 | 575093 | 575093 | -1.87258355427524e-12 |
| 49 | 580112 | 580112 | -6.88452647393812e-12 |
| 50 | 574761 | 574761 | 2.48414434455111e-12 |
| 51 | 563250 | 563250 | 2.6254332851869e-12 |
| 52 | 551531 | 551531 | -2.19140537139534e-12 |
| 53 | 537034 | 537034 | -4.91702659137337e-13 |
| 54 | 544686 | 544686 | 4.7875431504107e-12 |
| 55 | 600991 | 600991 | 3.10063441150865e-12 |
| 56 | 604378 | 604378 | -3.71059972517458e-12 |
| 57 | 586111 | 586111 | 1.78535433973461e-12 |
| 58 | 563668 | 563668 | 5.10280842500386e-13 |
| 59 | 548604 | 548604 | -2.2469875102038e-12 |
| 60 | 551174 | 551174 | 6.22316489432227e-13 |
| Goldfeld-Quandt test for Heteroskedasticity | |||
| p-values | Alternative Hypothesis | ||
| breakpoint index | greater | 2-sided | less |
| 18 | 0.562640923872481 | 0.874718152255038 | 0.437359076127519 |
| 19 | 0.0417805572672907 | 0.0835611145345814 | 0.958219442732709 |
| 20 | 0.778070859167487 | 0.443858281665026 | 0.221929140832513 |
| 21 | 0.546164676750414 | 0.907670646499172 | 0.453835323249586 |
| 22 | 0.342847893164087 | 0.685695786328175 | 0.657152106835913 |
| 23 | 0.999995470398888 | 9.05920222482952e-06 | 4.52960111241476e-06 |
| 24 | 0.999464252820513 | 0.00107149435897305 | 0.000535747179486526 |
| 25 | 5.96604744662335e-10 | 1.19320948932467e-09 | 0.999999999403395 |
| 26 | 0.0219844453184007 | 0.0439688906368014 | 0.978015554681599 |
| 27 | 0.624556795285983 | 0.750886409428034 | 0.375443204714017 |
| 28 | 0.997549464896149 | 0.00490107020770173 | 0.00245053510385086 |
| 29 | 0.331746684049951 | 0.663493368099902 | 0.668253315950049 |
| 30 | 3.38952033879348e-10 | 6.77904067758696e-10 | 0.999999999661048 |
| 31 | 0.478970192529039 | 0.957940385058078 | 0.521029807470961 |
| 32 | 0.999744140017329 | 0.00051171996534166 | 0.00025585998267083 |
| 33 | 1.34413399133235e-06 | 2.68826798266471e-06 | 0.999998655866009 |
| 34 | 0.953454632353695 | 0.0930907352926108 | 0.0465453676463054 |
| 35 | 1.04578474390057e-09 | 2.09156948780115e-09 | 0.999999998954215 |
| 36 | 0.99998534112131 | 2.9317757379926e-05 | 1.4658878689963e-05 |
| 37 | 0.377496207218629 | 0.754992414437258 | 0.622503792781371 |
| 38 | 0.953837062961983 | 0.0923258740760335 | 0.0461629370380168 |
| 39 | 0.000731231798553805 | 0.00146246359710761 | 0.999268768201446 |
| 40 | 0.463918742030768 | 0.927837484061536 | 0.536081257969232 |
| 41 | 2.62217493266171e-08 | 5.24434986532342e-08 | 0.999999973778251 |
| 42 | 0.0109986322180505 | 0.0219972644361011 | 0.989001367781949 |
| Meta Analysis of Goldfeld-Quandt test for Heteroskedasticity | |||
| Description | # significant tests | % significant tests | OK/NOK |
| 1% type I error level | 11 | 0.44 | NOK |
| 5% type I error level | 13 | 0.52 | NOK |
| 10% type I error level | 16 | 0.64 | NOK |