| Multiple Linear Regression - Estimated Regression Equation |
| Totale_bevolking[t] = -15.6001765674043 + 0.976473875861706Vlaams_Gewest_mannen[t] + 1.02996739943033Vlaams_Gewest_vrouwen[t] + 1.0199254341158Waals_Gewest_manen[t] + 0.97401985047526Waals_Gewest_vrouwen[t] + 0.930099163421382Brussel_mannen[t] + 1.07690987605063Brussel_vrouwen[t] + e[t] |
| Multiple Linear Regression - Ordinary Least Squares | |||||
| Variable | Parameter | S.D. | T-STAT H0: parameter = 0 | 2-tail p-value | 1-tail p-value |
| (Intercept) | -15.6001765674043 | 22.712338 | -0.6869 | 0.495859 | 0.24793 |
| Vlaams_Gewest_mannen | 0.976473875861706 | 0.030018 | 32.53 | 0 | 0 |
| Vlaams_Gewest_vrouwen | 1.02996739943033 | 0.027952 | 36.8474 | 0 | 0 |
| Waals_Gewest_manen | 1.0199254341158 | 0.035439 | 28.7796 | 0 | 0 |
| Waals_Gewest_vrouwen | 0.97401985047526 | 0.050139 | 19.4263 | 0 | 0 |
| Brussel_mannen | 0.930099163421382 | 0.056953 | 16.3309 | 0 | 0 |
| Brussel_vrouwen | 1.07690987605063 | 0.051233 | 21.0199 | 0 | 0 |
| Multiple Linear Regression - Regression Statistics | |
| Multiple R | 0.999998914665498 |
| R-squared | 0.999997829332175 |
| Adjusted R-squared | 0.999997526448292 |
| F-TEST (value) | 3301588.12276667 |
| F-TEST (DF numerator) | 6 |
| F-TEST (DF denominator) | 43 |
| p-value | 0 |
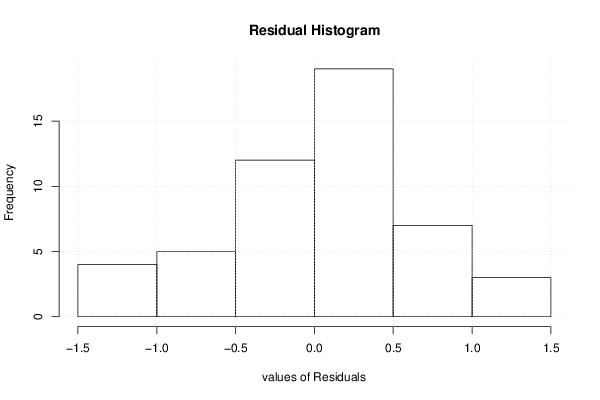
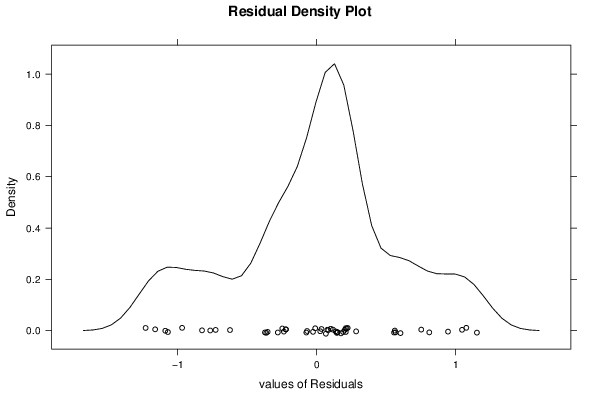
| Multiple Linear Regression - Residual Statistics | |
| Residual Standard Deviation | 0.620267454098993 |
| Sum Squared Residuals | 16.5434637284212 |
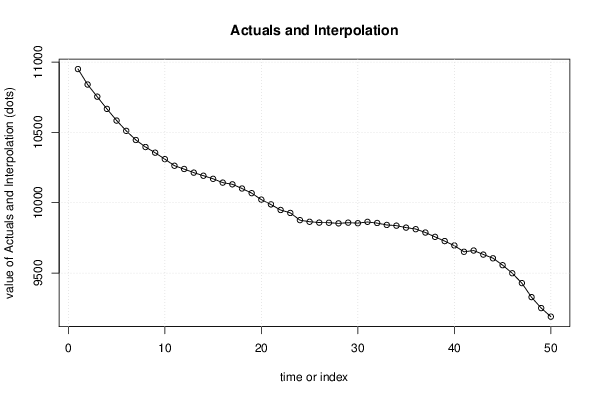
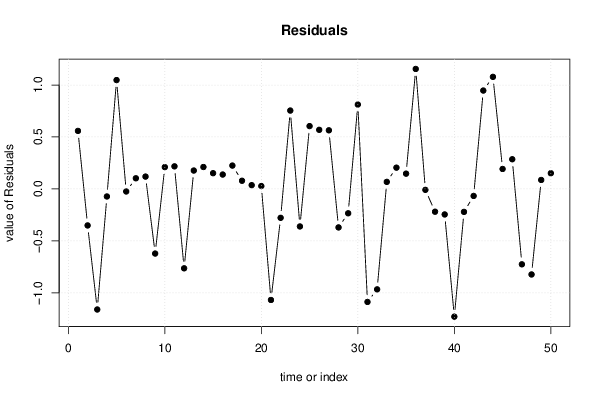
| Multiple Linear Regression - Actuals, Interpolation, and Residuals | |||
| Time or Index | Actuals | Interpolation Forecast | Residuals Prediction Error |
| 1 | 10951 | 10950.4417937119 | 0.558206288090932 |
| 2 | 10840 | 10840.3519329528 | -0.351932952767379 |
| 3 | 10753 | 10754.1612999163 | -1.16129991627984 |
| 4 | 10667 | 10667.0730390517 | -0.0730390517110905 |
| 5 | 10585 | 10583.9523229183 | 1.04767708173417 |
| 6 | 10511 | 10511.0248231572 | -0.024823157150902 |
| 7 | 10446 | 10445.8977922796 | 0.102207720395682 |
| 8 | 10396 | 10395.8813997428 | 0.118600257188402 |
| 9 | 10355 | 10355.6225208629 | -0.622520862872505 |
| 10 | 10310 | 10309.7901658135 | 0.209834186466596 |
| 11 | 10263 | 10262.7829189133 | 0.21708108665879 |
| 12 | 10239 | 10239.7648246419 | -0.764824641881756 |
| 13 | 10214 | 10213.8232536866 | 0.176746313410154 |
| 14 | 10192 | 10191.7893198663 | 0.210680133699597 |
| 15 | 10170 | 10169.8487032351 | 0.151296764928427 |
| 16 | 10143 | 10142.8617457355 | 0.138254264537879 |
| 17 | 10131 | 10130.7756481393 | 0.224351860725919 |
| 18 | 10101 | 10100.9216306336 | 0.0783693664129803 |
| 19 | 10068 | 10067.9640147739 | 0.0359852261211054 |
| 20 | 10022 | 10021.9728178097 | 0.0271821902953173 |
| 21 | 9987 | 9988.06948203062 | -1.0694820306229 |
| 22 | 9948 | 9948.27839696207 | -0.278396962073584 |
| 23 | 9928 | 9927.24574603038 | 0.754253969618753 |
| 24 | 9876 | 9876.36155131501 | -0.361551315005513 |
| 25 | 9865 | 9864.39540588546 | 0.604594114544499 |
| 26 | 9859 | 9858.43118024031 | 0.568819759692246 |
| 27 | 9858 | 9857.43622709098 | 0.563772909023296 |
| 28 | 9853 | 9853.37098654518 | -0.370986545183947 |
| 29 | 9858 | 9858.23473202137 | -0.23473202137228 |
| 30 | 9855 | 9854.18795105243 | 0.812048947568368 |
| 31 | 9863 | 9864.08825733912 | -1.08825733911558 |
| 32 | 9855 | 9855.96734908405 | -0.96734908404481 |
| 33 | 9842 | 9841.93236241868 | 0.0676375813204484 |
| 34 | 9837 | 9836.79550484312 | 0.204495156877523 |
| 35 | 9823 | 9822.85320296597 | 0.14679703403128 |
| 36 | 9813 | 9811.84515077419 | 1.15484922580873 |
| 37 | 9788 | 9788.00923723273 | -0.00923723273400601 |
| 38 | 9757 | 9757.21964040837 | -0.219640408368021 |
| 39 | 9727 | 9727.24607522817 | -0.246075228173575 |
| 40 | 9695 | 9696.23004665785 | -1.23004665784781 |
| 41 | 9651 | 9651.22128715569 | -0.221287155686443 |
| 42 | 9660 | 9660.06787256558 | -0.0678725655828788 |
| 43 | 9632 | 9631.05316999841 | 0.946830001593992 |
| 44 | 9606 | 9604.92141571099 | 1.07858428900626 |
| 45 | 9556 | 9555.80803687364 | 0.191963126356311 |
| 46 | 9499 | 9498.71469988339 | 0.285300116614157 |
| 47 | 9428 | 9428.72617488975 | -0.726174889753597 |
| 48 | 9328 | 9328.82387171932 | -0.823871719319023 |
| 49 | 9251 | 9250.91401601089 | 0.0859839891108088 |
| 50 | 9190 | 9189.84900122429 | 0.150998775714803 |
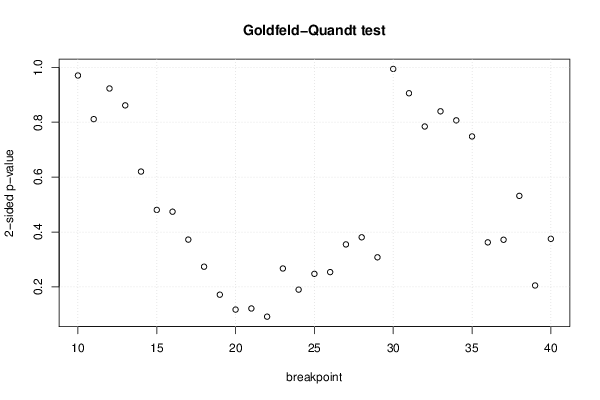
| Goldfeld-Quandt test for Heteroskedasticity | |||
| p-values | Alternative Hypothesis | ||
| breakpoint index | greater | 2-sided | less |
| 10 | 0.485090817032948 | 0.970181634065897 | 0.514909182967052 |
| 11 | 0.405622420190361 | 0.811244840380721 | 0.594377579809639 |
| 12 | 0.538584886447618 | 0.922830227104764 | 0.461415113552382 |
| 13 | 0.430665812032693 | 0.861331624065385 | 0.569334187967308 |
| 14 | 0.310148208297544 | 0.620296416595087 | 0.689851791702456 |
| 15 | 0.240317913721891 | 0.480635827443782 | 0.759682086278109 |
| 16 | 0.23704798995106 | 0.47409597990212 | 0.76295201004894 |
| 17 | 0.186267342182312 | 0.372534684364623 | 0.813732657817688 |
| 18 | 0.136902435918911 | 0.273804871837821 | 0.863097564081089 |
| 19 | 0.0859636074163634 | 0.171927214832727 | 0.914036392583637 |
| 20 | 0.0588343736144543 | 0.117668747228909 | 0.941165626385546 |
| 21 | 0.0608333472102422 | 0.121666694420484 | 0.939166652789758 |
| 22 | 0.0459713793246649 | 0.0919427586493299 | 0.954028620675335 |
| 23 | 0.133669852529573 | 0.267339705059147 | 0.866330147470427 |
| 24 | 0.0951692657260007 | 0.190338531452001 | 0.904830734273999 |
| 25 | 0.12391893266929 | 0.247837865338581 | 0.87608106733071 |
| 26 | 0.127088153369496 | 0.254176306738991 | 0.872911846630504 |
| 27 | 0.17748323595903 | 0.35496647191806 | 0.82251676404097 |
| 28 | 0.19047802250877 | 0.380956045017539 | 0.80952197749123 |
| 29 | 0.154037787656015 | 0.308075575312029 | 0.845962212343985 |
| 30 | 0.496986365936451 | 0.993972731872901 | 0.503013634063549 |
| 31 | 0.547245584546076 | 0.905508830907848 | 0.452754415453924 |
| 32 | 0.60779939080087 | 0.784401218398261 | 0.39220060919913 |
| 33 | 0.580112714507102 | 0.839774570985796 | 0.419887285492898 |
| 34 | 0.596611746953639 | 0.806776506092721 | 0.403388253046361 |
| 35 | 0.625946846349067 | 0.748106307301866 | 0.374053153650933 |
| 36 | 0.81875682283059 | 0.362486354338821 | 0.18124317716941 |
| 37 | 0.814017546163165 | 0.37196490767367 | 0.185982453836835 |
| 38 | 0.734091020567053 | 0.531817958865894 | 0.265908979432947 |
| 39 | 0.89724824469476 | 0.20550351061048 | 0.10275175530524 |
| 40 | 0.812327155872458 | 0.375345688255085 | 0.187672844127542 |
| Meta Analysis of Goldfeld-Quandt test for Heteroskedasticity | |||
| Description | # significant tests | % significant tests | OK/NOK |
| 1% type I error level | 0 | 0 | OK |
| 5% type I error level | 0 | 0 | OK |
| 10% type I error level | 1 | 0.032258064516129 | OK |