| Multiple Linear Regression - Estimated Regression Equation |
| wn[t] = -0.418850835801199 -0.00225081430349453ta[t] + 0.000353090163285318omzet[t] + 0.0160241336628865mw[t] -0.107337318460469winst[t] + 0.0363906856461829cf[t] + 3.96985998339162dienst[t] -2.35771541331388product[t] + 0.000855437130039981ta_d[t] + 0.00974096942632612omzet_d[t] -0.0117758455576938mw_d[t] + 0.267164326757753winst_d[t] -0.115761102660768cf_d[t] -0.000880137267368733ta_p[t] + 0.0153333181085418omzet_p[t] -0.0216815834484814mw_p[t] + 0.13504041258139winst_p[t] -0.0209937936157664cf_p[t] + e[t] |
| Multiple Linear Regression - Ordinary Least Squares | |||||
| Variable | Parameter | S.D. | T-STAT H0: parameter = 0 | 2-tail p-value | 1-tail p-value |
| (Intercept) | -0.418850835801199 | 4.828696 | -0.0867 | 0.931161 | 0.46558 |
| ta | -0.00225081430349453 | 0.002955 | -0.7616 | 0.449215 | 0.224608 |
| omzet | 0.000353090163285318 | 0.003509 | 0.1006 | 0.920178 | 0.460089 |
| mw | 0.0160241336628865 | 0.004904 | 3.2679 | 0.001782 | 0.000891 |
| winst | -0.107337318460469 | 0.075926 | -1.4137 | 0.162531 | 0.081265 |
| cf | 0.0363906856461829 | 0.062761 | 0.5798 | 0.564163 | 0.282082 |
| dienst | 3.96985998339162 | 5.699232 | 0.6966 | 0.488724 | 0.244362 |
| product | -2.35771541331388 | 6.846833 | -0.3444 | 0.731766 | 0.365883 |
| ta_d | 0.000855437130039981 | 0.002971 | 0.2879 | 0.774382 | 0.387191 |
| omzet_d | 0.00974096942632612 | 0.003597 | 2.7083 | 0.008764 | 0.004382 |
| mw_d | -0.0117758455576938 | 0.005908 | -1.9931 | 0.050725 | 0.025363 |
| winst_d | 0.267164326757753 | 0.082818 | 3.2259 | 0.00202 | 0.00101 |
| cf_d | -0.115761102660768 | 0.066855 | -1.7315 | 0.088411 | 0.044205 |
| ta_p | -0.000880137267368733 | 0.003656 | -0.2407 | 0.81057 | 0.405285 |
| omzet_p | 0.0153333181085418 | 0.004052 | 3.7837 | 0.000355 | 0.000177 |
| mw_p | -0.0216815834484814 | 0.005493 | -3.9474 | 0.000207 | 0.000104 |
| winst_p | 0.13504041258139 | 0.091418 | 1.4772 | 0.144775 | 0.072387 |
| cf_p | -0.0209937936157664 | 0.084011 | -0.2499 | 0.80351 | 0.401755 |
| Multiple Linear Regression - Regression Statistics | |
| Multiple R | 0.983604735621981 |
| R-squared | 0.967478275937988 |
| Adjusted R-squared | 0.958414844642017 |
| F-TEST (value) | 106.745254015231 |
| F-TEST (DF numerator) | 17 |
| F-TEST (DF denominator) | 61 |
| p-value | 0 |
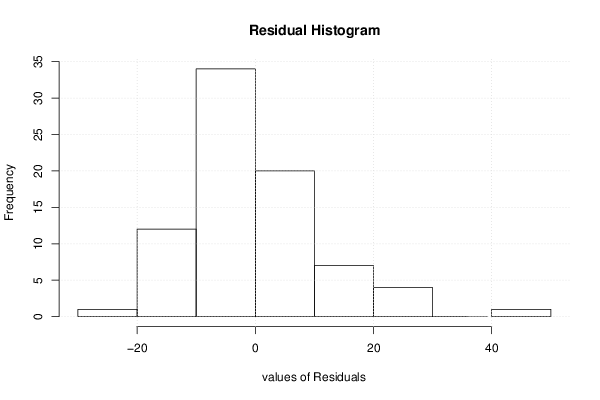
| Multiple Linear Regression - Residual Statistics | |
| Residual Standard Deviation | 13.1539797625996 |
| Sum Squared Residuals | 10554.6581992877 |
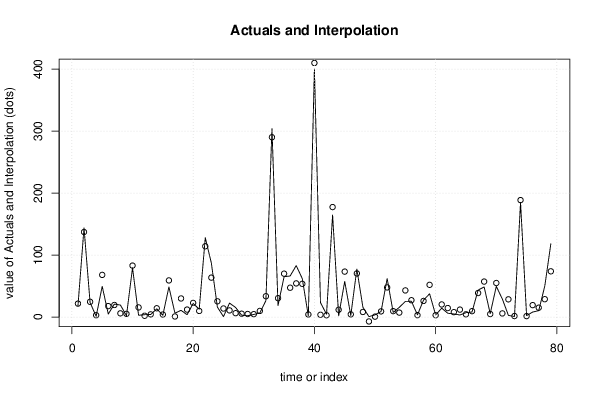
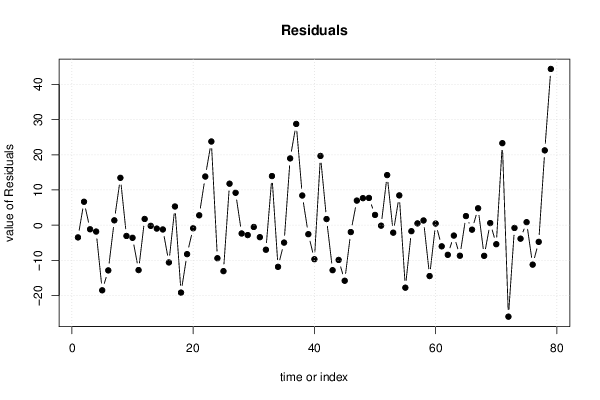
| Multiple Linear Regression - Actuals, Interpolation, and Residuals | |||
| Time or Index | Actuals | Interpolation Forecast | Residuals Prediction Error |
| 1 | 18.2 | 21.6568545438032 | -3.45685454380321 |
| 2 | 143.8 | 137.134202839013 | 6.66579716098685 |
| 3 | 23.4 | 24.5499156286502 | -1.14991562865021 |
| 4 | 1.1 | 2.89603040001339 | -1.79603040001339 |
| 5 | 49.5 | 67.9700692903106 | -18.4700692903106 |
| 6 | 4.8 | 17.6214065223235 | -12.8214065223235 |
| 7 | 20.8 | 19.413342837547 | 1.38665716245305 |
| 8 | 19.4 | 5.9493097828708 | 13.4506902171292 |
| 9 | 2.1 | 5.14979696402705 | -3.04979696402705 |
| 10 | 79.4 | 82.9717620430496 | -3.57176204304957 |
| 11 | 2.8 | 15.5320953176455 | -12.7320953176455 |
| 12 | 3.8 | 2.02202102921023 | 1.77797897078977 |
| 13 | 4.1 | 4.27884690996464 | -0.178846909964642 |
| 14 | 13.2 | 14.1486635047642 | -0.948663504764192 |
| 15 | 2.8 | 4.0038037858585 | -1.20380378585851 |
| 16 | 48.5 | 59.0564749163737 | -10.5564749163737 |
| 17 | 6.2 | 0.878944022419892 | 5.32105597758011 |
| 18 | 10.8 | 29.9263017662835 | -19.1263017662835 |
| 19 | 3.8 | 12.0082101754515 | -8.20821017545146 |
| 20 | 21.9 | 22.7617239661268 | -0.861723966126758 |
| 21 | 12.6 | 9.78717061789646 | 2.81282938210354 |
| 22 | 128 | 114.180759613727 | 13.8192403862728 |
| 23 | 87.3 | 63.5373643088268 | 23.7626356911732 |
| 24 | 16 | 25.3678286439466 | -9.36782864394663 |
| 25 | 0.7 | 13.7354295863332 | -13.0354295863332 |
| 26 | 22.5 | 10.7160534017161 | 11.7839465982839 |
| 27 | 15.4 | 6.19317422991984 | 9.20682577008016 |
| 28 | 3 | 5.3456848916174 | -2.34568489161739 |
| 29 | 2.1 | 4.89801464674306 | -2.79801464674306 |
| 30 | 4.1 | 4.59699492966701 | -0.496994929667014 |
| 31 | 6.4 | 9.79262484176468 | -3.39262484176468 |
| 32 | 26.6 | 33.5546153109106 | -6.95461531091064 |
| 33 | 304 | 290.045412789517 | 13.9545872104826 |
| 34 | 18.6 | 30.4141210432007 | -11.8141210432007 |
| 35 | 65 | 69.9319369626831 | -4.93193696268311 |
| 36 | 66.2 | 47.2342197063386 | 18.9657802936614 |
| 37 | 83 | 54.2528028758254 | 28.7471971241746 |
| 38 | 62 | 53.5682276098399 | 8.43177239016013 |
| 39 | 1.6 | 4.14348689606351 | -2.54348689606351 |
| 40 | 400.2 | 409.849502963537 | -9.64950296353657 |
| 41 | 23.3 | 3.6332046256382 | 19.6667953743618 |
| 42 | 4.6 | 2.84645538543064 | 1.75354461456936 |
| 43 | 164.6 | 177.365482455016 | -12.7654824550164 |
| 44 | 1.9 | 11.7544329818287 | -9.85443298182874 |
| 45 | 57.5 | 73.2607010365384 | -15.7607010365384 |
| 46 | 2.4 | 4.33938797503698 | -1.93938797503698 |
| 47 | 77.3 | 70.312489739374 | 6.98751026062598 |
| 48 | 15.8 | 8.11935607759719 | 7.68064392240282 |
| 49 | 0.6 | -7.13864162003415 | 7.73864162003415 |
| 50 | 3.5 | 0.579614777587592 | 2.92038522241241 |
| 51 | 9 | 9.12255633276976 | -0.122556332769764 |
| 52 | 62 | 47.7666321396565 | 14.2333678603435 |
| 53 | 7.4 | 9.51450669372579 | -2.11450669372579 |
| 54 | 15.6 | 7.13606574514469 | 8.46393425485531 |
| 55 | 25.2 | 42.9237590165683 | -17.7237590165683 |
| 56 | 25.4 | 27.0974797046171 | -1.69747970461711 |
| 57 | 3.5 | 2.98066851924064 | 0.519331480759363 |
| 58 | 27.3 | 25.95602747058 | 1.34397252942004 |
| 59 | 37.5 | 51.9255723456576 | -14.4255723456576 |
| 60 | 3.4 | 2.92717409182858 | 0.472825908171421 |
| 61 | 14.3 | 20.2890446520356 | -5.9890446520356 |
| 62 | 6.1 | 14.4975226508702 | -8.39752265087017 |
| 63 | 4.9 | 7.83841282420111 | -2.93841282420111 |
| 64 | 3.3 | 11.9548980636366 | -8.65489806363658 |
| 65 | 7 | 4.40316672599146 | 2.59683327400854 |
| 66 | 8.2 | 9.46268943677433 | -1.26268943677433 |
| 67 | 43.5 | 38.6906726524944 | 4.80932734750565 |
| 68 | 48.5 | 57.1892260418941 | -8.6892260418941 |
| 69 | 5.4 | 4.79195559015896 | 0.608044409841041 |
| 70 | 49.5 | 54.892181804548 | -5.39218180454801 |
| 71 | 29.1 | 5.81205503920532 | 23.2879449607947 |
| 72 | 2.6 | 28.5491842210118 | -25.9491842210118 |
| 73 | 0.8 | 1.5717019656024 | -0.7717019656024 |
| 74 | 184.8 | 188.616629624554 | -3.81662962455432 |
| 75 | 2.3 | 1.43486731642933 | 0.865132683570666 |
| 76 | 8 | 19.1831782691536 | -11.1831782691536 |
| 77 | 10.3 | 15.0205683813587 | -4.72056838135867 |
| 78 | 50 | 28.7581202642141 | 21.2418797357859 |
| 79 | 118.1 | 73.7457968662819 | 44.3542031337181 |
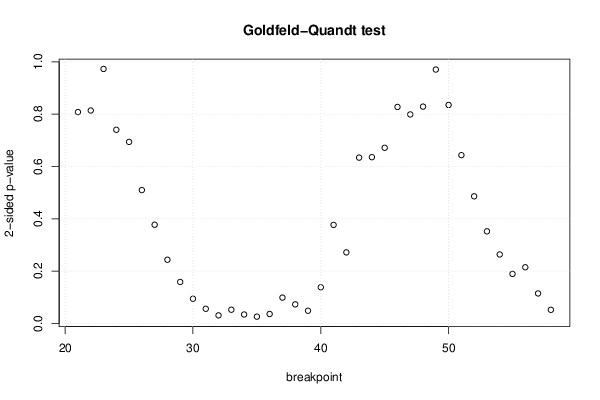
| Goldfeld-Quandt test for Heteroskedasticity | |||
| p-values | Alternative Hypothesis | ||
| breakpoint index | greater | 2-sided | less |
| 21 | 0.403964541018135 | 0.80792908203627 | 0.596035458981865 |
| 22 | 0.593096616816644 | 0.813806766366712 | 0.406903383183356 |
| 23 | 0.486345644567129 | 0.972691289134259 | 0.513654355432871 |
| 24 | 0.370067787824302 | 0.740135575648605 | 0.629932212175698 |
| 25 | 0.346873344411742 | 0.693746688823484 | 0.653126655588258 |
| 26 | 0.254769774869535 | 0.509539549739071 | 0.745230225130465 |
| 27 | 0.188558114367496 | 0.377116228734993 | 0.811441885632504 |
| 28 | 0.121657432814263 | 0.243314865628525 | 0.878342567185737 |
| 29 | 0.0791496747678073 | 0.158299349535615 | 0.920850325232193 |
| 30 | 0.0470805903193917 | 0.0941611806387834 | 0.952919409680608 |
| 31 | 0.0279161600373496 | 0.0558323200746992 | 0.97208383996265 |
| 32 | 0.0153340139159065 | 0.0306680278318129 | 0.984665986084094 |
| 33 | 0.0260866707066499 | 0.0521733414132998 | 0.97391332929335 |
| 34 | 0.0170265027417296 | 0.0340530054834592 | 0.98297349725827 |
| 35 | 0.0128669477938066 | 0.0257338955876133 | 0.987133052206193 |
| 36 | 0.0179302054811058 | 0.0358604109622116 | 0.982069794518894 |
| 37 | 0.0492741122180004 | 0.0985482244360008 | 0.950725887782 |
| 38 | 0.0363997987132734 | 0.0727995974265468 | 0.963600201286727 |
| 39 | 0.0241646425663331 | 0.0483292851326663 | 0.975835357433667 |
| 40 | 0.0690415249309083 | 0.138083049861817 | 0.930958475069092 |
| 41 | 0.188221663750918 | 0.376443327501836 | 0.811778336249082 |
| 42 | 0.135701913353523 | 0.271403826707045 | 0.864298086646477 |
| 43 | 0.316854610090851 | 0.633709220181702 | 0.683145389909149 |
| 44 | 0.317705411007295 | 0.635410822014589 | 0.682294588992705 |
| 45 | 0.664344688383484 | 0.671310623233032 | 0.335655311616516 |
| 46 | 0.586290799974037 | 0.827418400051925 | 0.413709200025963 |
| 47 | 0.600583206769031 | 0.798833586461938 | 0.399416793230969 |
| 48 | 0.5856668349296 | 0.828666330140801 | 0.4143331650704 |
| 49 | 0.514794340848774 | 0.970411318302452 | 0.485205659151226 |
| 50 | 0.417477067983219 | 0.834954135966437 | 0.582522932016781 |
| 51 | 0.321576296082473 | 0.643152592164946 | 0.678423703917527 |
| 52 | 0.242924391062247 | 0.485848782124493 | 0.757075608937753 |
| 53 | 0.176006172361774 | 0.352012344723548 | 0.823993827638226 |
| 54 | 0.131758968761147 | 0.263517937522295 | 0.868241031238853 |
| 55 | 0.0946180935498576 | 0.189236187099715 | 0.905381906450142 |
| 56 | 0.10728046983946 | 0.214560939678919 | 0.89271953016054 |
| 57 | 0.057230458994443 | 0.114460917988886 | 0.942769541005557 |
| 58 | 0.0259487687010477 | 0.0518975374020953 | 0.974051231298952 |
| Meta Analysis of Goldfeld-Quandt test for Heteroskedasticity | |||
| Description | # significant tests | % significant tests | OK/NOK |
| 1% type I error level | 0 | 0 | OK |
| 5% type I error level | 5 | 0.131578947368421 | NOK |
| 10% type I error level | 11 | 0.289473684210526 | NOK |