| Multiple Linear Regression - Estimated Regression Equation |
| totaal[t] = + 28077.1236605879 -21314442.052228jaar[t] -13.1476462703488pop[t] + 0.836477807566883vlaams_man[t] + 0.0471501485953764man_vlaams_pop[t] + 1.13238757187277vlaams_vrouw[t] -0.0449098556338475vrouw_vlaams_pop[t] + 1.11206792400799waals_man[t] -0.0337743960440693man_waals_pop[t] + 0.92867218471356waals_vrouw[t] + 0.0395007801556062vrouw_waals_pop[t] + 0.951118040980139brussel_man[t] -0.0226033357346419man_brussel_pop[t] + 1.10169157043926brussel_vrouw[t] + 0.0138893774853077vrouw_brussel_pop[t] -13.8206845223669t + e[t] |
| Multiple Linear Regression - Ordinary Least Squares | |||||
| Variable | Parameter | S.D. | T-STAT H0: parameter = 0 | 2-tail p-value | 1-tail p-value |
| (Intercept) | 28077.1236605879 | 17923.149822 | 1.5665 | 0.126486 | 0.063243 |
| jaar | -21314442.052228 | 13605470.329206 | -1.5666 | 0.126467 | 0.063234 |
| pop | -13.1476462703488 | 29.76534 | -0.4417 | 0.661496 | 0.330748 |
| vlaams_man | 0.836477807566883 | 0.106131 | 7.8816 | 0 | 0 |
| man_vlaams_pop | 0.0471501485953764 | 0.039147 | 1.2044 | 0.236735 | 0.118367 |
| vlaams_vrouw | 1.13238757187277 | 0.10731 | 10.5525 | 0 | 0 |
| vrouw_vlaams_pop | -0.0449098556338475 | 0.036031 | -1.2464 | 0.221126 | 0.110563 |
| waals_man | 1.11206792400799 | 0.085527 | 13.0026 | 0 | 0 |
| man_waals_pop | -0.0337743960440693 | 0.047276 | -0.7144 | 0.479848 | 0.239924 |
| waals_vrouw | 0.92867218471356 | 0.107232 | 8.6604 | 0 | 0 |
| vrouw_waals_pop | 0.0395007801556062 | 0.066286 | 0.5959 | 0.555176 | 0.277588 |
| brussel_man | 0.951118040980139 | 0.118236 | 8.0442 | 0 | 0 |
| man_brussel_pop | -0.0226033357346419 | 0.075357 | -0.3 | 0.76604 | 0.38302 |
| brussel_vrouw | 1.10169157043926 | 0.111625 | 9.8696 | 0 | 0 |
| vrouw_brussel_pop | 0.0138893774853077 | 0.067721 | 0.2051 | 0.83872 | 0.41936 |
| t | -13.8206845223669 | 8.781073 | -1.5739 | 0.124767 | 0.062384 |
| Multiple Linear Regression - Regression Statistics | |
| Multiple R | 0.999999127416479 |
| R-squared | 0.999998254833719 |
| Adjusted R-squared | 0.999997484907419 |
| F-TEST (value) | 1298823.34762231 |
| F-TEST (DF numerator) | 15 |
| F-TEST (DF denominator) | 34 |
| p-value | 0 |
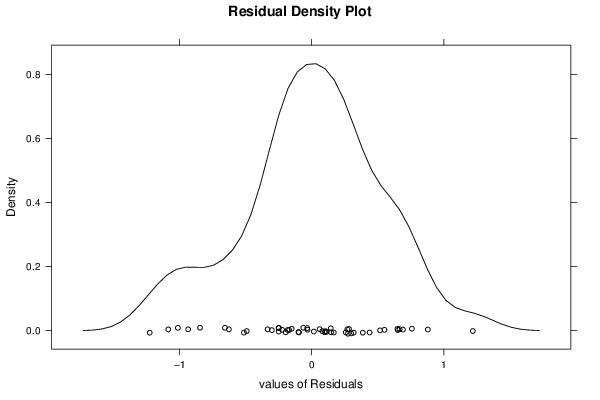
| Multiple Linear Regression - Residual Statistics | |
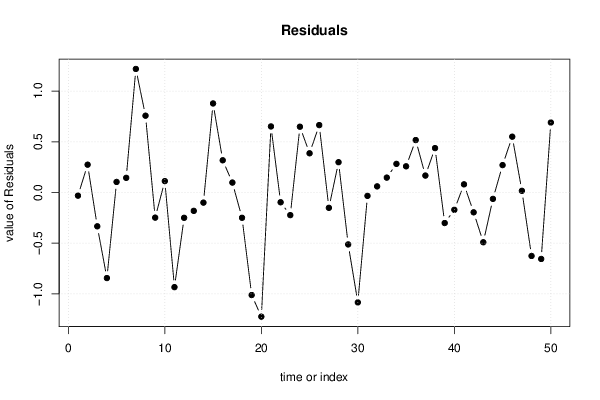
| Residual Standard Deviation | 0.625454159930041 |
| Sum Squared Residuals | 13.300558809909 |
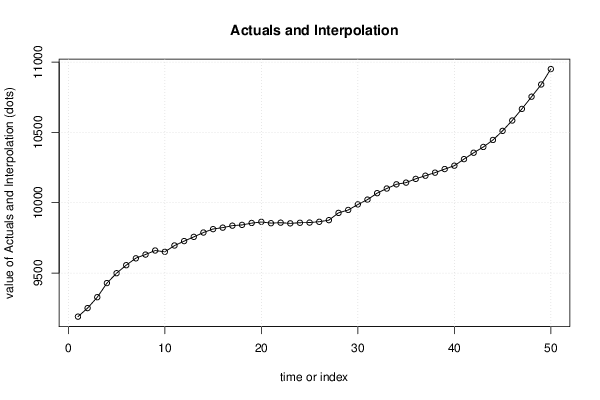
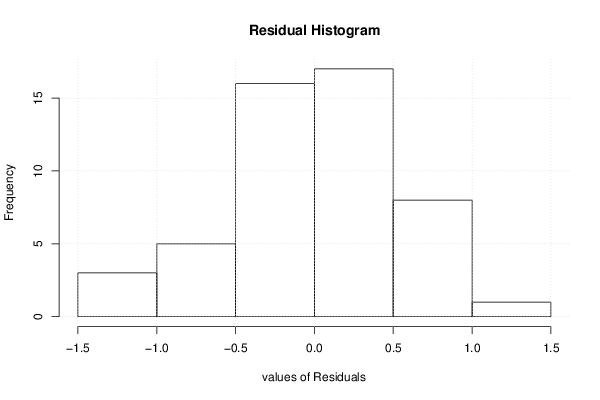
| Multiple Linear Regression - Actuals, Interpolation, and Residuals | |||
| Time or Index | Actuals | Interpolation Forecast | Residuals Prediction Error |
| 1 | 9190 | 9190.03166215015 | -0.031662150147516 |
| 2 | 9251 | 9250.7259721909 | 0.274027809101506 |
| 3 | 9328 | 9328.3339453377 | -0.333945337697938 |
| 4 | 9428 | 9428.84450862113 | -0.844508621128191 |
| 5 | 9499 | 9498.8962943584 | 0.103705641601395 |
| 6 | 9556 | 9555.85585873062 | 0.144141269378778 |
| 7 | 9606 | 9604.78173282911 | 1.21826717088526 |
| 8 | 9632 | 9631.24285753586 | 0.757142464144093 |
| 9 | 9660 | 9660.24842602742 | -0.248426027417757 |
| 10 | 9651 | 9650.88819182431 | 0.111808175694669 |
| 11 | 9695 | 9695.93415407212 | -0.934154072116918 |
| 12 | 9727 | 9727.25016631417 | -0.250166314165801 |
| 13 | 9757 | 9757.1816671442 | -0.181667144196003 |
| 14 | 9788 | 9788.10043647916 | -0.100436479158595 |
| 15 | 9813 | 9812.12212974936 | 0.877870250641633 |
| 16 | 9823 | 9822.68270478385 | 0.317295216152959 |
| 17 | 9837 | 9836.90252575802 | 0.0974742419762931 |
| 18 | 9842 | 9842.24991108841 | -0.249911088412445 |
| 19 | 9855 | 9856.01210009834 | -1.01210009833895 |
| 20 | 9863 | 9864.22528281931 | -1.22528281931034 |
| 21 | 9855 | 9854.3488413753 | 0.651158624696052 |
| 22 | 9858 | 9858.09679191355 | -0.0967919135492537 |
| 23 | 9853 | 9853.22374877865 | -0.223748778650978 |
| 24 | 9858 | 9857.35170878243 | 0.648291217567291 |
| 25 | 9859 | 9858.61371700563 | 0.386282994368908 |
| 26 | 9865 | 9864.33566822241 | 0.664331777592909 |
| 27 | 9876 | 9876.15155822476 | -0.15155822475686 |
| 28 | 9928 | 9927.7017736582 | 0.298226341803655 |
| 29 | 9948 | 9948.51274419602 | -0.512744196018935 |
| 30 | 9987 | 9988.08478798247 | -1.08478798247262 |
| 31 | 10022 | 10022.0338159539 | -0.0338159539116831 |
| 32 | 10068 | 10067.9401148246 | 0.0598851753513681 |
| 33 | 10101 | 10100.8536962377 | 0.146303762256546 |
| 34 | 10131 | 10130.7180306035 | 0.281969396543092 |
| 35 | 10143 | 10142.7423724168 | 0.257627583160653 |
| 36 | 10170 | 10169.4832766703 | 0.516723329680716 |
| 37 | 10192 | 10191.833478526 | 0.16652147397086 |
| 38 | 10214 | 10213.562390851 | 0.437609149046182 |
| 39 | 10239 | 10239.3015960772 | -0.301596077247167 |
| 40 | 10263 | 10263.1713153628 | -0.17131536280786 |
| 41 | 10310 | 10309.9199578691 | 0.0800421309329473 |
| 42 | 10355 | 10355.1961176177 | -0.196117617745985 |
| 43 | 10396 | 10396.491422587 | -0.491422587005978 |
| 44 | 10446 | 10446.0635656821 | -0.0635656820742312 |
| 45 | 10511 | 10510.730395545 | 0.269604455042736 |
| 46 | 10585 | 10584.4499818147 | 0.550018185337703 |
| 47 | 10667 | 10666.9838679264 | 0.0161320735950905 |
| 48 | 10753 | 10753.6265638849 | -0.626563884893406 |
| 49 | 10840 | 10840.6560847692 | -0.656084769217903 |
| 50 | 10951 | 10950.3100867281 | 0.689913271920019 |
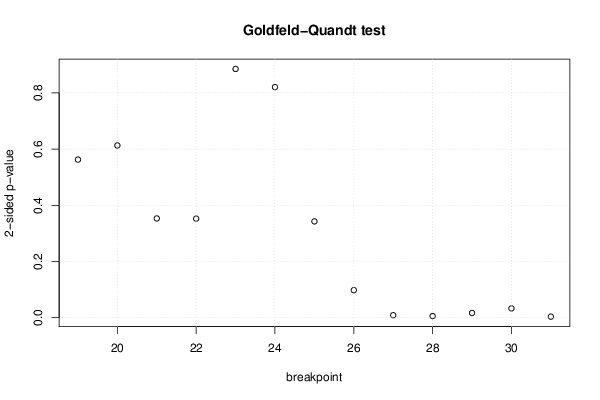
| Goldfeld-Quandt test for Heteroskedasticity | |||
| p-values | Alternative Hypothesis | ||
| breakpoint index | greater | 2-sided | less |
| 19 | 0.281468497601811 | 0.562936995203622 | 0.718531502398189 |
| 20 | 0.306588497892881 | 0.613176995785761 | 0.693411502107119 |
| 21 | 0.176651334812135 | 0.35330266962427 | 0.823348665187865 |
| 22 | 0.17642584746329 | 0.352851694926579 | 0.82357415253671 |
| 23 | 0.442770746724512 | 0.885541493449025 | 0.557229253275488 |
| 24 | 0.589489153993181 | 0.821021692013638 | 0.410510846006819 |
| 25 | 0.828522837254048 | 0.342954325491904 | 0.171477162745952 |
| 26 | 0.950978074733015 | 0.098043850533971 | 0.0490219252669855 |
| 27 | 0.995575679036913 | 0.00884864192617432 | 0.00442432096308716 |
| 28 | 0.997116471632963 | 0.00576705673407382 | 0.00288352836703691 |
| 29 | 0.991600501157701 | 0.0167989976845981 | 0.00839949884229906 |
| 30 | 0.98342145794088 | 0.0331570841182391 | 0.0165785420591196 |
| 31 | 0.998110964889465 | 0.00377807022107024 | 0.00188903511053512 |
| Meta Analysis of Goldfeld-Quandt test for Heteroskedasticity | |||
| Description | # significant tests | % significant tests | OK/NOK |
| 1% type I error level | 3 | 0.230769230769231 | NOK |
| 5% type I error level | 5 | 0.384615384615385 | NOK |
| 10% type I error level | 6 | 0.461538461538462 | NOK |