Free Statistics

of Irreproducible Research!

Author's title

Author*Unverified author*
R Software Modulerwasp_autocorrelation.wasp
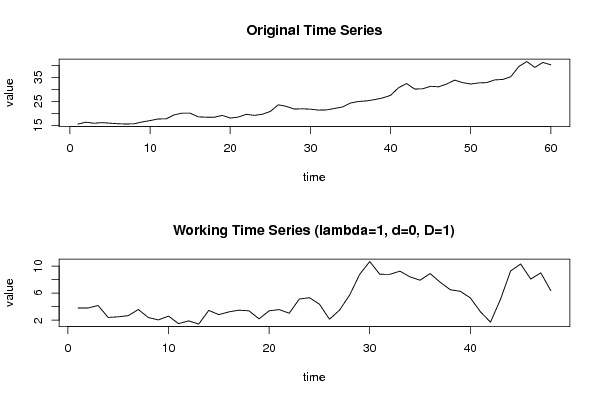
Title produced by software(Partial) Autocorrelation Function
Date of computationSun, 27 May 2012 20:04:20 -0400
Cite this page as followsStatistical Computations at FreeStatistics.org, Office for Research Development and Education, URL https://freestatistics.org/blog/index.php?v=date/2012/May/27/t1338163524mrg0tzsg50e3k22.htm/, Retrieved Wed, 08 May 2024 13:51:29 +0000
Statistical Computations at FreeStatistics.org, Office for Research Development and Education, URL https://freestatistics.org/blog/index.php?pk=167753, Retrieved Wed, 08 May 2024 13:51:29 +0000
QR Codes:

Original text written by user:
IsPrivate?No (this computation is public)
User-defined keywordsKDGP2W12
Estimated Impact105
Family? (F = Feedback message, R = changed R code, M = changed R Module, P = changed Parameters, D = changed Data)
-       [(Partial) Autocorrelation Function] [degree differenci...] [2012-05-28 00:04:20] [38b7061a49f7215900abdc4599fce3db] [Current]
Feedback Forum

Post a new message
Dataseries X:
15.579
16.348
15.928
16.171
15.937
15.713
15.594
15.683
16.438
17.032
17.696
17.745
19.394
20.148
20.108
18.584
18.441
18.391
19.178
18.079
18.483
19.644
19.195
19.650
20.830
23.595
22.937
21.814
21.928
21.777
21.383
21.467
22.052
22.680
24.320
24.977
25.204
25.739
26.434
27.525
30.695
32.436
30.160
30.236
31.293
31.077
32.226
33.865
32.810
32.242
32.700
32.819
33.947
34.148
35.261
39.506
41.591
39.148
41.216
40.225


Summary of computational transaction
Raw Inputview raw input (R code)
Raw Outputview raw output of R engine
Computing time1 seconds
R Server'Herman Ole Andreas Wold' @ wold.wessa.net

\begin{tabular}{lllllllll}
\hline
Summary of computational transaction \tabularnewline
Raw Input & view raw input (R code)  \tabularnewline
Raw Output & view raw output of R engine  \tabularnewline
Computing time & 1 seconds \tabularnewline
R Server & 'Herman Ole Andreas Wold' @ wold.wessa.net \tabularnewline
\hline
\end{tabular}
%Source: https://freestatistics.org/blog/index.php?pk=167753&T=0

[TABLE]
[ROW][C]Summary of computational transaction[/C][/ROW]
[ROW][C]Raw Input[/C][C]view raw input (R code) [/C][/ROW]
[ROW][C]Raw Output[/C][C]view raw output of R engine [/C][/ROW]
[ROW][C]Computing time[/C][C]1 seconds[/C][/ROW]
[ROW][C]R Server[/C][C]'Herman Ole Andreas Wold' @ wold.wessa.net[/C][/ROW]
[/TABLE]
Source: https://freestatistics.org/blog/index.php?pk=167753&T=0

Globally Unique Identifier (entire table): ba.freestatistics.org/blog/index.php?pk=167753&T=0

As an alternative you can also use a QR Code:  

The GUIDs for individual cells are displayed in the table below:

Summary of computational transaction
Raw Inputview raw input (R code)
Raw Outputview raw output of R engine
Computing time1 seconds
R Server'Herman Ole Andreas Wold' @ wold.wessa.net


Autocorrelation Function
Time lag kACF(k)T-STATP-value
10.8460015.86130
20.63674.41122.9e-05
30.4810623.33290.000831
40.3838112.65910.005308
50.3204332.220.015587
60.3151472.18340.016963
70.3195842.21410.015801
80.2700641.87110.03372
90.2180981.5110.068669
100.1608821.11460.13528
110.1329680.92120.180768
120.100990.69970.243753
130.1271220.88070.191428
140.17271.19650.11869
150.1768291.22510.113256
160.086510.59940.275876
17-0.055802-0.38660.350378
18-0.181195-1.25540.107713
19-0.257788-1.7860.040208
20-0.254629-1.76410.042037
21-0.256471-1.77690.040962
22-0.247747-1.71640.046264
23-0.262966-1.82190.037353
24-0.297861-2.06360.022241
25-0.331995-2.30010.012916
26-0.321487-2.22730.015325
27-0.29167-2.02070.024452
28-0.276041-1.91250.030897
29-0.223461-1.54820.064073
30-0.187858-1.30150.099647
31-0.188784-1.30790.098563
32-0.199153-1.37980.087025
33-0.177935-1.23280.111833
34-0.177542-1.230.112338
35-0.165853-1.14910.128112
36-0.135376-0.93790.176492
37-0.098431-0.6820.249274
38-0.093705-0.64920.259649
39-0.107798-0.74680.229399
40-0.099506-0.68940.246945
41-0.092637-0.64180.262025
42-0.087864-0.60870.272783
43-0.079228-0.54890.292807
44-0.04797-0.33230.370538
45-0.027312-0.18920.425358
46-0.018212-0.12620.450061
47-0.004623-0.0320.48729
48NANANA

\begin{tabular}{lllllllll}
\hline
Autocorrelation Function \tabularnewline
Time lag k & ACF(k) & T-STAT & P-value \tabularnewline
1 & 0.846001 & 5.8613 & 0 \tabularnewline
2 & 0.6367 & 4.4112 & 2.9e-05 \tabularnewline
3 & 0.481062 & 3.3329 & 0.000831 \tabularnewline
4 & 0.383811 & 2.6591 & 0.005308 \tabularnewline
5 & 0.320433 & 2.22 & 0.015587 \tabularnewline
6 & 0.315147 & 2.1834 & 0.016963 \tabularnewline
7 & 0.319584 & 2.2141 & 0.015801 \tabularnewline
8 & 0.270064 & 1.8711 & 0.03372 \tabularnewline
9 & 0.218098 & 1.511 & 0.068669 \tabularnewline
10 & 0.160882 & 1.1146 & 0.13528 \tabularnewline
11 & 0.132968 & 0.9212 & 0.180768 \tabularnewline
12 & 0.10099 & 0.6997 & 0.243753 \tabularnewline
13 & 0.127122 & 0.8807 & 0.191428 \tabularnewline
14 & 0.1727 & 1.1965 & 0.11869 \tabularnewline
15 & 0.176829 & 1.2251 & 0.113256 \tabularnewline
16 & 0.08651 & 0.5994 & 0.275876 \tabularnewline
17 & -0.055802 & -0.3866 & 0.350378 \tabularnewline
18 & -0.181195 & -1.2554 & 0.107713 \tabularnewline
19 & -0.257788 & -1.786 & 0.040208 \tabularnewline
20 & -0.254629 & -1.7641 & 0.042037 \tabularnewline
21 & -0.256471 & -1.7769 & 0.040962 \tabularnewline
22 & -0.247747 & -1.7164 & 0.046264 \tabularnewline
23 & -0.262966 & -1.8219 & 0.037353 \tabularnewline
24 & -0.297861 & -2.0636 & 0.022241 \tabularnewline
25 & -0.331995 & -2.3001 & 0.012916 \tabularnewline
26 & -0.321487 & -2.2273 & 0.015325 \tabularnewline
27 & -0.29167 & -2.0207 & 0.024452 \tabularnewline
28 & -0.276041 & -1.9125 & 0.030897 \tabularnewline
29 & -0.223461 & -1.5482 & 0.064073 \tabularnewline
30 & -0.187858 & -1.3015 & 0.099647 \tabularnewline
31 & -0.188784 & -1.3079 & 0.098563 \tabularnewline
32 & -0.199153 & -1.3798 & 0.087025 \tabularnewline
33 & -0.177935 & -1.2328 & 0.111833 \tabularnewline
34 & -0.177542 & -1.23 & 0.112338 \tabularnewline
35 & -0.165853 & -1.1491 & 0.128112 \tabularnewline
36 & -0.135376 & -0.9379 & 0.176492 \tabularnewline
37 & -0.098431 & -0.682 & 0.249274 \tabularnewline
38 & -0.093705 & -0.6492 & 0.259649 \tabularnewline
39 & -0.107798 & -0.7468 & 0.229399 \tabularnewline
40 & -0.099506 & -0.6894 & 0.246945 \tabularnewline
41 & -0.092637 & -0.6418 & 0.262025 \tabularnewline
42 & -0.087864 & -0.6087 & 0.272783 \tabularnewline
43 & -0.079228 & -0.5489 & 0.292807 \tabularnewline
44 & -0.04797 & -0.3323 & 0.370538 \tabularnewline
45 & -0.027312 & -0.1892 & 0.425358 \tabularnewline
46 & -0.018212 & -0.1262 & 0.450061 \tabularnewline
47 & -0.004623 & -0.032 & 0.48729 \tabularnewline
48 & NA & NA & NA \tabularnewline
\hline
\end{tabular}
%Source: https://freestatistics.org/blog/index.php?pk=167753&T=1

[TABLE]
[ROW][C]Autocorrelation Function[/C][/ROW]
[ROW][C]Time lag k[/C][C]ACF(k)[/C][C]T-STAT[/C][C]P-value[/C][/ROW]
[ROW][C]1[/C][C]0.846001[/C][C]5.8613[/C][C]0[/C][/ROW]
[ROW][C]2[/C][C]0.6367[/C][C]4.4112[/C][C]2.9e-05[/C][/ROW]
[ROW][C]3[/C][C]0.481062[/C][C]3.3329[/C][C]0.000831[/C][/ROW]
[ROW][C]4[/C][C]0.383811[/C][C]2.6591[/C][C]0.005308[/C][/ROW]
[ROW][C]5[/C][C]0.320433[/C][C]2.22[/C][C]0.015587[/C][/ROW]
[ROW][C]6[/C][C]0.315147[/C][C]2.1834[/C][C]0.016963[/C][/ROW]
[ROW][C]7[/C][C]0.319584[/C][C]2.2141[/C][C]0.015801[/C][/ROW]
[ROW][C]8[/C][C]0.270064[/C][C]1.8711[/C][C]0.03372[/C][/ROW]
[ROW][C]9[/C][C]0.218098[/C][C]1.511[/C][C]0.068669[/C][/ROW]
[ROW][C]10[/C][C]0.160882[/C][C]1.1146[/C][C]0.13528[/C][/ROW]
[ROW][C]11[/C][C]0.132968[/C][C]0.9212[/C][C]0.180768[/C][/ROW]
[ROW][C]12[/C][C]0.10099[/C][C]0.6997[/C][C]0.243753[/C][/ROW]
[ROW][C]13[/C][C]0.127122[/C][C]0.8807[/C][C]0.191428[/C][/ROW]
[ROW][C]14[/C][C]0.1727[/C][C]1.1965[/C][C]0.11869[/C][/ROW]
[ROW][C]15[/C][C]0.176829[/C][C]1.2251[/C][C]0.113256[/C][/ROW]
[ROW][C]16[/C][C]0.08651[/C][C]0.5994[/C][C]0.275876[/C][/ROW]
[ROW][C]17[/C][C]-0.055802[/C][C]-0.3866[/C][C]0.350378[/C][/ROW]
[ROW][C]18[/C][C]-0.181195[/C][C]-1.2554[/C][C]0.107713[/C][/ROW]
[ROW][C]19[/C][C]-0.257788[/C][C]-1.786[/C][C]0.040208[/C][/ROW]
[ROW][C]20[/C][C]-0.254629[/C][C]-1.7641[/C][C]0.042037[/C][/ROW]
[ROW][C]21[/C][C]-0.256471[/C][C]-1.7769[/C][C]0.040962[/C][/ROW]
[ROW][C]22[/C][C]-0.247747[/C][C]-1.7164[/C][C]0.046264[/C][/ROW]
[ROW][C]23[/C][C]-0.262966[/C][C]-1.8219[/C][C]0.037353[/C][/ROW]
[ROW][C]24[/C][C]-0.297861[/C][C]-2.0636[/C][C]0.022241[/C][/ROW]
[ROW][C]25[/C][C]-0.331995[/C][C]-2.3001[/C][C]0.012916[/C][/ROW]
[ROW][C]26[/C][C]-0.321487[/C][C]-2.2273[/C][C]0.015325[/C][/ROW]
[ROW][C]27[/C][C]-0.29167[/C][C]-2.0207[/C][C]0.024452[/C][/ROW]
[ROW][C]28[/C][C]-0.276041[/C][C]-1.9125[/C][C]0.030897[/C][/ROW]
[ROW][C]29[/C][C]-0.223461[/C][C]-1.5482[/C][C]0.064073[/C][/ROW]
[ROW][C]30[/C][C]-0.187858[/C][C]-1.3015[/C][C]0.099647[/C][/ROW]
[ROW][C]31[/C][C]-0.188784[/C][C]-1.3079[/C][C]0.098563[/C][/ROW]
[ROW][C]32[/C][C]-0.199153[/C][C]-1.3798[/C][C]0.087025[/C][/ROW]
[ROW][C]33[/C][C]-0.177935[/C][C]-1.2328[/C][C]0.111833[/C][/ROW]
[ROW][C]34[/C][C]-0.177542[/C][C]-1.23[/C][C]0.112338[/C][/ROW]
[ROW][C]35[/C][C]-0.165853[/C][C]-1.1491[/C][C]0.128112[/C][/ROW]
[ROW][C]36[/C][C]-0.135376[/C][C]-0.9379[/C][C]0.176492[/C][/ROW]
[ROW][C]37[/C][C]-0.098431[/C][C]-0.682[/C][C]0.249274[/C][/ROW]
[ROW][C]38[/C][C]-0.093705[/C][C]-0.6492[/C][C]0.259649[/C][/ROW]
[ROW][C]39[/C][C]-0.107798[/C][C]-0.7468[/C][C]0.229399[/C][/ROW]
[ROW][C]40[/C][C]-0.099506[/C][C]-0.6894[/C][C]0.246945[/C][/ROW]
[ROW][C]41[/C][C]-0.092637[/C][C]-0.6418[/C][C]0.262025[/C][/ROW]
[ROW][C]42[/C][C]-0.087864[/C][C]-0.6087[/C][C]0.272783[/C][/ROW]
[ROW][C]43[/C][C]-0.079228[/C][C]-0.5489[/C][C]0.292807[/C][/ROW]
[ROW][C]44[/C][C]-0.04797[/C][C]-0.3323[/C][C]0.370538[/C][/ROW]
[ROW][C]45[/C][C]-0.027312[/C][C]-0.1892[/C][C]0.425358[/C][/ROW]
[ROW][C]46[/C][C]-0.018212[/C][C]-0.1262[/C][C]0.450061[/C][/ROW]
[ROW][C]47[/C][C]-0.004623[/C][C]-0.032[/C][C]0.48729[/C][/ROW]
[ROW][C]48[/C][C]NA[/C][C]NA[/C][C]NA[/C][/ROW]
[/TABLE]
Source: https://freestatistics.org/blog/index.php?pk=167753&T=1

Globally Unique Identifier (entire table): ba.freestatistics.org/blog/index.php?pk=167753&T=1

As an alternative you can also use a QR Code:  

The GUIDs for individual cells are displayed in the table below:

Autocorrelation Function
Time lag kACF(k)T-STATP-value
10.8460015.86130
20.63674.41122.9e-05
30.4810623.33290.000831
40.3838112.65910.005308
50.3204332.220.015587
60.3151472.18340.016963
70.3195842.21410.015801
80.2700641.87110.03372
90.2180981.5110.068669
100.1608821.11460.13528
110.1329680.92120.180768
120.100990.69970.243753
130.1271220.88070.191428
140.17271.19650.11869
150.1768291.22510.113256
160.086510.59940.275876
17-0.055802-0.38660.350378
18-0.181195-1.25540.107713
19-0.257788-1.7860.040208
20-0.254629-1.76410.042037
21-0.256471-1.77690.040962
22-0.247747-1.71640.046264
23-0.262966-1.82190.037353
24-0.297861-2.06360.022241
25-0.331995-2.30010.012916
26-0.321487-2.22730.015325
27-0.29167-2.02070.024452
28-0.276041-1.91250.030897
29-0.223461-1.54820.064073
30-0.187858-1.30150.099647
31-0.188784-1.30790.098563
32-0.199153-1.37980.087025
33-0.177935-1.23280.111833
34-0.177542-1.230.112338
35-0.165853-1.14910.128112
36-0.135376-0.93790.176492
37-0.098431-0.6820.249274
38-0.093705-0.64920.259649
39-0.107798-0.74680.229399
40-0.099506-0.68940.246945
41-0.092637-0.64180.262025
42-0.087864-0.60870.272783
43-0.079228-0.54890.292807
44-0.04797-0.33230.370538
45-0.027312-0.18920.425358
46-0.018212-0.12620.450061
47-0.004623-0.0320.48729
48NANANA


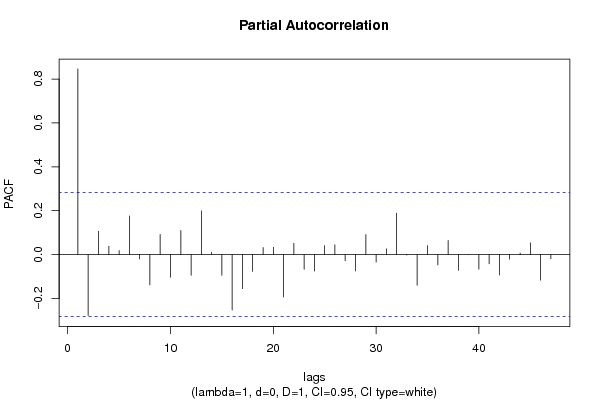
Partial Autocorrelation Function
Time lag kPACF(k)T-STATP-value
10.8460015.86130
2-0.277952-1.92570.030038
30.1061370.73530.232855
40.0376380.26080.397696
50.0180970.12540.450375
60.1757041.21730.114718
7-0.019798-0.13720.445736
8-0.13815-0.95710.171649
90.0917480.63560.264012
10-0.103219-0.71510.238998
110.1096840.75990.225512
12-0.094266-0.65310.258406
130.1991731.37990.087004
140.0099280.06880.472725
15-0.093874-0.65040.259274
16-0.252295-1.74790.043434
17-0.155322-1.07610.14363
18-0.076628-0.53090.298969
190.0316870.21950.413583
200.0334430.23170.408879
21-0.193354-1.33960.093343
220.0519550.360.360231
23-0.066586-0.46130.323327
24-0.074657-0.51720.303682
250.040260.27890.390749
260.0441980.30620.380384
27-0.027715-0.1920.42427
28-0.07438-0.51530.304347
290.0910450.63080.265589
30-0.034264-0.23740.406683
310.0261620.18130.428464
320.1884241.30540.098983
33-0.002106-0.01460.494208
34-0.139778-0.96840.168847
350.0410120.28410.388762
36-0.046946-0.32530.373201
370.0642170.44490.329192
38-0.071377-0.49450.3116
396e-0600.499983
40-0.066383-0.45990.323827
41-0.042094-0.29160.38591
42-0.09347-0.64760.260172
43-0.02089-0.14470.442765
440.006590.04570.481887
450.0534430.37030.356408
46-0.116371-0.80620.212041
47-0.019058-0.1320.447752
48NANANA

\begin{tabular}{lllllllll}
\hline
Partial Autocorrelation Function \tabularnewline
Time lag k & PACF(k) & T-STAT & P-value \tabularnewline
1 & 0.846001 & 5.8613 & 0 \tabularnewline
2 & -0.277952 & -1.9257 & 0.030038 \tabularnewline
3 & 0.106137 & 0.7353 & 0.232855 \tabularnewline
4 & 0.037638 & 0.2608 & 0.397696 \tabularnewline
5 & 0.018097 & 0.1254 & 0.450375 \tabularnewline
6 & 0.175704 & 1.2173 & 0.114718 \tabularnewline
7 & -0.019798 & -0.1372 & 0.445736 \tabularnewline
8 & -0.13815 & -0.9571 & 0.171649 \tabularnewline
9 & 0.091748 & 0.6356 & 0.264012 \tabularnewline
10 & -0.103219 & -0.7151 & 0.238998 \tabularnewline
11 & 0.109684 & 0.7599 & 0.225512 \tabularnewline
12 & -0.094266 & -0.6531 & 0.258406 \tabularnewline
13 & 0.199173 & 1.3799 & 0.087004 \tabularnewline
14 & 0.009928 & 0.0688 & 0.472725 \tabularnewline
15 & -0.093874 & -0.6504 & 0.259274 \tabularnewline
16 & -0.252295 & -1.7479 & 0.043434 \tabularnewline
17 & -0.155322 & -1.0761 & 0.14363 \tabularnewline
18 & -0.076628 & -0.5309 & 0.298969 \tabularnewline
19 & 0.031687 & 0.2195 & 0.413583 \tabularnewline
20 & 0.033443 & 0.2317 & 0.408879 \tabularnewline
21 & -0.193354 & -1.3396 & 0.093343 \tabularnewline
22 & 0.051955 & 0.36 & 0.360231 \tabularnewline
23 & -0.066586 & -0.4613 & 0.323327 \tabularnewline
24 & -0.074657 & -0.5172 & 0.303682 \tabularnewline
25 & 0.04026 & 0.2789 & 0.390749 \tabularnewline
26 & 0.044198 & 0.3062 & 0.380384 \tabularnewline
27 & -0.027715 & -0.192 & 0.42427 \tabularnewline
28 & -0.07438 & -0.5153 & 0.304347 \tabularnewline
29 & 0.091045 & 0.6308 & 0.265589 \tabularnewline
30 & -0.034264 & -0.2374 & 0.406683 \tabularnewline
31 & 0.026162 & 0.1813 & 0.428464 \tabularnewline
32 & 0.188424 & 1.3054 & 0.098983 \tabularnewline
33 & -0.002106 & -0.0146 & 0.494208 \tabularnewline
34 & -0.139778 & -0.9684 & 0.168847 \tabularnewline
35 & 0.041012 & 0.2841 & 0.388762 \tabularnewline
36 & -0.046946 & -0.3253 & 0.373201 \tabularnewline
37 & 0.064217 & 0.4449 & 0.329192 \tabularnewline
38 & -0.071377 & -0.4945 & 0.3116 \tabularnewline
39 & 6e-06 & 0 & 0.499983 \tabularnewline
40 & -0.066383 & -0.4599 & 0.323827 \tabularnewline
41 & -0.042094 & -0.2916 & 0.38591 \tabularnewline
42 & -0.09347 & -0.6476 & 0.260172 \tabularnewline
43 & -0.02089 & -0.1447 & 0.442765 \tabularnewline
44 & 0.00659 & 0.0457 & 0.481887 \tabularnewline
45 & 0.053443 & 0.3703 & 0.356408 \tabularnewline
46 & -0.116371 & -0.8062 & 0.212041 \tabularnewline
47 & -0.019058 & -0.132 & 0.447752 \tabularnewline
48 & NA & NA & NA \tabularnewline
\hline
\end{tabular}
%Source: https://freestatistics.org/blog/index.php?pk=167753&T=2

[TABLE]
[ROW][C]Partial Autocorrelation Function[/C][/ROW]
[ROW][C]Time lag k[/C][C]PACF(k)[/C][C]T-STAT[/C][C]P-value[/C][/ROW]
[ROW][C]1[/C][C]0.846001[/C][C]5.8613[/C][C]0[/C][/ROW]
[ROW][C]2[/C][C]-0.277952[/C][C]-1.9257[/C][C]0.030038[/C][/ROW]
[ROW][C]3[/C][C]0.106137[/C][C]0.7353[/C][C]0.232855[/C][/ROW]
[ROW][C]4[/C][C]0.037638[/C][C]0.2608[/C][C]0.397696[/C][/ROW]
[ROW][C]5[/C][C]0.018097[/C][C]0.1254[/C][C]0.450375[/C][/ROW]
[ROW][C]6[/C][C]0.175704[/C][C]1.2173[/C][C]0.114718[/C][/ROW]
[ROW][C]7[/C][C]-0.019798[/C][C]-0.1372[/C][C]0.445736[/C][/ROW]
[ROW][C]8[/C][C]-0.13815[/C][C]-0.9571[/C][C]0.171649[/C][/ROW]
[ROW][C]9[/C][C]0.091748[/C][C]0.6356[/C][C]0.264012[/C][/ROW]
[ROW][C]10[/C][C]-0.103219[/C][C]-0.7151[/C][C]0.238998[/C][/ROW]
[ROW][C]11[/C][C]0.109684[/C][C]0.7599[/C][C]0.225512[/C][/ROW]
[ROW][C]12[/C][C]-0.094266[/C][C]-0.6531[/C][C]0.258406[/C][/ROW]
[ROW][C]13[/C][C]0.199173[/C][C]1.3799[/C][C]0.087004[/C][/ROW]
[ROW][C]14[/C][C]0.009928[/C][C]0.0688[/C][C]0.472725[/C][/ROW]
[ROW][C]15[/C][C]-0.093874[/C][C]-0.6504[/C][C]0.259274[/C][/ROW]
[ROW][C]16[/C][C]-0.252295[/C][C]-1.7479[/C][C]0.043434[/C][/ROW]
[ROW][C]17[/C][C]-0.155322[/C][C]-1.0761[/C][C]0.14363[/C][/ROW]
[ROW][C]18[/C][C]-0.076628[/C][C]-0.5309[/C][C]0.298969[/C][/ROW]
[ROW][C]19[/C][C]0.031687[/C][C]0.2195[/C][C]0.413583[/C][/ROW]
[ROW][C]20[/C][C]0.033443[/C][C]0.2317[/C][C]0.408879[/C][/ROW]
[ROW][C]21[/C][C]-0.193354[/C][C]-1.3396[/C][C]0.093343[/C][/ROW]
[ROW][C]22[/C][C]0.051955[/C][C]0.36[/C][C]0.360231[/C][/ROW]
[ROW][C]23[/C][C]-0.066586[/C][C]-0.4613[/C][C]0.323327[/C][/ROW]
[ROW][C]24[/C][C]-0.074657[/C][C]-0.5172[/C][C]0.303682[/C][/ROW]
[ROW][C]25[/C][C]0.04026[/C][C]0.2789[/C][C]0.390749[/C][/ROW]
[ROW][C]26[/C][C]0.044198[/C][C]0.3062[/C][C]0.380384[/C][/ROW]
[ROW][C]27[/C][C]-0.027715[/C][C]-0.192[/C][C]0.42427[/C][/ROW]
[ROW][C]28[/C][C]-0.07438[/C][C]-0.5153[/C][C]0.304347[/C][/ROW]
[ROW][C]29[/C][C]0.091045[/C][C]0.6308[/C][C]0.265589[/C][/ROW]
[ROW][C]30[/C][C]-0.034264[/C][C]-0.2374[/C][C]0.406683[/C][/ROW]
[ROW][C]31[/C][C]0.026162[/C][C]0.1813[/C][C]0.428464[/C][/ROW]
[ROW][C]32[/C][C]0.188424[/C][C]1.3054[/C][C]0.098983[/C][/ROW]
[ROW][C]33[/C][C]-0.002106[/C][C]-0.0146[/C][C]0.494208[/C][/ROW]
[ROW][C]34[/C][C]-0.139778[/C][C]-0.9684[/C][C]0.168847[/C][/ROW]
[ROW][C]35[/C][C]0.041012[/C][C]0.2841[/C][C]0.388762[/C][/ROW]
[ROW][C]36[/C][C]-0.046946[/C][C]-0.3253[/C][C]0.373201[/C][/ROW]
[ROW][C]37[/C][C]0.064217[/C][C]0.4449[/C][C]0.329192[/C][/ROW]
[ROW][C]38[/C][C]-0.071377[/C][C]-0.4945[/C][C]0.3116[/C][/ROW]
[ROW][C]39[/C][C]6e-06[/C][C]0[/C][C]0.499983[/C][/ROW]
[ROW][C]40[/C][C]-0.066383[/C][C]-0.4599[/C][C]0.323827[/C][/ROW]
[ROW][C]41[/C][C]-0.042094[/C][C]-0.2916[/C][C]0.38591[/C][/ROW]
[ROW][C]42[/C][C]-0.09347[/C][C]-0.6476[/C][C]0.260172[/C][/ROW]
[ROW][C]43[/C][C]-0.02089[/C][C]-0.1447[/C][C]0.442765[/C][/ROW]
[ROW][C]44[/C][C]0.00659[/C][C]0.0457[/C][C]0.481887[/C][/ROW]
[ROW][C]45[/C][C]0.053443[/C][C]0.3703[/C][C]0.356408[/C][/ROW]
[ROW][C]46[/C][C]-0.116371[/C][C]-0.8062[/C][C]0.212041[/C][/ROW]
[ROW][C]47[/C][C]-0.019058[/C][C]-0.132[/C][C]0.447752[/C][/ROW]
[ROW][C]48[/C][C]NA[/C][C]NA[/C][C]NA[/C][/ROW]
[/TABLE]
Source: https://freestatistics.org/blog/index.php?pk=167753&T=2

Globally Unique Identifier (entire table): ba.freestatistics.org/blog/index.php?pk=167753&T=2

As an alternative you can also use a QR Code:  

The GUIDs for individual cells are displayed in the table below:

Partial Autocorrelation Function
Time lag kPACF(k)T-STATP-value
10.8460015.86130
2-0.277952-1.92570.030038
30.1061370.73530.232855
40.0376380.26080.397696
50.0180970.12540.450375
60.1757041.21730.114718
7-0.019798-0.13720.445736
8-0.13815-0.95710.171649
90.0917480.63560.264012
10-0.103219-0.71510.238998
110.1096840.75990.225512
12-0.094266-0.65310.258406
130.1991731.37990.087004
140.0099280.06880.472725
15-0.093874-0.65040.259274
16-0.252295-1.74790.043434
17-0.155322-1.07610.14363
18-0.076628-0.53090.298969
190.0316870.21950.413583
200.0334430.23170.408879
21-0.193354-1.33960.093343
220.0519550.360.360231
23-0.066586-0.46130.323327
24-0.074657-0.51720.303682
250.040260.27890.390749
260.0441980.30620.380384
27-0.027715-0.1920.42427
28-0.07438-0.51530.304347
290.0910450.63080.265589
30-0.034264-0.23740.406683
310.0261620.18130.428464
320.1884241.30540.098983
33-0.002106-0.01460.494208
34-0.139778-0.96840.168847
350.0410120.28410.388762
36-0.046946-0.32530.373201
370.0642170.44490.329192
38-0.071377-0.49450.3116
396e-0600.499983
40-0.066383-0.45990.323827
41-0.042094-0.29160.38591
42-0.09347-0.64760.260172
43-0.02089-0.14470.442765
440.006590.04570.481887
450.0534430.37030.356408
46-0.116371-0.80620.212041
47-0.019058-0.1320.447752
48NANANA


Parameters (Session):
par1 = 48 ; par2 = 1 ; par3 = 0 ; par4 = 0 ; par5 = 12 ; par6 = White Noise ; par7 = 0.95 ;
Parameters (R input):
par1 = 48 ; par2 = 1 ; par3 = 0 ; par4 = 1 ; par5 = 12 ; par6 = White Noise ; par7 = 0.95 ; par8 = ;
R code (references can be found in the software module):
if (par1 == 'Default') {
par1 = 10*log10(length(x))
} else {
par1 <- as.numeric(par1)
}
par2 <- as.numeric(par2)
par3 <- as.numeric(par3)
par4 <- as.numeric(par4)
par5 <- as.numeric(par5)
if (par6 == 'White Noise') par6 <- 'white' else par6 <- 'ma'
par7 <- as.numeric(par7)
if (par8 != '') par8 <- as.numeric(par8)
ox <- x
if (par8 == '') {
if (par2 == 0) {
x <- log(x)
} else {
x <- (x ^ par2 - 1) / par2
}
} else {
x <- log(x,base=par8)
}
if (par3 > 0) x <- diff(x,lag=1,difference=par3)
if (par4 > 0) x <- diff(x,lag=par5,difference=par4)
bitmap(file='picts.png')
op <- par(mfrow=c(2,1))
plot(ox,type='l',main='Original Time Series',xlab='time',ylab='value')
if (par8=='') {
mytitle <- paste('Working Time Series (lambda=',par2,', d=',par3,', D=',par4,')',sep='')
mysub <- paste('(lambda=',par2,', d=',par3,', D=',par4,', CI=', par7, ', CI type=',par6,')',sep='')
} else {
mytitle <- paste('Working Time Series (base=',par8,', d=',par3,', D=',par4,')',sep='')
mysub <- paste('(base=',par8,', d=',par3,', D=',par4,', CI=', par7, ', CI type=',par6,')',sep='')
}
plot(x,type='l', main=mytitle,xlab='time',ylab='value')
par(op)
dev.off()
bitmap(file='pic1.png')
racf <- acf(x, par1, main='Autocorrelation', xlab='time lag', ylab='ACF', ci.type=par6, ci=par7, sub=mysub)
dev.off()
bitmap(file='pic2.png')
rpacf <- pacf(x,par1,main='Partial Autocorrelation',xlab='lags',ylab='PACF',sub=mysub)
dev.off()
(myacf <- c(racf$acf))
(mypacf <- c(rpacf$acf))
lengthx <- length(x)
sqrtn <- sqrt(lengthx)
load(file='createtable')
a<-table.start()
a<-table.row.start(a)
a<-table.element(a,'Autocorrelation Function',4,TRUE)
a<-table.row.end(a)
a<-table.row.start(a)
a<-table.element(a,'Time lag k',header=TRUE)
a<-table.element(a,hyperlink('basics.htm','ACF(k)','click here for more information about the Autocorrelation Function'),header=TRUE)
a<-table.element(a,'T-STAT',header=TRUE)
a<-table.element(a,'P-value',header=TRUE)
a<-table.row.end(a)
for (i in 2:(par1+1)) {
a<-table.row.start(a)
a<-table.element(a,i-1,header=TRUE)
a<-table.element(a,round(myacf[i],6))
mytstat <- myacf[i]*sqrtn
a<-table.element(a,round(mytstat,4))
a<-table.element(a,round(1-pt(abs(mytstat),lengthx),6))
a<-table.row.end(a)
}
a<-table.end(a)
table.save(a,file='mytable.tab')
a<-table.start()
a<-table.row.start(a)
a<-table.element(a,'Partial Autocorrelation Function',4,TRUE)
a<-table.row.end(a)
a<-table.row.start(a)
a<-table.element(a,'Time lag k',header=TRUE)
a<-table.element(a,hyperlink('basics.htm','PACF(k)','click here for more information about the Partial Autocorrelation Function'),header=TRUE)
a<-table.element(a,'T-STAT',header=TRUE)
a<-table.element(a,'P-value',header=TRUE)
a<-table.row.end(a)
for (i in 1:par1) {
a<-table.row.start(a)
a<-table.element(a,i,header=TRUE)
a<-table.element(a,round(mypacf[i],6))
mytstat <- mypacf[i]*sqrtn
a<-table.element(a,round(mytstat,4))
a<-table.element(a,round(1-pt(abs(mytstat),lengthx),6))
a<-table.row.end(a)
}
a<-table.end(a)
table.save(a,file='mytable1.tab')