Free Statistics

of Irreproducible Research!

Author's title

Author*Unverified author*
R Software Modulerwasp_autocorrelation.wasp
Title produced by software(Partial) Autocorrelation Function
Date of computationSun, 27 May 2012 13:19:19 -0400
Cite this page as followsStatistical Computations at FreeStatistics.org, Office for Research Development and Education, URL https://freestatistics.org/blog/index.php?v=date/2012/May/27/t1338139229975c94uszia6jhc.htm/, Retrieved Thu, 09 May 2024 00:02:06 +0000
Statistical Computations at FreeStatistics.org, Office for Research Development and Education, URL https://freestatistics.org/blog/index.php?pk=167726, Retrieved Thu, 09 May 2024 00:02:06 +0000
QR Codes:

Original text written by user:
IsPrivate?No (this computation is public)
User-defined keywordsKDGP2W12
Estimated Impact143
Family? (F = Feedback message, R = changed R code, M = changed R Module, P = changed Parameters, D = changed Data)
-     [Harrell-Davis Quantiles] [Decielen Inschrij...] [2012-05-27 12:00:49] [10e562ecd6dbeeb8097ec4a918c2660c]
- R P   [Harrell-Davis Quantiles] [quantielen inschr...] [2012-05-27 12:05:10] [10e562ecd6dbeeb8097ec4a918c2660c]
-    D    [Harrell-Davis Quantiles] [Quantielen aantal...] [2012-05-27 12:13:06] [10e562ecd6dbeeb8097ec4a918c2660c]
- RMP         [(Partial) Autocorrelation Function] [Autocorrelatie aa...] [2012-05-27 17:19:19] [e46afc21a91140cf7fea495f009879eb] [Current]
Feedback Forum

Post a new message
Dataseries X:
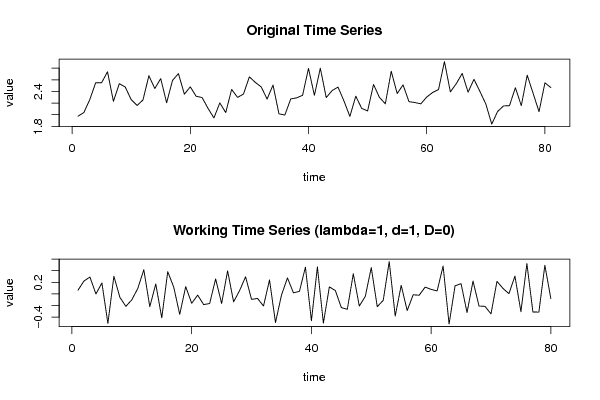
1.974
2.037
2.259
2.550
2.549
2.738
2.228
2.533
2.475
2.260
2.158
2.253
2.670
2.449
2.620
2.205
2.589
2.706
2.352
2.478
2.316
2.295
2.110
1.944
2.202
2.036
2.434
2.297
2.354
2.650
2.555
2.477
2.268
2.510
2.015
1.994
2.271
2.289
2.333
2.795
2.332
2.799
2.294
2.415
2.473
2.236
1.970
2.318
2.108
2.064
2.519
2.298
2.187
2.746
2.364
2.512
2.224
2.209
2.186
2.303
2.381
2.432
2.913
2.392
2.532
2.709
2.387
2.609
2.399
2.184
1.839
2.056
2.151
2.155
2.463
2.155
2.679
2.367
2.052
2.547
2.466


Summary of computational transaction
Raw Inputview raw input (R code)
Raw Outputview raw output of R engine
Computing time2 seconds
R Server'Herman Ole Andreas Wold' @ wold.wessa.net

\begin{tabular}{lllllllll}
\hline
Summary of computational transaction \tabularnewline
Raw Input & view raw input (R code)  \tabularnewline
Raw Output & view raw output of R engine  \tabularnewline
Computing time & 2 seconds \tabularnewline
R Server & 'Herman Ole Andreas Wold' @ wold.wessa.net \tabularnewline
\hline
\end{tabular}
%Source: https://freestatistics.org/blog/index.php?pk=167726&T=0

[TABLE]
[ROW][C]Summary of computational transaction[/C][/ROW]
[ROW][C]Raw Input[/C][C]view raw input (R code) [/C][/ROW]
[ROW][C]Raw Output[/C][C]view raw output of R engine [/C][/ROW]
[ROW][C]Computing time[/C][C]2 seconds[/C][/ROW]
[ROW][C]R Server[/C][C]'Herman Ole Andreas Wold' @ wold.wessa.net[/C][/ROW]
[/TABLE]
Source: https://freestatistics.org/blog/index.php?pk=167726&T=0

Globally Unique Identifier (entire table): ba.freestatistics.org/blog/index.php?pk=167726&T=0

As an alternative you can also use a QR Code:  

The GUIDs for individual cells are displayed in the table below:

Summary of computational transaction
Raw Inputview raw input (R code)
Raw Outputview raw output of R engine
Computing time2 seconds
R Server'Herman Ole Andreas Wold' @ wold.wessa.net


Autocorrelation Function
Time lag kACF(k)T-STATP-value
1-0.492936-4.4091.6e-05
20.0883930.79060.215755
30.1322921.18330.120106
4-0.199396-1.78340.039153
50.0625910.55980.288579
6-0.109401-0.97850.165386
7-0.00659-0.05890.476574
8-0.117842-1.0540.147525
90.1860571.66410.049998
10-0.080693-0.72170.236279
11-0.125227-1.12010.133018
120.4045733.61860.000259
13-0.349278-3.1240.001242
140.2908692.60160.005526
150.0007070.00630.497484
16-0.243226-2.17550.016273
170.1483441.32680.094171
18-0.116758-1.04430.149743
19-0.013663-0.12220.45152
20-0.128501-1.14940.126918
210.170521.52520.06558
22-0.085117-0.76130.224355
230.0388890.34780.364439
240.1482791.32620.094266
25-0.115811-1.03580.151698
260.1431771.28060.102015
27-0.015103-0.13510.446441
28-0.125914-1.12620.131721
290.139031.24350.108654
30-0.168321-1.50550.068066
31-0.008005-0.07160.471549
32-0.01206-0.10790.457184
330.0227930.20390.419486
34-0.006726-0.06020.476089
35-0.010098-0.09030.464128
360.1887811.68850.047604
37-0.125796-1.12520.131944
380.1066350.95380.171536
39-0.069234-0.61920.268756
40-0.04618-0.4130.340339
410.0476830.42650.335449
42-0.128345-1.1480.127205
430.1340481.1990.117042
44-0.15582-1.39370.083635
450.0499980.44720.32797
460.0612920.54820.292536
47-0.093395-0.83540.203004
480.1861011.66450.049959

\begin{tabular}{lllllllll}
\hline
Autocorrelation Function \tabularnewline
Time lag k & ACF(k) & T-STAT & P-value \tabularnewline
1 & -0.492936 & -4.409 & 1.6e-05 \tabularnewline
2 & 0.088393 & 0.7906 & 0.215755 \tabularnewline
3 & 0.132292 & 1.1833 & 0.120106 \tabularnewline
4 & -0.199396 & -1.7834 & 0.039153 \tabularnewline
5 & 0.062591 & 0.5598 & 0.288579 \tabularnewline
6 & -0.109401 & -0.9785 & 0.165386 \tabularnewline
7 & -0.00659 & -0.0589 & 0.476574 \tabularnewline
8 & -0.117842 & -1.054 & 0.147525 \tabularnewline
9 & 0.186057 & 1.6641 & 0.049998 \tabularnewline
10 & -0.080693 & -0.7217 & 0.236279 \tabularnewline
11 & -0.125227 & -1.1201 & 0.133018 \tabularnewline
12 & 0.404573 & 3.6186 & 0.000259 \tabularnewline
13 & -0.349278 & -3.124 & 0.001242 \tabularnewline
14 & 0.290869 & 2.6016 & 0.005526 \tabularnewline
15 & 0.000707 & 0.0063 & 0.497484 \tabularnewline
16 & -0.243226 & -2.1755 & 0.016273 \tabularnewline
17 & 0.148344 & 1.3268 & 0.094171 \tabularnewline
18 & -0.116758 & -1.0443 & 0.149743 \tabularnewline
19 & -0.013663 & -0.1222 & 0.45152 \tabularnewline
20 & -0.128501 & -1.1494 & 0.126918 \tabularnewline
21 & 0.17052 & 1.5252 & 0.06558 \tabularnewline
22 & -0.085117 & -0.7613 & 0.224355 \tabularnewline
23 & 0.038889 & 0.3478 & 0.364439 \tabularnewline
24 & 0.148279 & 1.3262 & 0.094266 \tabularnewline
25 & -0.115811 & -1.0358 & 0.151698 \tabularnewline
26 & 0.143177 & 1.2806 & 0.102015 \tabularnewline
27 & -0.015103 & -0.1351 & 0.446441 \tabularnewline
28 & -0.125914 & -1.1262 & 0.131721 \tabularnewline
29 & 0.13903 & 1.2435 & 0.108654 \tabularnewline
30 & -0.168321 & -1.5055 & 0.068066 \tabularnewline
31 & -0.008005 & -0.0716 & 0.471549 \tabularnewline
32 & -0.01206 & -0.1079 & 0.457184 \tabularnewline
33 & 0.022793 & 0.2039 & 0.419486 \tabularnewline
34 & -0.006726 & -0.0602 & 0.476089 \tabularnewline
35 & -0.010098 & -0.0903 & 0.464128 \tabularnewline
36 & 0.188781 & 1.6885 & 0.047604 \tabularnewline
37 & -0.125796 & -1.1252 & 0.131944 \tabularnewline
38 & 0.106635 & 0.9538 & 0.171536 \tabularnewline
39 & -0.069234 & -0.6192 & 0.268756 \tabularnewline
40 & -0.04618 & -0.413 & 0.340339 \tabularnewline
41 & 0.047683 & 0.4265 & 0.335449 \tabularnewline
42 & -0.128345 & -1.148 & 0.127205 \tabularnewline
43 & 0.134048 & 1.199 & 0.117042 \tabularnewline
44 & -0.15582 & -1.3937 & 0.083635 \tabularnewline
45 & 0.049998 & 0.4472 & 0.32797 \tabularnewline
46 & 0.061292 & 0.5482 & 0.292536 \tabularnewline
47 & -0.093395 & -0.8354 & 0.203004 \tabularnewline
48 & 0.186101 & 1.6645 & 0.049959 \tabularnewline
\hline
\end{tabular}
%Source: https://freestatistics.org/blog/index.php?pk=167726&T=1

[TABLE]
[ROW][C]Autocorrelation Function[/C][/ROW]
[ROW][C]Time lag k[/C][C]ACF(k)[/C][C]T-STAT[/C][C]P-value[/C][/ROW]
[ROW][C]1[/C][C]-0.492936[/C][C]-4.409[/C][C]1.6e-05[/C][/ROW]
[ROW][C]2[/C][C]0.088393[/C][C]0.7906[/C][C]0.215755[/C][/ROW]
[ROW][C]3[/C][C]0.132292[/C][C]1.1833[/C][C]0.120106[/C][/ROW]
[ROW][C]4[/C][C]-0.199396[/C][C]-1.7834[/C][C]0.039153[/C][/ROW]
[ROW][C]5[/C][C]0.062591[/C][C]0.5598[/C][C]0.288579[/C][/ROW]
[ROW][C]6[/C][C]-0.109401[/C][C]-0.9785[/C][C]0.165386[/C][/ROW]
[ROW][C]7[/C][C]-0.00659[/C][C]-0.0589[/C][C]0.476574[/C][/ROW]
[ROW][C]8[/C][C]-0.117842[/C][C]-1.054[/C][C]0.147525[/C][/ROW]
[ROW][C]9[/C][C]0.186057[/C][C]1.6641[/C][C]0.049998[/C][/ROW]
[ROW][C]10[/C][C]-0.080693[/C][C]-0.7217[/C][C]0.236279[/C][/ROW]
[ROW][C]11[/C][C]-0.125227[/C][C]-1.1201[/C][C]0.133018[/C][/ROW]
[ROW][C]12[/C][C]0.404573[/C][C]3.6186[/C][C]0.000259[/C][/ROW]
[ROW][C]13[/C][C]-0.349278[/C][C]-3.124[/C][C]0.001242[/C][/ROW]
[ROW][C]14[/C][C]0.290869[/C][C]2.6016[/C][C]0.005526[/C][/ROW]
[ROW][C]15[/C][C]0.000707[/C][C]0.0063[/C][C]0.497484[/C][/ROW]
[ROW][C]16[/C][C]-0.243226[/C][C]-2.1755[/C][C]0.016273[/C][/ROW]
[ROW][C]17[/C][C]0.148344[/C][C]1.3268[/C][C]0.094171[/C][/ROW]
[ROW][C]18[/C][C]-0.116758[/C][C]-1.0443[/C][C]0.149743[/C][/ROW]
[ROW][C]19[/C][C]-0.013663[/C][C]-0.1222[/C][C]0.45152[/C][/ROW]
[ROW][C]20[/C][C]-0.128501[/C][C]-1.1494[/C][C]0.126918[/C][/ROW]
[ROW][C]21[/C][C]0.17052[/C][C]1.5252[/C][C]0.06558[/C][/ROW]
[ROW][C]22[/C][C]-0.085117[/C][C]-0.7613[/C][C]0.224355[/C][/ROW]
[ROW][C]23[/C][C]0.038889[/C][C]0.3478[/C][C]0.364439[/C][/ROW]
[ROW][C]24[/C][C]0.148279[/C][C]1.3262[/C][C]0.094266[/C][/ROW]
[ROW][C]25[/C][C]-0.115811[/C][C]-1.0358[/C][C]0.151698[/C][/ROW]
[ROW][C]26[/C][C]0.143177[/C][C]1.2806[/C][C]0.102015[/C][/ROW]
[ROW][C]27[/C][C]-0.015103[/C][C]-0.1351[/C][C]0.446441[/C][/ROW]
[ROW][C]28[/C][C]-0.125914[/C][C]-1.1262[/C][C]0.131721[/C][/ROW]
[ROW][C]29[/C][C]0.13903[/C][C]1.2435[/C][C]0.108654[/C][/ROW]
[ROW][C]30[/C][C]-0.168321[/C][C]-1.5055[/C][C]0.068066[/C][/ROW]
[ROW][C]31[/C][C]-0.008005[/C][C]-0.0716[/C][C]0.471549[/C][/ROW]
[ROW][C]32[/C][C]-0.01206[/C][C]-0.1079[/C][C]0.457184[/C][/ROW]
[ROW][C]33[/C][C]0.022793[/C][C]0.2039[/C][C]0.419486[/C][/ROW]
[ROW][C]34[/C][C]-0.006726[/C][C]-0.0602[/C][C]0.476089[/C][/ROW]
[ROW][C]35[/C][C]-0.010098[/C][C]-0.0903[/C][C]0.464128[/C][/ROW]
[ROW][C]36[/C][C]0.188781[/C][C]1.6885[/C][C]0.047604[/C][/ROW]
[ROW][C]37[/C][C]-0.125796[/C][C]-1.1252[/C][C]0.131944[/C][/ROW]
[ROW][C]38[/C][C]0.106635[/C][C]0.9538[/C][C]0.171536[/C][/ROW]
[ROW][C]39[/C][C]-0.069234[/C][C]-0.6192[/C][C]0.268756[/C][/ROW]
[ROW][C]40[/C][C]-0.04618[/C][C]-0.413[/C][C]0.340339[/C][/ROW]
[ROW][C]41[/C][C]0.047683[/C][C]0.4265[/C][C]0.335449[/C][/ROW]
[ROW][C]42[/C][C]-0.128345[/C][C]-1.148[/C][C]0.127205[/C][/ROW]
[ROW][C]43[/C][C]0.134048[/C][C]1.199[/C][C]0.117042[/C][/ROW]
[ROW][C]44[/C][C]-0.15582[/C][C]-1.3937[/C][C]0.083635[/C][/ROW]
[ROW][C]45[/C][C]0.049998[/C][C]0.4472[/C][C]0.32797[/C][/ROW]
[ROW][C]46[/C][C]0.061292[/C][C]0.5482[/C][C]0.292536[/C][/ROW]
[ROW][C]47[/C][C]-0.093395[/C][C]-0.8354[/C][C]0.203004[/C][/ROW]
[ROW][C]48[/C][C]0.186101[/C][C]1.6645[/C][C]0.049959[/C][/ROW]
[/TABLE]
Source: https://freestatistics.org/blog/index.php?pk=167726&T=1

Globally Unique Identifier (entire table): ba.freestatistics.org/blog/index.php?pk=167726&T=1

As an alternative you can also use a QR Code:  

The GUIDs for individual cells are displayed in the table below:

Autocorrelation Function
Time lag kACF(k)T-STATP-value
1-0.492936-4.4091.6e-05
20.0883930.79060.215755
30.1322921.18330.120106
4-0.199396-1.78340.039153
50.0625910.55980.288579
6-0.109401-0.97850.165386
7-0.00659-0.05890.476574
8-0.117842-1.0540.147525
90.1860571.66410.049998
10-0.080693-0.72170.236279
11-0.125227-1.12010.133018
120.4045733.61860.000259
13-0.349278-3.1240.001242
140.2908692.60160.005526
150.0007070.00630.497484
16-0.243226-2.17550.016273
170.1483441.32680.094171
18-0.116758-1.04430.149743
19-0.013663-0.12220.45152
20-0.128501-1.14940.126918
210.170521.52520.06558
22-0.085117-0.76130.224355
230.0388890.34780.364439
240.1482791.32620.094266
25-0.115811-1.03580.151698
260.1431771.28060.102015
27-0.015103-0.13510.446441
28-0.125914-1.12620.131721
290.139031.24350.108654
30-0.168321-1.50550.068066
31-0.008005-0.07160.471549
32-0.01206-0.10790.457184
330.0227930.20390.419486
34-0.006726-0.06020.476089
35-0.010098-0.09030.464128
360.1887811.68850.047604
37-0.125796-1.12520.131944
380.1066350.95380.171536
39-0.069234-0.61920.268756
40-0.04618-0.4130.340339
410.0476830.42650.335449
42-0.128345-1.1480.127205
430.1340481.1990.117042
44-0.15582-1.39370.083635
450.0499980.44720.32797
460.0612920.54820.292536
47-0.093395-0.83540.203004
480.1861011.66450.049959


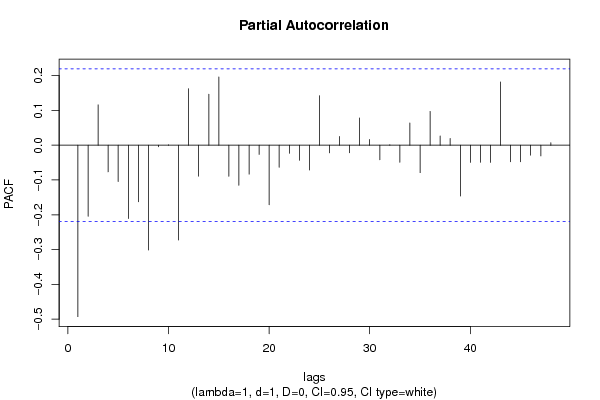
Partial Autocorrelation Function
Time lag kPACF(k)T-STATP-value
1-0.492936-4.4091.6e-05
2-0.204215-1.82660.035748
30.1159251.03690.151462
4-0.07669-0.68590.247368
5-0.104258-0.93250.176939
6-0.210783-1.88530.03151
7-0.162666-1.45490.074801
8-0.301174-2.69380.004302
9-0.004775-0.04270.483019
100.0009620.00860.496578
11-0.272535-2.43760.008501
120.162121.450.075478
13-0.089016-0.79620.21414
140.1464641.310.09697
150.1958471.75170.041828
16-0.089525-0.80070.212829
17-0.115056-1.02910.153269
18-0.08327-0.74480.229291
19-0.026555-0.23750.406434
20-0.171238-1.53160.064783
21-0.063551-0.56840.285672
22-0.023032-0.2060.418656
23-0.043288-0.38720.349826
24-0.071326-0.6380.26266
250.1421351.27130.103654
26-0.022048-0.19720.422084
270.0248340.22210.412392
28-0.021834-0.19530.422832
290.0779670.69740.243801
300.0165650.14820.441294
31-0.041905-0.37480.354397
320.0013790.01230.495094
33-0.049258-0.44060.330355
340.0635890.56880.285558
35-0.078943-0.70610.241091
360.0970810.86830.193908
370.0265940.23790.406296
380.0194420.17390.431196
39-0.146354-1.3090.097137
40-0.049366-0.44150.330005
41-0.04894-0.43770.331379
42-0.04943-0.44210.329799
430.1817951.6260.053939
44-0.047555-0.42530.335865
45-0.047682-0.42650.33545
46-0.028648-0.25620.399215
47-0.030813-0.27560.391782
480.0071210.06370.474688

\begin{tabular}{lllllllll}
\hline
Partial Autocorrelation Function \tabularnewline
Time lag k & PACF(k) & T-STAT & P-value \tabularnewline
1 & -0.492936 & -4.409 & 1.6e-05 \tabularnewline
2 & -0.204215 & -1.8266 & 0.035748 \tabularnewline
3 & 0.115925 & 1.0369 & 0.151462 \tabularnewline
4 & -0.07669 & -0.6859 & 0.247368 \tabularnewline
5 & -0.104258 & -0.9325 & 0.176939 \tabularnewline
6 & -0.210783 & -1.8853 & 0.03151 \tabularnewline
7 & -0.162666 & -1.4549 & 0.074801 \tabularnewline
8 & -0.301174 & -2.6938 & 0.004302 \tabularnewline
9 & -0.004775 & -0.0427 & 0.483019 \tabularnewline
10 & 0.000962 & 0.0086 & 0.496578 \tabularnewline
11 & -0.272535 & -2.4376 & 0.008501 \tabularnewline
12 & 0.16212 & 1.45 & 0.075478 \tabularnewline
13 & -0.089016 & -0.7962 & 0.21414 \tabularnewline
14 & 0.146464 & 1.31 & 0.09697 \tabularnewline
15 & 0.195847 & 1.7517 & 0.041828 \tabularnewline
16 & -0.089525 & -0.8007 & 0.212829 \tabularnewline
17 & -0.115056 & -1.0291 & 0.153269 \tabularnewline
18 & -0.08327 & -0.7448 & 0.229291 \tabularnewline
19 & -0.026555 & -0.2375 & 0.406434 \tabularnewline
20 & -0.171238 & -1.5316 & 0.064783 \tabularnewline
21 & -0.063551 & -0.5684 & 0.285672 \tabularnewline
22 & -0.023032 & -0.206 & 0.418656 \tabularnewline
23 & -0.043288 & -0.3872 & 0.349826 \tabularnewline
24 & -0.071326 & -0.638 & 0.26266 \tabularnewline
25 & 0.142135 & 1.2713 & 0.103654 \tabularnewline
26 & -0.022048 & -0.1972 & 0.422084 \tabularnewline
27 & 0.024834 & 0.2221 & 0.412392 \tabularnewline
28 & -0.021834 & -0.1953 & 0.422832 \tabularnewline
29 & 0.077967 & 0.6974 & 0.243801 \tabularnewline
30 & 0.016565 & 0.1482 & 0.441294 \tabularnewline
31 & -0.041905 & -0.3748 & 0.354397 \tabularnewline
32 & 0.001379 & 0.0123 & 0.495094 \tabularnewline
33 & -0.049258 & -0.4406 & 0.330355 \tabularnewline
34 & 0.063589 & 0.5688 & 0.285558 \tabularnewline
35 & -0.078943 & -0.7061 & 0.241091 \tabularnewline
36 & 0.097081 & 0.8683 & 0.193908 \tabularnewline
37 & 0.026594 & 0.2379 & 0.406296 \tabularnewline
38 & 0.019442 & 0.1739 & 0.431196 \tabularnewline
39 & -0.146354 & -1.309 & 0.097137 \tabularnewline
40 & -0.049366 & -0.4415 & 0.330005 \tabularnewline
41 & -0.04894 & -0.4377 & 0.331379 \tabularnewline
42 & -0.04943 & -0.4421 & 0.329799 \tabularnewline
43 & 0.181795 & 1.626 & 0.053939 \tabularnewline
44 & -0.047555 & -0.4253 & 0.335865 \tabularnewline
45 & -0.047682 & -0.4265 & 0.33545 \tabularnewline
46 & -0.028648 & -0.2562 & 0.399215 \tabularnewline
47 & -0.030813 & -0.2756 & 0.391782 \tabularnewline
48 & 0.007121 & 0.0637 & 0.474688 \tabularnewline
\hline
\end{tabular}
%Source: https://freestatistics.org/blog/index.php?pk=167726&T=2

[TABLE]
[ROW][C]Partial Autocorrelation Function[/C][/ROW]
[ROW][C]Time lag k[/C][C]PACF(k)[/C][C]T-STAT[/C][C]P-value[/C][/ROW]
[ROW][C]1[/C][C]-0.492936[/C][C]-4.409[/C][C]1.6e-05[/C][/ROW]
[ROW][C]2[/C][C]-0.204215[/C][C]-1.8266[/C][C]0.035748[/C][/ROW]
[ROW][C]3[/C][C]0.115925[/C][C]1.0369[/C][C]0.151462[/C][/ROW]
[ROW][C]4[/C][C]-0.07669[/C][C]-0.6859[/C][C]0.247368[/C][/ROW]
[ROW][C]5[/C][C]-0.104258[/C][C]-0.9325[/C][C]0.176939[/C][/ROW]
[ROW][C]6[/C][C]-0.210783[/C][C]-1.8853[/C][C]0.03151[/C][/ROW]
[ROW][C]7[/C][C]-0.162666[/C][C]-1.4549[/C][C]0.074801[/C][/ROW]
[ROW][C]8[/C][C]-0.301174[/C][C]-2.6938[/C][C]0.004302[/C][/ROW]
[ROW][C]9[/C][C]-0.004775[/C][C]-0.0427[/C][C]0.483019[/C][/ROW]
[ROW][C]10[/C][C]0.000962[/C][C]0.0086[/C][C]0.496578[/C][/ROW]
[ROW][C]11[/C][C]-0.272535[/C][C]-2.4376[/C][C]0.008501[/C][/ROW]
[ROW][C]12[/C][C]0.16212[/C][C]1.45[/C][C]0.075478[/C][/ROW]
[ROW][C]13[/C][C]-0.089016[/C][C]-0.7962[/C][C]0.21414[/C][/ROW]
[ROW][C]14[/C][C]0.146464[/C][C]1.31[/C][C]0.09697[/C][/ROW]
[ROW][C]15[/C][C]0.195847[/C][C]1.7517[/C][C]0.041828[/C][/ROW]
[ROW][C]16[/C][C]-0.089525[/C][C]-0.8007[/C][C]0.212829[/C][/ROW]
[ROW][C]17[/C][C]-0.115056[/C][C]-1.0291[/C][C]0.153269[/C][/ROW]
[ROW][C]18[/C][C]-0.08327[/C][C]-0.7448[/C][C]0.229291[/C][/ROW]
[ROW][C]19[/C][C]-0.026555[/C][C]-0.2375[/C][C]0.406434[/C][/ROW]
[ROW][C]20[/C][C]-0.171238[/C][C]-1.5316[/C][C]0.064783[/C][/ROW]
[ROW][C]21[/C][C]-0.063551[/C][C]-0.5684[/C][C]0.285672[/C][/ROW]
[ROW][C]22[/C][C]-0.023032[/C][C]-0.206[/C][C]0.418656[/C][/ROW]
[ROW][C]23[/C][C]-0.043288[/C][C]-0.3872[/C][C]0.349826[/C][/ROW]
[ROW][C]24[/C][C]-0.071326[/C][C]-0.638[/C][C]0.26266[/C][/ROW]
[ROW][C]25[/C][C]0.142135[/C][C]1.2713[/C][C]0.103654[/C][/ROW]
[ROW][C]26[/C][C]-0.022048[/C][C]-0.1972[/C][C]0.422084[/C][/ROW]
[ROW][C]27[/C][C]0.024834[/C][C]0.2221[/C][C]0.412392[/C][/ROW]
[ROW][C]28[/C][C]-0.021834[/C][C]-0.1953[/C][C]0.422832[/C][/ROW]
[ROW][C]29[/C][C]0.077967[/C][C]0.6974[/C][C]0.243801[/C][/ROW]
[ROW][C]30[/C][C]0.016565[/C][C]0.1482[/C][C]0.441294[/C][/ROW]
[ROW][C]31[/C][C]-0.041905[/C][C]-0.3748[/C][C]0.354397[/C][/ROW]
[ROW][C]32[/C][C]0.001379[/C][C]0.0123[/C][C]0.495094[/C][/ROW]
[ROW][C]33[/C][C]-0.049258[/C][C]-0.4406[/C][C]0.330355[/C][/ROW]
[ROW][C]34[/C][C]0.063589[/C][C]0.5688[/C][C]0.285558[/C][/ROW]
[ROW][C]35[/C][C]-0.078943[/C][C]-0.7061[/C][C]0.241091[/C][/ROW]
[ROW][C]36[/C][C]0.097081[/C][C]0.8683[/C][C]0.193908[/C][/ROW]
[ROW][C]37[/C][C]0.026594[/C][C]0.2379[/C][C]0.406296[/C][/ROW]
[ROW][C]38[/C][C]0.019442[/C][C]0.1739[/C][C]0.431196[/C][/ROW]
[ROW][C]39[/C][C]-0.146354[/C][C]-1.309[/C][C]0.097137[/C][/ROW]
[ROW][C]40[/C][C]-0.049366[/C][C]-0.4415[/C][C]0.330005[/C][/ROW]
[ROW][C]41[/C][C]-0.04894[/C][C]-0.4377[/C][C]0.331379[/C][/ROW]
[ROW][C]42[/C][C]-0.04943[/C][C]-0.4421[/C][C]0.329799[/C][/ROW]
[ROW][C]43[/C][C]0.181795[/C][C]1.626[/C][C]0.053939[/C][/ROW]
[ROW][C]44[/C][C]-0.047555[/C][C]-0.4253[/C][C]0.335865[/C][/ROW]
[ROW][C]45[/C][C]-0.047682[/C][C]-0.4265[/C][C]0.33545[/C][/ROW]
[ROW][C]46[/C][C]-0.028648[/C][C]-0.2562[/C][C]0.399215[/C][/ROW]
[ROW][C]47[/C][C]-0.030813[/C][C]-0.2756[/C][C]0.391782[/C][/ROW]
[ROW][C]48[/C][C]0.007121[/C][C]0.0637[/C][C]0.474688[/C][/ROW]
[/TABLE]
Source: https://freestatistics.org/blog/index.php?pk=167726&T=2

Globally Unique Identifier (entire table): ba.freestatistics.org/blog/index.php?pk=167726&T=2

As an alternative you can also use a QR Code:  

The GUIDs for individual cells are displayed in the table below:

Partial Autocorrelation Function
Time lag kPACF(k)T-STATP-value
1-0.492936-4.4091.6e-05
2-0.204215-1.82660.035748
30.1159251.03690.151462
4-0.07669-0.68590.247368
5-0.104258-0.93250.176939
6-0.210783-1.88530.03151
7-0.162666-1.45490.074801
8-0.301174-2.69380.004302
9-0.004775-0.04270.483019
100.0009620.00860.496578
11-0.272535-2.43760.008501
120.162121.450.075478
13-0.089016-0.79620.21414
140.1464641.310.09697
150.1958471.75170.041828
16-0.089525-0.80070.212829
17-0.115056-1.02910.153269
18-0.08327-0.74480.229291
19-0.026555-0.23750.406434
20-0.171238-1.53160.064783
21-0.063551-0.56840.285672
22-0.023032-0.2060.418656
23-0.043288-0.38720.349826
24-0.071326-0.6380.26266
250.1421351.27130.103654
26-0.022048-0.19720.422084
270.0248340.22210.412392
28-0.021834-0.19530.422832
290.0779670.69740.243801
300.0165650.14820.441294
31-0.041905-0.37480.354397
320.0013790.01230.495094
33-0.049258-0.44060.330355
340.0635890.56880.285558
35-0.078943-0.70610.241091
360.0970810.86830.193908
370.0265940.23790.406296
380.0194420.17390.431196
39-0.146354-1.3090.097137
40-0.049366-0.44150.330005
41-0.04894-0.43770.331379
42-0.04943-0.44210.329799
430.1817951.6260.053939
44-0.047555-0.42530.335865
45-0.047682-0.42650.33545
46-0.028648-0.25620.399215
47-0.030813-0.27560.391782
480.0071210.06370.474688


Parameters (Session):
par1 = 48 ; par2 = 1 ; par3 = 1 ; par4 = 0 ; par5 = 12 ; par6 = White Noise ; par7 = 0.95 ;
Parameters (R input):
par1 = 48 ; par2 = 1 ; par3 = 1 ; par4 = 0 ; par5 = 12 ; par6 = White Noise ; par7 = 0.95 ; par8 = ;
R code (references can be found in the software module):
par8 <- ''
par7 <- '0.95'
par6 <- 'White Noise'
par5 <- '12'
par4 <- '0'
par3 <- '0'
par2 <- '1'
par1 <- '48'
if (par1 == 'Default') {
par1 = 10*log10(length(x))
} else {
par1 <- as.numeric(par1)
}
par2 <- as.numeric(par2)
par3 <- as.numeric(par3)
par4 <- as.numeric(par4)
par5 <- as.numeric(par5)
if (par6 == 'White Noise') par6 <- 'white' else par6 <- 'ma'
par7 <- as.numeric(par7)
if (par8 != '') par8 <- as.numeric(par8)
ox <- x
if (par8 == '') {
if (par2 == 0) {
x <- log(x)
} else {
x <- (x ^ par2 - 1) / par2
}
} else {
x <- log(x,base=par8)
}
if (par3 > 0) x <- diff(x,lag=1,difference=par3)
if (par4 > 0) x <- diff(x,lag=par5,difference=par4)
bitmap(file='picts.png')
op <- par(mfrow=c(2,1))
plot(ox,type='l',main='Original Time Series',xlab='time',ylab='value')
if (par8=='') {
mytitle <- paste('Working Time Series (lambda=',par2,', d=',par3,', D=',par4,')',sep='')
mysub <- paste('(lambda=',par2,', d=',par3,', D=',par4,', CI=', par7, ', CI type=',par6,')',sep='')
} else {
mytitle <- paste('Working Time Series (base=',par8,', d=',par3,', D=',par4,')',sep='')
mysub <- paste('(base=',par8,', d=',par3,', D=',par4,', CI=', par7, ', CI type=',par6,')',sep='')
}
plot(x,type='l', main=mytitle,xlab='time',ylab='value')
par(op)
dev.off()
bitmap(file='pic1.png')
racf <- acf(x, par1, main='Autocorrelation', xlab='time lag', ylab='ACF', ci.type=par6, ci=par7, sub=mysub)
dev.off()
bitmap(file='pic2.png')
rpacf <- pacf(x,par1,main='Partial Autocorrelation',xlab='lags',ylab='PACF',sub=mysub)
dev.off()
(myacf <- c(racf$acf))
(mypacf <- c(rpacf$acf))
lengthx <- length(x)
sqrtn <- sqrt(lengthx)
load(file='createtable')
a<-table.start()
a<-table.row.start(a)
a<-table.element(a,'Autocorrelation Function',4,TRUE)
a<-table.row.end(a)
a<-table.row.start(a)
a<-table.element(a,'Time lag k',header=TRUE)
a<-table.element(a,hyperlink('basics.htm','ACF(k)','click here for more information about the Autocorrelation Function'),header=TRUE)
a<-table.element(a,'T-STAT',header=TRUE)
a<-table.element(a,'P-value',header=TRUE)
a<-table.row.end(a)
for (i in 2:(par1+1)) {
a<-table.row.start(a)
a<-table.element(a,i-1,header=TRUE)
a<-table.element(a,round(myacf[i],6))
mytstat <- myacf[i]*sqrtn
a<-table.element(a,round(mytstat,4))
a<-table.element(a,round(1-pt(abs(mytstat),lengthx),6))
a<-table.row.end(a)
}
a<-table.end(a)
table.save(a,file='mytable.tab')
a<-table.start()
a<-table.row.start(a)
a<-table.element(a,'Partial Autocorrelation Function',4,TRUE)
a<-table.row.end(a)
a<-table.row.start(a)
a<-table.element(a,'Time lag k',header=TRUE)
a<-table.element(a,hyperlink('basics.htm','PACF(k)','click here for more information about the Partial Autocorrelation Function'),header=TRUE)
a<-table.element(a,'T-STAT',header=TRUE)
a<-table.element(a,'P-value',header=TRUE)
a<-table.row.end(a)
for (i in 1:par1) {
a<-table.row.start(a)
a<-table.element(a,i,header=TRUE)
a<-table.element(a,round(mypacf[i],6))
mytstat <- mypacf[i]*sqrtn
a<-table.element(a,round(mytstat,4))
a<-table.element(a,round(1-pt(abs(mytstat),lengthx),6))
a<-table.row.end(a)
}
a<-table.end(a)
table.save(a,file='mytable1.tab')