Free Statistics
of Irreproducible Research!
Description of Statistical Computation | ||||||||||||||||||||||||||||||||||
|---|---|---|---|---|---|---|---|---|---|---|---|---|---|---|---|---|---|---|---|---|---|---|---|---|---|---|---|---|---|---|---|---|---|---|
| Author's title | ||||||||||||||||||||||||||||||||||
| Author | *The author of this computation has been verified* | |||||||||||||||||||||||||||||||||
| R Software Module | rwasp_Distributional Plots.wasp | |||||||||||||||||||||||||||||||||
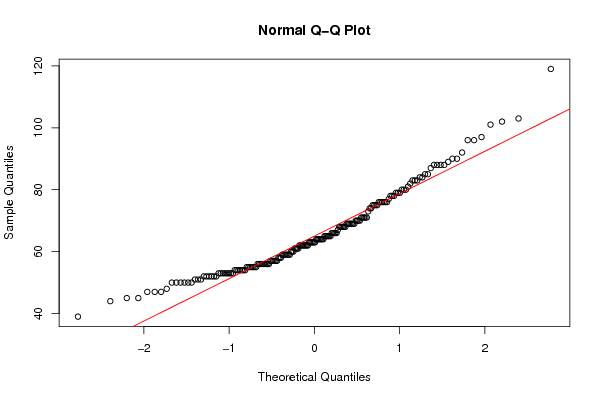
| Title produced by software | Histogram, QQplot and Density | |||||||||||||||||||||||||||||||||
| Date of computation | Sun, 27 May 2012 08:50:28 -0400 | |||||||||||||||||||||||||||||||||
| Cite this page as follows | Statistical Computations at FreeStatistics.org, Office for Research Development and Education, URL https://freestatistics.org/blog/index.php?v=date/2012/May/27/t1338123038past4d60545beqg.htm/, Retrieved Wed, 08 May 2024 18:52:28 +0000 | |||||||||||||||||||||||||||||||||
| Statistical Computations at FreeStatistics.org, Office for Research Development and Education, URL https://freestatistics.org/blog/index.php?pk=167706, Retrieved Wed, 08 May 2024 18:52:28 +0000 | ||||||||||||||||||||||||||||||||||
| QR Codes: | ||||||||||||||||||||||||||||||||||
|
| ||||||||||||||||||||||||||||||||||
| Original text written by user: | ||||||||||||||||||||||||||||||||||
| IsPrivate? | No (this computation is public) | |||||||||||||||||||||||||||||||||
| User-defined keywords | ||||||||||||||||||||||||||||||||||
| Estimated Impact | 146 | |||||||||||||||||||||||||||||||||
Tree of Dependent Computations | ||||||||||||||||||||||||||||||||||
| Family? (F = Feedback message, R = changed R code, M = changed R Module, P = changed Parameters, D = changed Data) | ||||||||||||||||||||||||||||||||||
| - [Simple Linear Regression] [Triglyceridge Reg...] [2011-07-07 15:11:49] [74be16979710d4c4e7c6647856088456] - RMPD [Histogram, QQplot and Density] [Recorded weight] [2012-05-27 12:16:35] [8be39d68cf3e859c626e6f1d2306767c] - R D [Histogram, QQplot and Density] [Recorded height] [2012-05-27 12:18:06] [8be39d68cf3e859c626e6f1d2306767c] - D [Histogram, QQplot and Density] [Reported weight] [2012-05-27 12:19:27] [8be39d68cf3e859c626e6f1d2306767c] - D [Histogram, QQplot and Density] [Repoted height] [2012-05-27 12:20:44] [8be39d68cf3e859c626e6f1d2306767c] - D [Histogram, QQplot and Density] [Difference in weight] [2012-05-27 12:22:33] [8be39d68cf3e859c626e6f1d2306767c] - R D [Histogram, QQplot and Density] [] [2012-05-27 12:50:28] [ba39d87c5b07fdeb99ead4bedf199d9b] [Current] | ||||||||||||||||||||||||||||||||||
| Feedback Forum | ||||||||||||||||||||||||||||||||||
Post a new message | ||||||||||||||||||||||||||||||||||
Dataset | ||||||||||||||||||||||||||||||||||
| Dataseries X: | ||||||||||||||||||||||||||||||||||
39 44 45 45 47 47 47 48 50 50 50 50 50 50 51 51 51 52 52 52 52 52 52 53 53 53 53 53 53 53 53 54 54 54 54 54 54 54 55 55 55 55 55 55 55 56 56 56 56 56 56 56 56 56 57 57 57 57 57 57 58 58 58 59 59 59 59 59 59 59 60 60 60 61 61 61 61 62 62 62 62 62 62 62 62 63 63 63 63 63 63 64 64 64 64 64 64 64 65 65 65 65 65 65 66 66 66 66 66 67 68 68 68 68 68 68 69 69 69 69 69 69 69 70 70 70 70 71 71 71 71 71 73 74 74 75 75 75 75 76 76 76 76 76 76 77 78 78 78 79 79 79 80 80 80 81 82 83 83 83 84 84 85 85 87 88 88 88 88 89 90 90 92 96 96 97 101 102 103 119 | ||||||||||||||||||||||||||||||||||
Tables (Output of Computation) | ||||||||||||||||||||||||||||||||||
| ||||||||||||||||||||||||||||||||||
Figures (Output of Computation) | ||||||||||||||||||||||||||||||||||
Input Parameters & R Code | ||||||||||||||||||||||||||||||||||
| Parameters (Session): | ||||||||||||||||||||||||||||||||||
| Parameters (R input): | ||||||||||||||||||||||||||||||||||
| par1 = 10 ; | ||||||||||||||||||||||||||||||||||
| R code (references can be found in the software module): | ||||||||||||||||||||||||||||||||||
x <- x[!is.na(x)] | ||||||||||||||||||||||||||||||||||