Free Statistics
of Irreproducible Research!
Description of Statistical Computation | ||||||||||||||||||||||||||||||
|---|---|---|---|---|---|---|---|---|---|---|---|---|---|---|---|---|---|---|---|---|---|---|---|---|---|---|---|---|---|---|
| Author's title | ||||||||||||||||||||||||||||||
| Author | *The author of this computation has been verified* | |||||||||||||||||||||||||||||
| R Software Module | rwasp_Distributional Plots.wasp | |||||||||||||||||||||||||||||
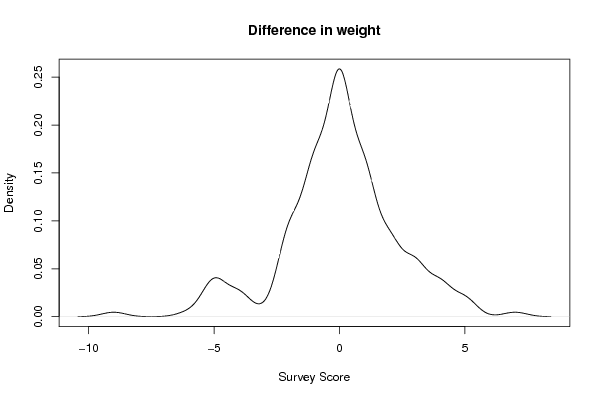
| Title produced by software | Histogram, QQplot and Density | |||||||||||||||||||||||||||||
| Date of computation | Sun, 27 May 2012 08:22:33 -0400 | |||||||||||||||||||||||||||||
| Cite this page as follows | Statistical Computations at FreeStatistics.org, Office for Research Development and Education, URL https://freestatistics.org/blog/index.php?v=date/2012/May/27/t13381213711nvyv2q9v20lbzg.htm/, Retrieved Wed, 08 May 2024 04:42:02 +0000 | |||||||||||||||||||||||||||||
| Statistical Computations at FreeStatistics.org, Office for Research Development and Education, URL https://freestatistics.org/blog/index.php?pk=167697, Retrieved Wed, 08 May 2024 04:42:02 +0000 | ||||||||||||||||||||||||||||||
| QR Codes: | ||||||||||||||||||||||||||||||
|
| ||||||||||||||||||||||||||||||
| Original text written by user: | ||||||||||||||||||||||||||||||
| IsPrivate? | No (this computation is public) | |||||||||||||||||||||||||||||
| User-defined keywords | ||||||||||||||||||||||||||||||
| Estimated Impact | 147 | |||||||||||||||||||||||||||||
Tree of Dependent Computations | ||||||||||||||||||||||||||||||
| Family? (F = Feedback message, R = changed R code, M = changed R Module, P = changed Parameters, D = changed Data) | ||||||||||||||||||||||||||||||
| - [Simple Linear Regression] [Triglyceridge Reg...] [2011-07-07 15:11:49] [74be16979710d4c4e7c6647856088456] - RMPD [Histogram, QQplot and Density] [Recorded weight] [2012-05-27 12:16:35] [8be39d68cf3e859c626e6f1d2306767c] - R D [Histogram, QQplot and Density] [Recorded height] [2012-05-27 12:18:06] [8be39d68cf3e859c626e6f1d2306767c] - D [Histogram, QQplot and Density] [Reported weight] [2012-05-27 12:19:27] [8be39d68cf3e859c626e6f1d2306767c] - D [Histogram, QQplot and Density] [Repoted height] [2012-05-27 12:20:44] [8be39d68cf3e859c626e6f1d2306767c] - D [Histogram, QQplot and Density] [Difference in weight] [2012-05-27 12:22:33] [ba39d87c5b07fdeb99ead4bedf199d9b] [Current] - D [Histogram, QQplot and Density] [Difference in height] [2012-05-27 12:24:28] [8be39d68cf3e859c626e6f1d2306767c] - RM D [Wilcoxon-Mann-Whitney Test] [weight / repwt] [2012-05-27 12:27:22] [8be39d68cf3e859c626e6f1d2306767c] - RM D [Wilcoxon-Mann-Whitney Test] [height / repht] [2012-05-27 12:31:23] [8be39d68cf3e859c626e6f1d2306767c] - RM D [Wilcoxon-Mann-Whitney Test] [DiffweightFemale ...] [2012-05-27 12:34:52] [8be39d68cf3e859c626e6f1d2306767c] - RM D [Wilcoxon-Mann-Whitney Test] [DiffHeightFemale ...] [2012-05-27 12:41:10] [8be39d68cf3e859c626e6f1d2306767c] - R D [Histogram, QQplot and Density] [Recorded height] [2012-05-27 12:47:55] [8be39d68cf3e859c626e6f1d2306767c] - R D [Histogram, QQplot and Density] [] [2012-05-27 12:50:28] [8be39d68cf3e859c626e6f1d2306767c] - RM D [CARE Data - Boxplots and Scatterplot Matrix] [Boxplot and scatt...] [2012-05-27 12:53:39] [8be39d68cf3e859c626e6f1d2306767c] - RM D [CARE Data - Boxplots and Scatterplot Matrix] [DiffWF / DiffWM] [2012-05-27 12:55:28] [8be39d68cf3e859c626e6f1d2306767c] - RM D [One-Way-Between-Groups ANOVA- Free Statistics Software (Calculator)] [ANOVA for all dif...] [2012-05-27 12:57:52] [8be39d68cf3e859c626e6f1d2306767c] | ||||||||||||||||||||||||||||||
| Feedback Forum | ||||||||||||||||||||||||||||||
Post a new message | ||||||||||||||||||||||||||||||
Dataset | ||||||||||||||||||||||||||||||
| Dataseries X: | ||||||||||||||||||||||||||||||
-2 0 0 0 2 0 0 4 3 1 0 0 0 -5 1 0 -1 1 1 0 0 -1 -5 3 2 1 1 0 0 -1 -2 1 0 -1 -1 -2 -5 1 0 0 0 0 -2 3 2 0 0 0 -1 -1 -1 2 1 1 -1 -2 7 4 -2 4 4 1 0 0 0 5 5 1 1 0 0 1 1 1 0 0 -1 4 4 2 1 -1 2 2 1 0 0 -2 -1 0 5 0 0 3 0 0 -1 3 -4 -1 -2 -1 -2 0 -2 -4 0 -1 1 1 -1 -1 -2 0 -1 -2 -4 0 0 -1 -2 1 0 -1 -1 -2 -4 -4 2 0 -5 3 0 0 -5 -1 3 1 5 2 -1 1 1 1 0 -1 0 1 -2 3 0 -2 4 2 0 -1 -3 3 0 -1 -2 -6 3 2 -2 2 2 1 -5 3 -1 -1 -9 2 1 -1 1 -5 2 -5 | ||||||||||||||||||||||||||||||
Tables (Output of Computation) | ||||||||||||||||||||||||||||||
| ||||||||||||||||||||||||||||||
Figures (Output of Computation) | ||||||||||||||||||||||||||||||
Input Parameters & R Code | ||||||||||||||||||||||||||||||
| Parameters (Session): | ||||||||||||||||||||||||||||||
| Parameters (R input): | ||||||||||||||||||||||||||||||
| par1 = 10 ; | ||||||||||||||||||||||||||||||
| R code (references can be found in the software module): | ||||||||||||||||||||||||||||||
par1 <- '10' | ||||||||||||||||||||||||||||||