Free Statistics

of Irreproducible Research!

Author's title

Author*Unverified author*
R Software Modulerwasp_smp.wasp
Title produced by softwareStandard Deviation-Mean Plot
Date of computationWed, 23 May 2012 18:27:24 -0400
Cite this page as followsStatistical Computations at FreeStatistics.org, Office for Research Development and Education, URL https://freestatistics.org/blog/index.php?v=date/2012/May/23/t1337812098rkc6ixituptyymj.htm/, Retrieved Mon, 29 Apr 2024 00:13:08 +0000
Statistical Computations at FreeStatistics.org, Office for Research Development and Education, URL https://freestatistics.org/blog/index.php?pk=167242, Retrieved Mon, 29 Apr 2024 00:13:08 +0000
QR Codes:

Original text written by user:
IsPrivate?No (this computation is public)
User-defined keywords
Estimated Impact89
Family? (F = Feedback message, R = changed R code, M = changed R Module, P = changed Parameters, D = changed Data)
-       [Standard Deviation-Mean Plot] [] [2012-05-23 22:27:24] [82057307b3bba110026a30ac56165df7] [Current]
Feedback Forum

Post a new message
Dataseries X:
111
111
112
115
115
115
116
116
112
110
111
111
108
109
112
113
114
115
116
114
115
117
121
119
119
119
122
123
127
130
131
126
125
121
114
109
108
110
110
111
113
116
115
117
116
115
117
117
119
118
122
124
125
125
124
124
125
125
126
129
131
132
135
137
138
136
136
136
138
138
138
138


Summary of computational transaction
Raw Inputview raw input (R code)
Raw Outputview raw output of R engine
Computing time1 seconds
R Server'Gertrude Mary Cox' @ cox.wessa.net

\begin{tabular}{lllllllll}
\hline
Summary of computational transaction \tabularnewline
Raw Input & view raw input (R code)  \tabularnewline
Raw Output & view raw output of R engine  \tabularnewline
Computing time & 1 seconds \tabularnewline
R Server & 'Gertrude Mary Cox' @ cox.wessa.net \tabularnewline
\hline
\end{tabular}
%Source: https://freestatistics.org/blog/index.php?pk=167242&T=0

[TABLE]
[ROW][C]Summary of computational transaction[/C][/ROW]
[ROW][C]Raw Input[/C][C]view raw input (R code) [/C][/ROW]
[ROW][C]Raw Output[/C][C]view raw output of R engine [/C][/ROW]
[ROW][C]Computing time[/C][C]1 seconds[/C][/ROW]
[ROW][C]R Server[/C][C]'Gertrude Mary Cox' @ cox.wessa.net[/C][/ROW]
[/TABLE]
Source: https://freestatistics.org/blog/index.php?pk=167242&T=0

Globally Unique Identifier (entire table): ba.freestatistics.org/blog/index.php?pk=167242&T=0

As an alternative you can also use a QR Code:  

The GUIDs for individual cells are displayed in the table below:

Summary of computational transaction
Raw Inputview raw input (R code)
Raw Outputview raw output of R engine
Computing time1 seconds
R Server'Gertrude Mary Cox' @ cox.wessa.net


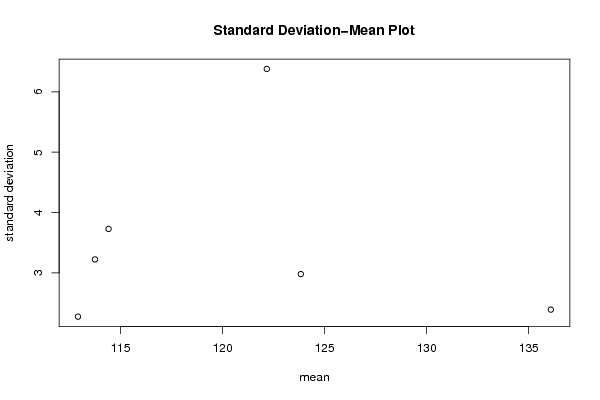
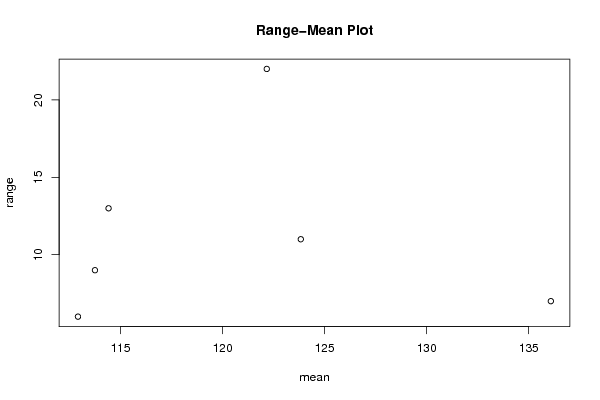
Standard Deviation-Mean Plot
SectionMeanStandard DeviationRange
1112.9166666666672.274696116900556
2114.4166666666673.7284735685686613
3122.1666666666676.3794176612736122
4113.753.222788177396039
5123.8333333333332.9797294975866311
6136.0833333333332.391588796113787

\begin{tabular}{lllllllll}
\hline
Standard Deviation-Mean Plot \tabularnewline
Section & Mean & Standard Deviation & Range \tabularnewline
1 & 112.916666666667 & 2.27469611690055 & 6 \tabularnewline
2 & 114.416666666667 & 3.72847356856866 & 13 \tabularnewline
3 & 122.166666666667 & 6.37941766127361 & 22 \tabularnewline
4 & 113.75 & 3.22278817739603 & 9 \tabularnewline
5 & 123.833333333333 & 2.97972949758663 & 11 \tabularnewline
6 & 136.083333333333 & 2.39158879611378 & 7 \tabularnewline
\hline
\end{tabular}
%Source: https://freestatistics.org/blog/index.php?pk=167242&T=1

[TABLE]
[ROW][C]Standard Deviation-Mean Plot[/C][/ROW]
[ROW][C]Section[/C][C]Mean[/C][C]Standard Deviation[/C][C]Range[/C][/ROW]
[ROW][C]1[/C][C]112.916666666667[/C][C]2.27469611690055[/C][C]6[/C][/ROW]
[ROW][C]2[/C][C]114.416666666667[/C][C]3.72847356856866[/C][C]13[/C][/ROW]
[ROW][C]3[/C][C]122.166666666667[/C][C]6.37941766127361[/C][C]22[/C][/ROW]
[ROW][C]4[/C][C]113.75[/C][C]3.22278817739603[/C][C]9[/C][/ROW]
[ROW][C]5[/C][C]123.833333333333[/C][C]2.97972949758663[/C][C]11[/C][/ROW]
[ROW][C]6[/C][C]136.083333333333[/C][C]2.39158879611378[/C][C]7[/C][/ROW]
[/TABLE]
Source: https://freestatistics.org/blog/index.php?pk=167242&T=1

Globally Unique Identifier (entire table): ba.freestatistics.org/blog/index.php?pk=167242&T=1

As an alternative you can also use a QR Code:  

The GUIDs for individual cells are displayed in the table below:

Standard Deviation-Mean Plot
SectionMeanStandard DeviationRange
1112.9166666666672.274696116900556
2114.4166666666673.7284735685686613
3122.1666666666676.3794176612736122
4113.753.222788177396039
5123.8333333333332.9797294975866311
6136.0833333333332.391588796113787


Regression: S.E.(k) = alpha + beta * Mean(k)
alpha4.84297175249722
beta-0.0111746531880305
S.D.0.0846417240916679
T-STAT-0.132022986392955
p-value0.901340680506235

\begin{tabular}{lllllllll}
\hline
Regression: S.E.(k) = alpha + beta * Mean(k) \tabularnewline
alpha & 4.84297175249722 \tabularnewline
beta & -0.0111746531880305 \tabularnewline
S.D. & 0.0846417240916679 \tabularnewline
T-STAT & -0.132022986392955 \tabularnewline
p-value & 0.901340680506235 \tabularnewline
\hline
\end{tabular}
%Source: https://freestatistics.org/blog/index.php?pk=167242&T=2

[TABLE]
[ROW][C]Regression: S.E.(k) = alpha + beta * Mean(k)[/C][/ROW]
[ROW][C]alpha[/C][C]4.84297175249722[/C][/ROW]
[ROW][C]beta[/C][C]-0.0111746531880305[/C][/ROW]
[ROW][C]S.D.[/C][C]0.0846417240916679[/C][/ROW]
[ROW][C]T-STAT[/C][C]-0.132022986392955[/C][/ROW]
[ROW][C]p-value[/C][C]0.901340680506235[/C][/ROW]
[/TABLE]
Source: https://freestatistics.org/blog/index.php?pk=167242&T=2

Globally Unique Identifier (entire table): ba.freestatistics.org/blog/index.php?pk=167242&T=2

As an alternative you can also use a QR Code:  

The GUIDs for individual cells are displayed in the table below:

Regression: S.E.(k) = alpha + beta * Mean(k)
alpha4.84297175249722
beta-0.0111746531880305
S.D.0.0846417240916679
T-STAT-0.132022986392955
p-value0.901340680506235


Regression: ln S.E.(k) = alpha + beta * ln Mean(k)
alpha3.72487954412939
beta-0.529760943244723
S.D.2.58835005499557
T-STAT-0.204671289427129
p-value0.847821613648957
Lambda1.52976094324472

\begin{tabular}{lllllllll}
\hline
Regression: ln S.E.(k) = alpha + beta * ln Mean(k) \tabularnewline
alpha & 3.72487954412939 \tabularnewline
beta & -0.529760943244723 \tabularnewline
S.D. & 2.58835005499557 \tabularnewline
T-STAT & -0.204671289427129 \tabularnewline
p-value & 0.847821613648957 \tabularnewline
Lambda & 1.52976094324472 \tabularnewline
\hline
\end{tabular}
%Source: https://freestatistics.org/blog/index.php?pk=167242&T=3

[TABLE]
[ROW][C]Regression: ln S.E.(k) = alpha + beta * ln Mean(k)[/C][/ROW]
[ROW][C]alpha[/C][C]3.72487954412939[/C][/ROW]
[ROW][C]beta[/C][C]-0.529760943244723[/C][/ROW]
[ROW][C]S.D.[/C][C]2.58835005499557[/C][/ROW]
[ROW][C]T-STAT[/C][C]-0.204671289427129[/C][/ROW]
[ROW][C]p-value[/C][C]0.847821613648957[/C][/ROW]
[ROW][C]Lambda[/C][C]1.52976094324472[/C][/ROW]
[/TABLE]
Source: https://freestatistics.org/blog/index.php?pk=167242&T=3

Globally Unique Identifier (entire table): ba.freestatistics.org/blog/index.php?pk=167242&T=3

As an alternative you can also use a QR Code:  

The GUIDs for individual cells are displayed in the table below:

Regression: ln S.E.(k) = alpha + beta * ln Mean(k)
alpha3.72487954412939
beta-0.529760943244723
S.D.2.58835005499557
T-STAT-0.204671289427129
p-value0.847821613648957
Lambda1.52976094324472


Parameters (Session):
Parameters (R input):
par1 = 12 ;
R code (references can be found in the software module):
par1 <- as.numeric(par1)
(n <- length(x))
(np <- floor(n / par1))
arr <- array(NA,dim=c(par1,np))
j <- 0
k <- 1
for (i in 1:(np*par1))
{
j = j + 1
arr[j,k] <- x[i]
if (j == par1) {
j = 0
k=k+1
}
}
arr
arr.mean <- array(NA,dim=np)
arr.sd <- array(NA,dim=np)
arr.range <- array(NA,dim=np)
for (j in 1:np)
{
arr.mean[j] <- mean(arr[,j],na.rm=TRUE)
arr.sd[j] <- sd(arr[,j],na.rm=TRUE)
arr.range[j] <- max(arr[,j],na.rm=TRUE) - min(arr[,j],na.rm=TRUE)
}
arr.mean
arr.sd
arr.range
(lm1 <- lm(arr.sd~arr.mean))
(lnlm1 <- lm(log(arr.sd)~log(arr.mean)))
(lm2 <- lm(arr.range~arr.mean))
bitmap(file='test1.png')
plot(arr.mean,arr.sd,main='Standard Deviation-Mean Plot',xlab='mean',ylab='standard deviation')
dev.off()
bitmap(file='test2.png')
plot(arr.mean,arr.range,main='Range-Mean Plot',xlab='mean',ylab='range')
dev.off()
load(file='createtable')
a<-table.start()
a<-table.row.start(a)
a<-table.element(a,'Standard Deviation-Mean Plot',4,TRUE)
a<-table.row.end(a)
a<-table.row.start(a)
a<-table.element(a,'Section',header=TRUE)
a<-table.element(a,'Mean',header=TRUE)
a<-table.element(a,'Standard Deviation',header=TRUE)
a<-table.element(a,'Range',header=TRUE)
a<-table.row.end(a)
for (j in 1:np) {
a<-table.row.start(a)
a<-table.element(a,j,header=TRUE)
a<-table.element(a,arr.mean[j])
a<-table.element(a,arr.sd[j] )
a<-table.element(a,arr.range[j] )
a<-table.row.end(a)
}
a<-table.end(a)
table.save(a,file='mytable.tab')
a<-table.start()
a<-table.row.start(a)
a<-table.element(a,'Regression: S.E.(k) = alpha + beta * Mean(k)',2,TRUE)
a<-table.row.end(a)
a<-table.row.start(a)
a<-table.element(a,'alpha',header=TRUE)
a<-table.element(a,lm1$coefficients[[1]])
a<-table.row.end(a)
a<-table.row.start(a)
a<-table.element(a,'beta',header=TRUE)
a<-table.element(a,lm1$coefficients[[2]])
a<-table.row.end(a)
a<-table.row.start(a)
a<-table.element(a,'S.D.',header=TRUE)
a<-table.element(a,summary(lm1)$coefficients[2,2])
a<-table.row.end(a)
a<-table.row.start(a)
a<-table.element(a,'T-STAT',header=TRUE)
a<-table.element(a,summary(lm1)$coefficients[2,3])
a<-table.row.end(a)
a<-table.row.start(a)
a<-table.element(a,'p-value',header=TRUE)
a<-table.element(a,summary(lm1)$coefficients[2,4])
a<-table.row.end(a)
a<-table.end(a)
table.save(a,file='mytable1.tab')
a<-table.start()
a<-table.row.start(a)
a<-table.element(a,'Regression: ln S.E.(k) = alpha + beta * ln Mean(k)',2,TRUE)
a<-table.row.end(a)
a<-table.row.start(a)
a<-table.element(a,'alpha',header=TRUE)
a<-table.element(a,lnlm1$coefficients[[1]])
a<-table.row.end(a)
a<-table.row.start(a)
a<-table.element(a,'beta',header=TRUE)
a<-table.element(a,lnlm1$coefficients[[2]])
a<-table.row.end(a)
a<-table.row.start(a)
a<-table.element(a,'S.D.',header=TRUE)
a<-table.element(a,summary(lnlm1)$coefficients[2,2])
a<-table.row.end(a)
a<-table.row.start(a)
a<-table.element(a,'T-STAT',header=TRUE)
a<-table.element(a,summary(lnlm1)$coefficients[2,3])
a<-table.row.end(a)
a<-table.row.start(a)
a<-table.element(a,'p-value',header=TRUE)
a<-table.element(a,summary(lnlm1)$coefficients[2,4])
a<-table.row.end(a)
a<-table.row.start(a)
a<-table.element(a,'Lambda',header=TRUE)
a<-table.element(a,1-lnlm1$coefficients[[2]])
a<-table.row.end(a)
a<-table.end(a)
table.save(a,file='mytable2.tab')