Free Statistics

of Irreproducible Research!

Author's title

Author*Unverified author*
R Software Modulerwasp_autocorrelation.wasp
Title produced by software(Partial) Autocorrelation Function
Date of computationWed, 23 May 2012 14:36:58 -0400
Cite this page as followsStatistical Computations at FreeStatistics.org, Office for Research Development and Education, URL https://freestatistics.org/blog/index.php?v=date/2012/May/23/t1337798240l9l4x7h12scf2cx.htm/, Retrieved Sun, 28 Apr 2024 20:13:40 +0000
Statistical Computations at FreeStatistics.org, Office for Research Development and Education, URL https://freestatistics.org/blog/index.php?pk=167219, Retrieved Sun, 28 Apr 2024 20:13:40 +0000
QR Codes:

Original text written by user:
IsPrivate?No (this computation is public)
User-defined keywords
Estimated Impact123
Family? (F = Feedback message, R = changed R code, M = changed R Module, P = changed Parameters, D = changed Data)
-       [(Partial) Autocorrelation Function] [] [2012-05-23 18:36:58] [82057307b3bba110026a30ac56165df7] [Current]
Feedback Forum

Post a new message
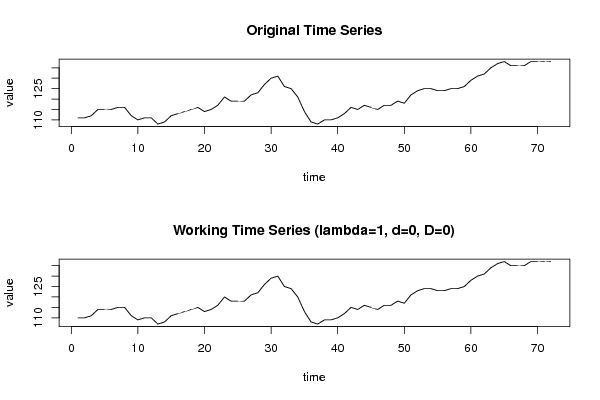
Dataseries X:
111
111
112
115
115
115
116
116
112
110
111
111
108
109
112
113
114
115
116
114
115
117
121
119
119
119
122
123
127
130
131
126
125
121
114
109
108
110
110
111
113
116
115
117
116
115
117
117
119
118
122
124
125
125
124
124
125
125
126
129
131
132
135
137
138
136
136
136
138
138
138
138


Summary of computational transaction
Raw Inputview raw input (R code)
Raw Outputview raw output of R engine
Computing time2 seconds
R Server'Gwilym Jenkins' @ jenkins.wessa.net

\begin{tabular}{lllllllll}
\hline
Summary of computational transaction \tabularnewline
Raw Input & view raw input (R code)  \tabularnewline
Raw Output & view raw output of R engine  \tabularnewline
Computing time & 2 seconds \tabularnewline
R Server & 'Gwilym Jenkins' @ jenkins.wessa.net \tabularnewline
\hline
\end{tabular}
%Source: https://freestatistics.org/blog/index.php?pk=167219&T=0

[TABLE]
[ROW][C]Summary of computational transaction[/C][/ROW]
[ROW][C]Raw Input[/C][C]view raw input (R code) [/C][/ROW]
[ROW][C]Raw Output[/C][C]view raw output of R engine [/C][/ROW]
[ROW][C]Computing time[/C][C]2 seconds[/C][/ROW]
[ROW][C]R Server[/C][C]'Gwilym Jenkins' @ jenkins.wessa.net[/C][/ROW]
[/TABLE]
Source: https://freestatistics.org/blog/index.php?pk=167219&T=0

Globally Unique Identifier (entire table): ba.freestatistics.org/blog/index.php?pk=167219&T=0

As an alternative you can also use a QR Code:  

The GUIDs for individual cells are displayed in the table below:

Summary of computational transaction
Raw Inputview raw input (R code)
Raw Outputview raw output of R engine
Computing time2 seconds
R Server'Gwilym Jenkins' @ jenkins.wessa.net


Autocorrelation Function
Time lag kACF(k)T-STATP-value
10.9361557.94350
20.8496557.20960
30.7544666.40190
40.6606095.60550
50.5658644.80154e-06
60.4860474.12424.9e-05
70.4251143.60720.000284
80.3624363.07540.001485
90.2961322.51280.00711
100.2378882.01850.02363
110.1896441.60920.055976
120.1307711.10960.135426
130.0684480.58080.281594
140.0198140.16810.433476
15-0.017394-0.14760.441539
16-0.054158-0.45950.323613
17-0.079682-0.67610.250563
18-0.090186-0.76530.223311
19-0.098221-0.83340.203679
20-0.111183-0.94340.17431
21-0.11554-0.98040.165089
22-0.110764-0.93990.175215
23-0.097734-0.82930.204839
24-0.103237-0.8760.191974
25-0.104886-0.890.188219
26-0.107764-0.91440.181777
27-0.106159-0.90080.185351
28-0.104369-0.88560.18939
29-0.087714-0.74430.229565
30-0.051823-0.43970.330723
31-0.019084-0.16190.435906
320.0180070.15280.439494
330.0623720.52920.299133
340.1024090.8690.193875
350.1242351.05420.147664
360.1415491.20110.116828
370.1500811.27350.103471
380.1432811.21580.114021
390.1127170.95640.171027
400.0729570.61910.268915
410.0308410.26170.397152
42-0.023705-0.20110.420576
43-0.078613-0.66710.253436
44-0.119563-1.01450.156865
45-0.150439-1.27650.102938
46-0.183432-1.55650.06199
47-0.209142-1.77460.040093
48-0.237135-2.01220.023973

\begin{tabular}{lllllllll}
\hline
Autocorrelation Function \tabularnewline
Time lag k & ACF(k) & T-STAT & P-value \tabularnewline
1 & 0.936155 & 7.9435 & 0 \tabularnewline
2 & 0.849655 & 7.2096 & 0 \tabularnewline
3 & 0.754466 & 6.4019 & 0 \tabularnewline
4 & 0.660609 & 5.6055 & 0 \tabularnewline
5 & 0.565864 & 4.8015 & 4e-06 \tabularnewline
6 & 0.486047 & 4.1242 & 4.9e-05 \tabularnewline
7 & 0.425114 & 3.6072 & 0.000284 \tabularnewline
8 & 0.362436 & 3.0754 & 0.001485 \tabularnewline
9 & 0.296132 & 2.5128 & 0.00711 \tabularnewline
10 & 0.237888 & 2.0185 & 0.02363 \tabularnewline
11 & 0.189644 & 1.6092 & 0.055976 \tabularnewline
12 & 0.130771 & 1.1096 & 0.135426 \tabularnewline
13 & 0.068448 & 0.5808 & 0.281594 \tabularnewline
14 & 0.019814 & 0.1681 & 0.433476 \tabularnewline
15 & -0.017394 & -0.1476 & 0.441539 \tabularnewline
16 & -0.054158 & -0.4595 & 0.323613 \tabularnewline
17 & -0.079682 & -0.6761 & 0.250563 \tabularnewline
18 & -0.090186 & -0.7653 & 0.223311 \tabularnewline
19 & -0.098221 & -0.8334 & 0.203679 \tabularnewline
20 & -0.111183 & -0.9434 & 0.17431 \tabularnewline
21 & -0.11554 & -0.9804 & 0.165089 \tabularnewline
22 & -0.110764 & -0.9399 & 0.175215 \tabularnewline
23 & -0.097734 & -0.8293 & 0.204839 \tabularnewline
24 & -0.103237 & -0.876 & 0.191974 \tabularnewline
25 & -0.104886 & -0.89 & 0.188219 \tabularnewline
26 & -0.107764 & -0.9144 & 0.181777 \tabularnewline
27 & -0.106159 & -0.9008 & 0.185351 \tabularnewline
28 & -0.104369 & -0.8856 & 0.18939 \tabularnewline
29 & -0.087714 & -0.7443 & 0.229565 \tabularnewline
30 & -0.051823 & -0.4397 & 0.330723 \tabularnewline
31 & -0.019084 & -0.1619 & 0.435906 \tabularnewline
32 & 0.018007 & 0.1528 & 0.439494 \tabularnewline
33 & 0.062372 & 0.5292 & 0.299133 \tabularnewline
34 & 0.102409 & 0.869 & 0.193875 \tabularnewline
35 & 0.124235 & 1.0542 & 0.147664 \tabularnewline
36 & 0.141549 & 1.2011 & 0.116828 \tabularnewline
37 & 0.150081 & 1.2735 & 0.103471 \tabularnewline
38 & 0.143281 & 1.2158 & 0.114021 \tabularnewline
39 & 0.112717 & 0.9564 & 0.171027 \tabularnewline
40 & 0.072957 & 0.6191 & 0.268915 \tabularnewline
41 & 0.030841 & 0.2617 & 0.397152 \tabularnewline
42 & -0.023705 & -0.2011 & 0.420576 \tabularnewline
43 & -0.078613 & -0.6671 & 0.253436 \tabularnewline
44 & -0.119563 & -1.0145 & 0.156865 \tabularnewline
45 & -0.150439 & -1.2765 & 0.102938 \tabularnewline
46 & -0.183432 & -1.5565 & 0.06199 \tabularnewline
47 & -0.209142 & -1.7746 & 0.040093 \tabularnewline
48 & -0.237135 & -2.0122 & 0.023973 \tabularnewline
\hline
\end{tabular}
%Source: https://freestatistics.org/blog/index.php?pk=167219&T=1

[TABLE]
[ROW][C]Autocorrelation Function[/C][/ROW]
[ROW][C]Time lag k[/C][C]ACF(k)[/C][C]T-STAT[/C][C]P-value[/C][/ROW]
[ROW][C]1[/C][C]0.936155[/C][C]7.9435[/C][C]0[/C][/ROW]
[ROW][C]2[/C][C]0.849655[/C][C]7.2096[/C][C]0[/C][/ROW]
[ROW][C]3[/C][C]0.754466[/C][C]6.4019[/C][C]0[/C][/ROW]
[ROW][C]4[/C][C]0.660609[/C][C]5.6055[/C][C]0[/C][/ROW]
[ROW][C]5[/C][C]0.565864[/C][C]4.8015[/C][C]4e-06[/C][/ROW]
[ROW][C]6[/C][C]0.486047[/C][C]4.1242[/C][C]4.9e-05[/C][/ROW]
[ROW][C]7[/C][C]0.425114[/C][C]3.6072[/C][C]0.000284[/C][/ROW]
[ROW][C]8[/C][C]0.362436[/C][C]3.0754[/C][C]0.001485[/C][/ROW]
[ROW][C]9[/C][C]0.296132[/C][C]2.5128[/C][C]0.00711[/C][/ROW]
[ROW][C]10[/C][C]0.237888[/C][C]2.0185[/C][C]0.02363[/C][/ROW]
[ROW][C]11[/C][C]0.189644[/C][C]1.6092[/C][C]0.055976[/C][/ROW]
[ROW][C]12[/C][C]0.130771[/C][C]1.1096[/C][C]0.135426[/C][/ROW]
[ROW][C]13[/C][C]0.068448[/C][C]0.5808[/C][C]0.281594[/C][/ROW]
[ROW][C]14[/C][C]0.019814[/C][C]0.1681[/C][C]0.433476[/C][/ROW]
[ROW][C]15[/C][C]-0.017394[/C][C]-0.1476[/C][C]0.441539[/C][/ROW]
[ROW][C]16[/C][C]-0.054158[/C][C]-0.4595[/C][C]0.323613[/C][/ROW]
[ROW][C]17[/C][C]-0.079682[/C][C]-0.6761[/C][C]0.250563[/C][/ROW]
[ROW][C]18[/C][C]-0.090186[/C][C]-0.7653[/C][C]0.223311[/C][/ROW]
[ROW][C]19[/C][C]-0.098221[/C][C]-0.8334[/C][C]0.203679[/C][/ROW]
[ROW][C]20[/C][C]-0.111183[/C][C]-0.9434[/C][C]0.17431[/C][/ROW]
[ROW][C]21[/C][C]-0.11554[/C][C]-0.9804[/C][C]0.165089[/C][/ROW]
[ROW][C]22[/C][C]-0.110764[/C][C]-0.9399[/C][C]0.175215[/C][/ROW]
[ROW][C]23[/C][C]-0.097734[/C][C]-0.8293[/C][C]0.204839[/C][/ROW]
[ROW][C]24[/C][C]-0.103237[/C][C]-0.876[/C][C]0.191974[/C][/ROW]
[ROW][C]25[/C][C]-0.104886[/C][C]-0.89[/C][C]0.188219[/C][/ROW]
[ROW][C]26[/C][C]-0.107764[/C][C]-0.9144[/C][C]0.181777[/C][/ROW]
[ROW][C]27[/C][C]-0.106159[/C][C]-0.9008[/C][C]0.185351[/C][/ROW]
[ROW][C]28[/C][C]-0.104369[/C][C]-0.8856[/C][C]0.18939[/C][/ROW]
[ROW][C]29[/C][C]-0.087714[/C][C]-0.7443[/C][C]0.229565[/C][/ROW]
[ROW][C]30[/C][C]-0.051823[/C][C]-0.4397[/C][C]0.330723[/C][/ROW]
[ROW][C]31[/C][C]-0.019084[/C][C]-0.1619[/C][C]0.435906[/C][/ROW]
[ROW][C]32[/C][C]0.018007[/C][C]0.1528[/C][C]0.439494[/C][/ROW]
[ROW][C]33[/C][C]0.062372[/C][C]0.5292[/C][C]0.299133[/C][/ROW]
[ROW][C]34[/C][C]0.102409[/C][C]0.869[/C][C]0.193875[/C][/ROW]
[ROW][C]35[/C][C]0.124235[/C][C]1.0542[/C][C]0.147664[/C][/ROW]
[ROW][C]36[/C][C]0.141549[/C][C]1.2011[/C][C]0.116828[/C][/ROW]
[ROW][C]37[/C][C]0.150081[/C][C]1.2735[/C][C]0.103471[/C][/ROW]
[ROW][C]38[/C][C]0.143281[/C][C]1.2158[/C][C]0.114021[/C][/ROW]
[ROW][C]39[/C][C]0.112717[/C][C]0.9564[/C][C]0.171027[/C][/ROW]
[ROW][C]40[/C][C]0.072957[/C][C]0.6191[/C][C]0.268915[/C][/ROW]
[ROW][C]41[/C][C]0.030841[/C][C]0.2617[/C][C]0.397152[/C][/ROW]
[ROW][C]42[/C][C]-0.023705[/C][C]-0.2011[/C][C]0.420576[/C][/ROW]
[ROW][C]43[/C][C]-0.078613[/C][C]-0.6671[/C][C]0.253436[/C][/ROW]
[ROW][C]44[/C][C]-0.119563[/C][C]-1.0145[/C][C]0.156865[/C][/ROW]
[ROW][C]45[/C][C]-0.150439[/C][C]-1.2765[/C][C]0.102938[/C][/ROW]
[ROW][C]46[/C][C]-0.183432[/C][C]-1.5565[/C][C]0.06199[/C][/ROW]
[ROW][C]47[/C][C]-0.209142[/C][C]-1.7746[/C][C]0.040093[/C][/ROW]
[ROW][C]48[/C][C]-0.237135[/C][C]-2.0122[/C][C]0.023973[/C][/ROW]
[/TABLE]
Source: https://freestatistics.org/blog/index.php?pk=167219&T=1

Globally Unique Identifier (entire table): ba.freestatistics.org/blog/index.php?pk=167219&T=1

As an alternative you can also use a QR Code:  

The GUIDs for individual cells are displayed in the table below:

Autocorrelation Function
Time lag kACF(k)T-STATP-value
10.9361557.94350
20.8496557.20960
30.7544666.40190
40.6606095.60550
50.5658644.80154e-06
60.4860474.12424.9e-05
70.4251143.60720.000284
80.3624363.07540.001485
90.2961322.51280.00711
100.2378882.01850.02363
110.1896441.60920.055976
120.1307711.10960.135426
130.0684480.58080.281594
140.0198140.16810.433476
15-0.017394-0.14760.441539
16-0.054158-0.45950.323613
17-0.079682-0.67610.250563
18-0.090186-0.76530.223311
19-0.098221-0.83340.203679
20-0.111183-0.94340.17431
21-0.11554-0.98040.165089
22-0.110764-0.93990.175215
23-0.097734-0.82930.204839
24-0.103237-0.8760.191974
25-0.104886-0.890.188219
26-0.107764-0.91440.181777
27-0.106159-0.90080.185351
28-0.104369-0.88560.18939
29-0.087714-0.74430.229565
30-0.051823-0.43970.330723
31-0.019084-0.16190.435906
320.0180070.15280.439494
330.0623720.52920.299133
340.1024090.8690.193875
350.1242351.05420.147664
360.1415491.20110.116828
370.1500811.27350.103471
380.1432811.21580.114021
390.1127170.95640.171027
400.0729570.61910.268915
410.0308410.26170.397152
42-0.023705-0.20110.420576
43-0.078613-0.66710.253436
44-0.119563-1.01450.156865
45-0.150439-1.27650.102938
46-0.183432-1.55650.06199
47-0.209142-1.77460.040093
48-0.237135-2.01220.023973


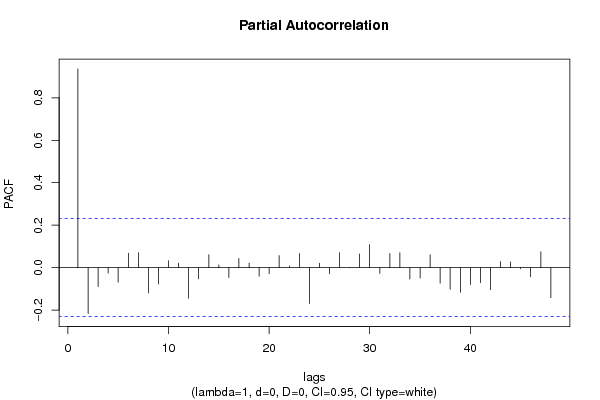
Partial Autocorrelation Function
Time lag kPACF(k)T-STATP-value
10.9361557.94350
2-0.216253-1.8350.03532
3-0.089161-0.75660.225892
4-0.025041-0.21250.416166
5-0.068309-0.57960.281991
60.0681030.57790.282575
70.069850.59270.277621
8-0.119145-1.0110.157705
9-0.077257-0.65550.257101
100.0324040.2750.39207
110.0207090.17570.430504
12-0.143685-1.21920.113373
13-0.052864-0.44860.327547
140.061110.51850.302837
150.0128820.10930.456632
16-0.046813-0.39720.346189
170.0433590.36790.357007
180.0214570.18210.428019
19-0.040038-0.33970.367522
20-0.0284-0.2410.405128
210.05660.48030.316248
220.0076540.06490.474198
230.0666490.56550.286733
24-0.168897-1.43310.078073
250.0205240.17420.431116
26-0.028862-0.24490.403615
270.0703070.59660.27633
280.000790.00670.497334
290.0642420.54510.293681
300.1082610.91860.18068
31-0.027011-0.22920.409684
320.0667820.56670.286352
330.0704720.5980.275866
34-0.053222-0.45160.326455
35-0.048662-0.41290.340451
360.060570.5140.30443
37-0.073195-0.62110.268255
38-0.101531-0.86150.195906
39-0.115658-0.98140.164843
40-0.079382-0.67360.251368
41-0.070609-0.59910.275482
42-0.103855-0.88120.19056
430.0284810.24170.404862
440.0270110.22920.409682
45-0.005347-0.04540.481969
46-0.043293-0.36740.357216
470.0742590.63010.265309
48-0.141261-1.19860.1173

\begin{tabular}{lllllllll}
\hline
Partial Autocorrelation Function \tabularnewline
Time lag k & PACF(k) & T-STAT & P-value \tabularnewline
1 & 0.936155 & 7.9435 & 0 \tabularnewline
2 & -0.216253 & -1.835 & 0.03532 \tabularnewline
3 & -0.089161 & -0.7566 & 0.225892 \tabularnewline
4 & -0.025041 & -0.2125 & 0.416166 \tabularnewline
5 & -0.068309 & -0.5796 & 0.281991 \tabularnewline
6 & 0.068103 & 0.5779 & 0.282575 \tabularnewline
7 & 0.06985 & 0.5927 & 0.277621 \tabularnewline
8 & -0.119145 & -1.011 & 0.157705 \tabularnewline
9 & -0.077257 & -0.6555 & 0.257101 \tabularnewline
10 & 0.032404 & 0.275 & 0.39207 \tabularnewline
11 & 0.020709 & 0.1757 & 0.430504 \tabularnewline
12 & -0.143685 & -1.2192 & 0.113373 \tabularnewline
13 & -0.052864 & -0.4486 & 0.327547 \tabularnewline
14 & 0.06111 & 0.5185 & 0.302837 \tabularnewline
15 & 0.012882 & 0.1093 & 0.456632 \tabularnewline
16 & -0.046813 & -0.3972 & 0.346189 \tabularnewline
17 & 0.043359 & 0.3679 & 0.357007 \tabularnewline
18 & 0.021457 & 0.1821 & 0.428019 \tabularnewline
19 & -0.040038 & -0.3397 & 0.367522 \tabularnewline
20 & -0.0284 & -0.241 & 0.405128 \tabularnewline
21 & 0.0566 & 0.4803 & 0.316248 \tabularnewline
22 & 0.007654 & 0.0649 & 0.474198 \tabularnewline
23 & 0.066649 & 0.5655 & 0.286733 \tabularnewline
24 & -0.168897 & -1.4331 & 0.078073 \tabularnewline
25 & 0.020524 & 0.1742 & 0.431116 \tabularnewline
26 & -0.028862 & -0.2449 & 0.403615 \tabularnewline
27 & 0.070307 & 0.5966 & 0.27633 \tabularnewline
28 & 0.00079 & 0.0067 & 0.497334 \tabularnewline
29 & 0.064242 & 0.5451 & 0.293681 \tabularnewline
30 & 0.108261 & 0.9186 & 0.18068 \tabularnewline
31 & -0.027011 & -0.2292 & 0.409684 \tabularnewline
32 & 0.066782 & 0.5667 & 0.286352 \tabularnewline
33 & 0.070472 & 0.598 & 0.275866 \tabularnewline
34 & -0.053222 & -0.4516 & 0.326455 \tabularnewline
35 & -0.048662 & -0.4129 & 0.340451 \tabularnewline
36 & 0.06057 & 0.514 & 0.30443 \tabularnewline
37 & -0.073195 & -0.6211 & 0.268255 \tabularnewline
38 & -0.101531 & -0.8615 & 0.195906 \tabularnewline
39 & -0.115658 & -0.9814 & 0.164843 \tabularnewline
40 & -0.079382 & -0.6736 & 0.251368 \tabularnewline
41 & -0.070609 & -0.5991 & 0.275482 \tabularnewline
42 & -0.103855 & -0.8812 & 0.19056 \tabularnewline
43 & 0.028481 & 0.2417 & 0.404862 \tabularnewline
44 & 0.027011 & 0.2292 & 0.409682 \tabularnewline
45 & -0.005347 & -0.0454 & 0.481969 \tabularnewline
46 & -0.043293 & -0.3674 & 0.357216 \tabularnewline
47 & 0.074259 & 0.6301 & 0.265309 \tabularnewline
48 & -0.141261 & -1.1986 & 0.1173 \tabularnewline
\hline
\end{tabular}
%Source: https://freestatistics.org/blog/index.php?pk=167219&T=2

[TABLE]
[ROW][C]Partial Autocorrelation Function[/C][/ROW]
[ROW][C]Time lag k[/C][C]PACF(k)[/C][C]T-STAT[/C][C]P-value[/C][/ROW]
[ROW][C]1[/C][C]0.936155[/C][C]7.9435[/C][C]0[/C][/ROW]
[ROW][C]2[/C][C]-0.216253[/C][C]-1.835[/C][C]0.03532[/C][/ROW]
[ROW][C]3[/C][C]-0.089161[/C][C]-0.7566[/C][C]0.225892[/C][/ROW]
[ROW][C]4[/C][C]-0.025041[/C][C]-0.2125[/C][C]0.416166[/C][/ROW]
[ROW][C]5[/C][C]-0.068309[/C][C]-0.5796[/C][C]0.281991[/C][/ROW]
[ROW][C]6[/C][C]0.068103[/C][C]0.5779[/C][C]0.282575[/C][/ROW]
[ROW][C]7[/C][C]0.06985[/C][C]0.5927[/C][C]0.277621[/C][/ROW]
[ROW][C]8[/C][C]-0.119145[/C][C]-1.011[/C][C]0.157705[/C][/ROW]
[ROW][C]9[/C][C]-0.077257[/C][C]-0.6555[/C][C]0.257101[/C][/ROW]
[ROW][C]10[/C][C]0.032404[/C][C]0.275[/C][C]0.39207[/C][/ROW]
[ROW][C]11[/C][C]0.020709[/C][C]0.1757[/C][C]0.430504[/C][/ROW]
[ROW][C]12[/C][C]-0.143685[/C][C]-1.2192[/C][C]0.113373[/C][/ROW]
[ROW][C]13[/C][C]-0.052864[/C][C]-0.4486[/C][C]0.327547[/C][/ROW]
[ROW][C]14[/C][C]0.06111[/C][C]0.5185[/C][C]0.302837[/C][/ROW]
[ROW][C]15[/C][C]0.012882[/C][C]0.1093[/C][C]0.456632[/C][/ROW]
[ROW][C]16[/C][C]-0.046813[/C][C]-0.3972[/C][C]0.346189[/C][/ROW]
[ROW][C]17[/C][C]0.043359[/C][C]0.3679[/C][C]0.357007[/C][/ROW]
[ROW][C]18[/C][C]0.021457[/C][C]0.1821[/C][C]0.428019[/C][/ROW]
[ROW][C]19[/C][C]-0.040038[/C][C]-0.3397[/C][C]0.367522[/C][/ROW]
[ROW][C]20[/C][C]-0.0284[/C][C]-0.241[/C][C]0.405128[/C][/ROW]
[ROW][C]21[/C][C]0.0566[/C][C]0.4803[/C][C]0.316248[/C][/ROW]
[ROW][C]22[/C][C]0.007654[/C][C]0.0649[/C][C]0.474198[/C][/ROW]
[ROW][C]23[/C][C]0.066649[/C][C]0.5655[/C][C]0.286733[/C][/ROW]
[ROW][C]24[/C][C]-0.168897[/C][C]-1.4331[/C][C]0.078073[/C][/ROW]
[ROW][C]25[/C][C]0.020524[/C][C]0.1742[/C][C]0.431116[/C][/ROW]
[ROW][C]26[/C][C]-0.028862[/C][C]-0.2449[/C][C]0.403615[/C][/ROW]
[ROW][C]27[/C][C]0.070307[/C][C]0.5966[/C][C]0.27633[/C][/ROW]
[ROW][C]28[/C][C]0.00079[/C][C]0.0067[/C][C]0.497334[/C][/ROW]
[ROW][C]29[/C][C]0.064242[/C][C]0.5451[/C][C]0.293681[/C][/ROW]
[ROW][C]30[/C][C]0.108261[/C][C]0.9186[/C][C]0.18068[/C][/ROW]
[ROW][C]31[/C][C]-0.027011[/C][C]-0.2292[/C][C]0.409684[/C][/ROW]
[ROW][C]32[/C][C]0.066782[/C][C]0.5667[/C][C]0.286352[/C][/ROW]
[ROW][C]33[/C][C]0.070472[/C][C]0.598[/C][C]0.275866[/C][/ROW]
[ROW][C]34[/C][C]-0.053222[/C][C]-0.4516[/C][C]0.326455[/C][/ROW]
[ROW][C]35[/C][C]-0.048662[/C][C]-0.4129[/C][C]0.340451[/C][/ROW]
[ROW][C]36[/C][C]0.06057[/C][C]0.514[/C][C]0.30443[/C][/ROW]
[ROW][C]37[/C][C]-0.073195[/C][C]-0.6211[/C][C]0.268255[/C][/ROW]
[ROW][C]38[/C][C]-0.101531[/C][C]-0.8615[/C][C]0.195906[/C][/ROW]
[ROW][C]39[/C][C]-0.115658[/C][C]-0.9814[/C][C]0.164843[/C][/ROW]
[ROW][C]40[/C][C]-0.079382[/C][C]-0.6736[/C][C]0.251368[/C][/ROW]
[ROW][C]41[/C][C]-0.070609[/C][C]-0.5991[/C][C]0.275482[/C][/ROW]
[ROW][C]42[/C][C]-0.103855[/C][C]-0.8812[/C][C]0.19056[/C][/ROW]
[ROW][C]43[/C][C]0.028481[/C][C]0.2417[/C][C]0.404862[/C][/ROW]
[ROW][C]44[/C][C]0.027011[/C][C]0.2292[/C][C]0.409682[/C][/ROW]
[ROW][C]45[/C][C]-0.005347[/C][C]-0.0454[/C][C]0.481969[/C][/ROW]
[ROW][C]46[/C][C]-0.043293[/C][C]-0.3674[/C][C]0.357216[/C][/ROW]
[ROW][C]47[/C][C]0.074259[/C][C]0.6301[/C][C]0.265309[/C][/ROW]
[ROW][C]48[/C][C]-0.141261[/C][C]-1.1986[/C][C]0.1173[/C][/ROW]
[/TABLE]
Source: https://freestatistics.org/blog/index.php?pk=167219&T=2

Globally Unique Identifier (entire table): ba.freestatistics.org/blog/index.php?pk=167219&T=2

As an alternative you can also use a QR Code:  

The GUIDs for individual cells are displayed in the table below:

Partial Autocorrelation Function
Time lag kPACF(k)T-STATP-value
10.9361557.94350
2-0.216253-1.8350.03532
3-0.089161-0.75660.225892
4-0.025041-0.21250.416166
5-0.068309-0.57960.281991
60.0681030.57790.282575
70.069850.59270.277621
8-0.119145-1.0110.157705
9-0.077257-0.65550.257101
100.0324040.2750.39207
110.0207090.17570.430504
12-0.143685-1.21920.113373
13-0.052864-0.44860.327547
140.061110.51850.302837
150.0128820.10930.456632
16-0.046813-0.39720.346189
170.0433590.36790.357007
180.0214570.18210.428019
19-0.040038-0.33970.367522
20-0.0284-0.2410.405128
210.05660.48030.316248
220.0076540.06490.474198
230.0666490.56550.286733
24-0.168897-1.43310.078073
250.0205240.17420.431116
26-0.028862-0.24490.403615
270.0703070.59660.27633
280.000790.00670.497334
290.0642420.54510.293681
300.1082610.91860.18068
31-0.027011-0.22920.409684
320.0667820.56670.286352
330.0704720.5980.275866
34-0.053222-0.45160.326455
35-0.048662-0.41290.340451
360.060570.5140.30443
37-0.073195-0.62110.268255
38-0.101531-0.86150.195906
39-0.115658-0.98140.164843
40-0.079382-0.67360.251368
41-0.070609-0.59910.275482
42-0.103855-0.88120.19056
430.0284810.24170.404862
440.0270110.22920.409682
45-0.005347-0.04540.481969
46-0.043293-0.36740.357216
470.0742590.63010.265309
48-0.141261-1.19860.1173


Parameters (Session):
par1 = 48 ; par2 = 1 ; par3 = 0 ; par4 = 0 ; par5 = 12 ; par6 = White Noise ; par7 = 0.95 ;
Parameters (R input):
par1 = 48 ; par2 = 1 ; par3 = 0 ; par4 = 0 ; par5 = 12 ; par6 = White Noise ; par7 = 0.95 ; par8 = ;
R code (references can be found in the software module):
if (par1 == 'Default') {
par1 = 10*log10(length(x))
} else {
par1 <- as.numeric(par1)
}
par2 <- as.numeric(par2)
par3 <- as.numeric(par3)
par4 <- as.numeric(par4)
par5 <- as.numeric(par5)
if (par6 == 'White Noise') par6 <- 'white' else par6 <- 'ma'
par7 <- as.numeric(par7)
if (par8 != '') par8 <- as.numeric(par8)
ox <- x
if (par8 == '') {
if (par2 == 0) {
x <- log(x)
} else {
x <- (x ^ par2 - 1) / par2
}
} else {
x <- log(x,base=par8)
}
if (par3 > 0) x <- diff(x,lag=1,difference=par3)
if (par4 > 0) x <- diff(x,lag=par5,difference=par4)
bitmap(file='picts.png')
op <- par(mfrow=c(2,1))
plot(ox,type='l',main='Original Time Series',xlab='time',ylab='value')
if (par8=='') {
mytitle <- paste('Working Time Series (lambda=',par2,', d=',par3,', D=',par4,')',sep='')
mysub <- paste('(lambda=',par2,', d=',par3,', D=',par4,', CI=', par7, ', CI type=',par6,')',sep='')
} else {
mytitle <- paste('Working Time Series (base=',par8,', d=',par3,', D=',par4,')',sep='')
mysub <- paste('(base=',par8,', d=',par3,', D=',par4,', CI=', par7, ', CI type=',par6,')',sep='')
}
plot(x,type='l', main=mytitle,xlab='time',ylab='value')
par(op)
dev.off()
bitmap(file='pic1.png')
racf <- acf(x, par1, main='Autocorrelation', xlab='time lag', ylab='ACF', ci.type=par6, ci=par7, sub=mysub)
dev.off()
bitmap(file='pic2.png')
rpacf <- pacf(x,par1,main='Partial Autocorrelation',xlab='lags',ylab='PACF',sub=mysub)
dev.off()
(myacf <- c(racf$acf))
(mypacf <- c(rpacf$acf))
lengthx <- length(x)
sqrtn <- sqrt(lengthx)
load(file='createtable')
a<-table.start()
a<-table.row.start(a)
a<-table.element(a,'Autocorrelation Function',4,TRUE)
a<-table.row.end(a)
a<-table.row.start(a)
a<-table.element(a,'Time lag k',header=TRUE)
a<-table.element(a,hyperlink('basics.htm','ACF(k)','click here for more information about the Autocorrelation Function'),header=TRUE)
a<-table.element(a,'T-STAT',header=TRUE)
a<-table.element(a,'P-value',header=TRUE)
a<-table.row.end(a)
for (i in 2:(par1+1)) {
a<-table.row.start(a)
a<-table.element(a,i-1,header=TRUE)
a<-table.element(a,round(myacf[i],6))
mytstat <- myacf[i]*sqrtn
a<-table.element(a,round(mytstat,4))
a<-table.element(a,round(1-pt(abs(mytstat),lengthx),6))
a<-table.row.end(a)
}
a<-table.end(a)
table.save(a,file='mytable.tab')
a<-table.start()
a<-table.row.start(a)
a<-table.element(a,'Partial Autocorrelation Function',4,TRUE)
a<-table.row.end(a)
a<-table.row.start(a)
a<-table.element(a,'Time lag k',header=TRUE)
a<-table.element(a,hyperlink('basics.htm','PACF(k)','click here for more information about the Partial Autocorrelation Function'),header=TRUE)
a<-table.element(a,'T-STAT',header=TRUE)
a<-table.element(a,'P-value',header=TRUE)
a<-table.row.end(a)
for (i in 1:par1) {
a<-table.row.start(a)
a<-table.element(a,i,header=TRUE)
a<-table.element(a,round(mypacf[i],6))
mytstat <- mypacf[i]*sqrtn
a<-table.element(a,round(mytstat,4))
a<-table.element(a,round(1-pt(abs(mytstat),lengthx),6))
a<-table.row.end(a)
}
a<-table.end(a)
table.save(a,file='mytable1.tab')