Free Statistics

of Irreproducible Research!

Author's title

Author*Unverified author*
R Software Modulerwasp_exponentialsmoothing.wasp
Title produced by softwareExponential Smoothing
Date of computationWed, 23 May 2012 08:42:56 -0400
Cite this page as followsStatistical Computations at FreeStatistics.org, Office for Research Development and Education, URL https://freestatistics.org/blog/index.php?v=date/2012/May/23/t1337777017wm28e8eibqe80un.htm/, Retrieved Sun, 28 Apr 2024 21:02:35 +0000
Statistical Computations at FreeStatistics.org, Office for Research Development and Education, URL https://freestatistics.org/blog/index.php?pk=167180, Retrieved Sun, 28 Apr 2024 21:02:35 +0000
QR Codes:

Original text written by user:
IsPrivate?No (this computation is public)
User-defined keywords
Estimated Impact96
Family? (F = Feedback message, R = changed R code, M = changed R Module, P = changed Parameters, D = changed Data)
-       [Exponential Smoothing] [Exponential Smoot...] [2012-05-23 12:42:56] [76c30f62b7052b57088120e90a652e05] [Current]
Feedback Forum

Post a new message
Dataseries X:
86,9
85,8
84,4
80,4
84,4
90,7
91,6
91,9
92,5
92,5
92
92
94,5
95,5
96,3
100
103,1
109,2
108,7
107,5
104,5
103,8
102,5
100,8
100,7
102,7
106,5
105,5
110,1
110,1
109
106,9
108
106,1
101,7
100,6
102,6
100,5
105,2
104,3
104,1
104,8
105,2
102,7
101
93,9
90,2
92,4
94,4
93,3
93,9
95,1
97,6
99,3
101,1
100,6
99,3
97
96,4
98,7


Summary of computational transaction
Raw Inputview raw input (R code)
Raw Outputview raw output of R engine
Computing time2 seconds
R Server'Herman Ole Andreas Wold' @ wold.wessa.net

\begin{tabular}{lllllllll}
\hline
Summary of computational transaction \tabularnewline
Raw Input & view raw input (R code)  \tabularnewline
Raw Output & view raw output of R engine  \tabularnewline
Computing time & 2 seconds \tabularnewline
R Server & 'Herman Ole Andreas Wold' @ wold.wessa.net \tabularnewline
\hline
\end{tabular}
%Source: https://freestatistics.org/blog/index.php?pk=167180&T=0

[TABLE]
[ROW][C]Summary of computational transaction[/C][/ROW]
[ROW][C]Raw Input[/C][C]view raw input (R code) [/C][/ROW]
[ROW][C]Raw Output[/C][C]view raw output of R engine [/C][/ROW]
[ROW][C]Computing time[/C][C]2 seconds[/C][/ROW]
[ROW][C]R Server[/C][C]'Herman Ole Andreas Wold' @ wold.wessa.net[/C][/ROW]
[/TABLE]
Source: https://freestatistics.org/blog/index.php?pk=167180&T=0

Globally Unique Identifier (entire table): ba.freestatistics.org/blog/index.php?pk=167180&T=0

As an alternative you can also use a QR Code:  

The GUIDs for individual cells are displayed in the table below:

Summary of computational transaction
Raw Inputview raw input (R code)
Raw Outputview raw output of R engine
Computing time2 seconds
R Server'Herman Ole Andreas Wold' @ wold.wessa.net


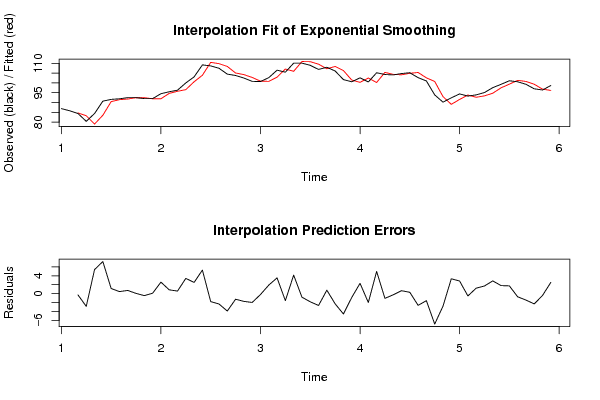
Estimated Parameters of Exponential Smoothing
ParameterValue
alpha1
beta0.0906896726281195
gammaFALSE

\begin{tabular}{lllllllll}
\hline
Estimated Parameters of Exponential Smoothing \tabularnewline
Parameter & Value \tabularnewline
alpha & 1 \tabularnewline
beta & 0.0906896726281195 \tabularnewline
gamma & FALSE \tabularnewline
\hline
\end{tabular}
%Source: https://freestatistics.org/blog/index.php?pk=167180&T=1

[TABLE]
[ROW][C]Estimated Parameters of Exponential Smoothing[/C][/ROW]
[ROW][C]Parameter[/C][C]Value[/C][/ROW]
[ROW][C]alpha[/C][C]1[/C][/ROW]
[ROW][C]beta[/C][C]0.0906896726281195[/C][/ROW]
[ROW][C]gamma[/C][C]FALSE[/C][/ROW]
[/TABLE]
Source: https://freestatistics.org/blog/index.php?pk=167180&T=1

Globally Unique Identifier (entire table): ba.freestatistics.org/blog/index.php?pk=167180&T=1

As an alternative you can also use a QR Code:  

The GUIDs for individual cells are displayed in the table below:

Estimated Parameters of Exponential Smoothing
ParameterValue
alpha1
beta0.0906896726281195
gammaFALSE


Interpolation Forecasts of Exponential Smoothing
tObservedFittedResiduals
384.484.7-0.299999999999983
480.483.2727930982116-2.87279309821156
584.479.01226043260645.38773956739357
690.783.50087277017897.19912722982107
791.690.45375926185961.14624073814042
891.991.45771145915450.442288540845468
992.591.7978224621310.702177537869005
1092.592.46150271316710.0384972868328504
119292.4649940195071-0.464994019507088
129291.9228238641040.077176135896039
1394.591.92982294260312.57017705739693
1495.594.66291145853470.837088541465292
1596.395.73882674432090.561173255679051
1610096.58971936316613.41028063683387
17103.1100.5989965976912.50100340230938
18109.2103.9258117774885.27418822251215
19108.7110.504126180767-1.80412618076657
20107.5109.840510568053-2.34051056805303
21104.5108.428250430854-3.92825043085365
22103.8105.071998685278-1.27199868527826
23102.5104.256641540927-1.75664154092698
24100.8102.797332294655-1.99733229465535
25100.7100.916194882723-0.216194882723485
26102.7100.7965882395851.90341176041458
27106.5102.9692080290143.53079197098606
28105.5107.089414396981-1.58941439698066
29110.1105.9452709256484.15472907435193
30110.1110.92206194526-0.822061945259563
31109110.847509416564-1.84750941656394
32106.9109.579959392398-2.67995939239839
33108107.2369147524450.763085247554869
34106.1108.406118703733-2.30611870373323
35101.7106.29697755345-4.59697755345006
36100.6101.480079164049-0.88007916404888
37102.6100.3002650727742.29973492722554
38100.5102.508827280456-2.00882728045599
39105.2100.2266473920254.973352607975
40104.3105.377679111906-1.07767911190646
41104.1104.379944746049-0.279944746049495
42104.8104.1545566486760.645443351323692
43105.2104.9130916949080.286908305092155
44102.7105.339111315171-2.63911131517095
45101102.599771173969-1.59977117396893
4693.9100.754688449922-6.85468844992178
4790.293.0330389984306-2.83303899843062
4892.489.07611161912033.32388838087975
4994.491.57755396823472.82244603176535
5093.393.833520674866-0.533520674865997
5193.992.6851358595221.21486414047796
5295.193.39531149070961.70468850929035
5397.694.74990913355012.8500908664499
5499.397.50838294118881.79161705881117
55101.199.37086410572741.72913589427263
56100.6101.327678873908-0.727678873908488
5799.3100.761685915055-1.46168591505533
589799.3291260979338-2.32912609793382
5996.496.8178984146026-0.41789841460259
6098.796.17999934419052.52000065580951

\begin{tabular}{lllllllll}
\hline
Interpolation Forecasts of Exponential Smoothing \tabularnewline
t & Observed & Fitted & Residuals \tabularnewline
3 & 84.4 & 84.7 & -0.299999999999983 \tabularnewline
4 & 80.4 & 83.2727930982116 & -2.87279309821156 \tabularnewline
5 & 84.4 & 79.0122604326064 & 5.38773956739357 \tabularnewline
6 & 90.7 & 83.5008727701789 & 7.19912722982107 \tabularnewline
7 & 91.6 & 90.4537592618596 & 1.14624073814042 \tabularnewline
8 & 91.9 & 91.4577114591545 & 0.442288540845468 \tabularnewline
9 & 92.5 & 91.797822462131 & 0.702177537869005 \tabularnewline
10 & 92.5 & 92.4615027131671 & 0.0384972868328504 \tabularnewline
11 & 92 & 92.4649940195071 & -0.464994019507088 \tabularnewline
12 & 92 & 91.922823864104 & 0.077176135896039 \tabularnewline
13 & 94.5 & 91.9298229426031 & 2.57017705739693 \tabularnewline
14 & 95.5 & 94.6629114585347 & 0.837088541465292 \tabularnewline
15 & 96.3 & 95.7388267443209 & 0.561173255679051 \tabularnewline
16 & 100 & 96.5897193631661 & 3.41028063683387 \tabularnewline
17 & 103.1 & 100.598996597691 & 2.50100340230938 \tabularnewline
18 & 109.2 & 103.925811777488 & 5.27418822251215 \tabularnewline
19 & 108.7 & 110.504126180767 & -1.80412618076657 \tabularnewline
20 & 107.5 & 109.840510568053 & -2.34051056805303 \tabularnewline
21 & 104.5 & 108.428250430854 & -3.92825043085365 \tabularnewline
22 & 103.8 & 105.071998685278 & -1.27199868527826 \tabularnewline
23 & 102.5 & 104.256641540927 & -1.75664154092698 \tabularnewline
24 & 100.8 & 102.797332294655 & -1.99733229465535 \tabularnewline
25 & 100.7 & 100.916194882723 & -0.216194882723485 \tabularnewline
26 & 102.7 & 100.796588239585 & 1.90341176041458 \tabularnewline
27 & 106.5 & 102.969208029014 & 3.53079197098606 \tabularnewline
28 & 105.5 & 107.089414396981 & -1.58941439698066 \tabularnewline
29 & 110.1 & 105.945270925648 & 4.15472907435193 \tabularnewline
30 & 110.1 & 110.92206194526 & -0.822061945259563 \tabularnewline
31 & 109 & 110.847509416564 & -1.84750941656394 \tabularnewline
32 & 106.9 & 109.579959392398 & -2.67995939239839 \tabularnewline
33 & 108 & 107.236914752445 & 0.763085247554869 \tabularnewline
34 & 106.1 & 108.406118703733 & -2.30611870373323 \tabularnewline
35 & 101.7 & 106.29697755345 & -4.59697755345006 \tabularnewline
36 & 100.6 & 101.480079164049 & -0.88007916404888 \tabularnewline
37 & 102.6 & 100.300265072774 & 2.29973492722554 \tabularnewline
38 & 100.5 & 102.508827280456 & -2.00882728045599 \tabularnewline
39 & 105.2 & 100.226647392025 & 4.973352607975 \tabularnewline
40 & 104.3 & 105.377679111906 & -1.07767911190646 \tabularnewline
41 & 104.1 & 104.379944746049 & -0.279944746049495 \tabularnewline
42 & 104.8 & 104.154556648676 & 0.645443351323692 \tabularnewline
43 & 105.2 & 104.913091694908 & 0.286908305092155 \tabularnewline
44 & 102.7 & 105.339111315171 & -2.63911131517095 \tabularnewline
45 & 101 & 102.599771173969 & -1.59977117396893 \tabularnewline
46 & 93.9 & 100.754688449922 & -6.85468844992178 \tabularnewline
47 & 90.2 & 93.0330389984306 & -2.83303899843062 \tabularnewline
48 & 92.4 & 89.0761116191203 & 3.32388838087975 \tabularnewline
49 & 94.4 & 91.5775539682347 & 2.82244603176535 \tabularnewline
50 & 93.3 & 93.833520674866 & -0.533520674865997 \tabularnewline
51 & 93.9 & 92.685135859522 & 1.21486414047796 \tabularnewline
52 & 95.1 & 93.3953114907096 & 1.70468850929035 \tabularnewline
53 & 97.6 & 94.7499091335501 & 2.8500908664499 \tabularnewline
54 & 99.3 & 97.5083829411888 & 1.79161705881117 \tabularnewline
55 & 101.1 & 99.3708641057274 & 1.72913589427263 \tabularnewline
56 & 100.6 & 101.327678873908 & -0.727678873908488 \tabularnewline
57 & 99.3 & 100.761685915055 & -1.46168591505533 \tabularnewline
58 & 97 & 99.3291260979338 & -2.32912609793382 \tabularnewline
59 & 96.4 & 96.8178984146026 & -0.41789841460259 \tabularnewline
60 & 98.7 & 96.1799993441905 & 2.52000065580951 \tabularnewline
\hline
\end{tabular}
%Source: https://freestatistics.org/blog/index.php?pk=167180&T=2

[TABLE]
[ROW][C]Interpolation Forecasts of Exponential Smoothing[/C][/ROW]
[ROW][C]t[/C][C]Observed[/C][C]Fitted[/C][C]Residuals[/C][/ROW]
[ROW][C]3[/C][C]84.4[/C][C]84.7[/C][C]-0.299999999999983[/C][/ROW]
[ROW][C]4[/C][C]80.4[/C][C]83.2727930982116[/C][C]-2.87279309821156[/C][/ROW]
[ROW][C]5[/C][C]84.4[/C][C]79.0122604326064[/C][C]5.38773956739357[/C][/ROW]
[ROW][C]6[/C][C]90.7[/C][C]83.5008727701789[/C][C]7.19912722982107[/C][/ROW]
[ROW][C]7[/C][C]91.6[/C][C]90.4537592618596[/C][C]1.14624073814042[/C][/ROW]
[ROW][C]8[/C][C]91.9[/C][C]91.4577114591545[/C][C]0.442288540845468[/C][/ROW]
[ROW][C]9[/C][C]92.5[/C][C]91.797822462131[/C][C]0.702177537869005[/C][/ROW]
[ROW][C]10[/C][C]92.5[/C][C]92.4615027131671[/C][C]0.0384972868328504[/C][/ROW]
[ROW][C]11[/C][C]92[/C][C]92.4649940195071[/C][C]-0.464994019507088[/C][/ROW]
[ROW][C]12[/C][C]92[/C][C]91.922823864104[/C][C]0.077176135896039[/C][/ROW]
[ROW][C]13[/C][C]94.5[/C][C]91.9298229426031[/C][C]2.57017705739693[/C][/ROW]
[ROW][C]14[/C][C]95.5[/C][C]94.6629114585347[/C][C]0.837088541465292[/C][/ROW]
[ROW][C]15[/C][C]96.3[/C][C]95.7388267443209[/C][C]0.561173255679051[/C][/ROW]
[ROW][C]16[/C][C]100[/C][C]96.5897193631661[/C][C]3.41028063683387[/C][/ROW]
[ROW][C]17[/C][C]103.1[/C][C]100.598996597691[/C][C]2.50100340230938[/C][/ROW]
[ROW][C]18[/C][C]109.2[/C][C]103.925811777488[/C][C]5.27418822251215[/C][/ROW]
[ROW][C]19[/C][C]108.7[/C][C]110.504126180767[/C][C]-1.80412618076657[/C][/ROW]
[ROW][C]20[/C][C]107.5[/C][C]109.840510568053[/C][C]-2.34051056805303[/C][/ROW]
[ROW][C]21[/C][C]104.5[/C][C]108.428250430854[/C][C]-3.92825043085365[/C][/ROW]
[ROW][C]22[/C][C]103.8[/C][C]105.071998685278[/C][C]-1.27199868527826[/C][/ROW]
[ROW][C]23[/C][C]102.5[/C][C]104.256641540927[/C][C]-1.75664154092698[/C][/ROW]
[ROW][C]24[/C][C]100.8[/C][C]102.797332294655[/C][C]-1.99733229465535[/C][/ROW]
[ROW][C]25[/C][C]100.7[/C][C]100.916194882723[/C][C]-0.216194882723485[/C][/ROW]
[ROW][C]26[/C][C]102.7[/C][C]100.796588239585[/C][C]1.90341176041458[/C][/ROW]
[ROW][C]27[/C][C]106.5[/C][C]102.969208029014[/C][C]3.53079197098606[/C][/ROW]
[ROW][C]28[/C][C]105.5[/C][C]107.089414396981[/C][C]-1.58941439698066[/C][/ROW]
[ROW][C]29[/C][C]110.1[/C][C]105.945270925648[/C][C]4.15472907435193[/C][/ROW]
[ROW][C]30[/C][C]110.1[/C][C]110.92206194526[/C][C]-0.822061945259563[/C][/ROW]
[ROW][C]31[/C][C]109[/C][C]110.847509416564[/C][C]-1.84750941656394[/C][/ROW]
[ROW][C]32[/C][C]106.9[/C][C]109.579959392398[/C][C]-2.67995939239839[/C][/ROW]
[ROW][C]33[/C][C]108[/C][C]107.236914752445[/C][C]0.763085247554869[/C][/ROW]
[ROW][C]34[/C][C]106.1[/C][C]108.406118703733[/C][C]-2.30611870373323[/C][/ROW]
[ROW][C]35[/C][C]101.7[/C][C]106.29697755345[/C][C]-4.59697755345006[/C][/ROW]
[ROW][C]36[/C][C]100.6[/C][C]101.480079164049[/C][C]-0.88007916404888[/C][/ROW]
[ROW][C]37[/C][C]102.6[/C][C]100.300265072774[/C][C]2.29973492722554[/C][/ROW]
[ROW][C]38[/C][C]100.5[/C][C]102.508827280456[/C][C]-2.00882728045599[/C][/ROW]
[ROW][C]39[/C][C]105.2[/C][C]100.226647392025[/C][C]4.973352607975[/C][/ROW]
[ROW][C]40[/C][C]104.3[/C][C]105.377679111906[/C][C]-1.07767911190646[/C][/ROW]
[ROW][C]41[/C][C]104.1[/C][C]104.379944746049[/C][C]-0.279944746049495[/C][/ROW]
[ROW][C]42[/C][C]104.8[/C][C]104.154556648676[/C][C]0.645443351323692[/C][/ROW]
[ROW][C]43[/C][C]105.2[/C][C]104.913091694908[/C][C]0.286908305092155[/C][/ROW]
[ROW][C]44[/C][C]102.7[/C][C]105.339111315171[/C][C]-2.63911131517095[/C][/ROW]
[ROW][C]45[/C][C]101[/C][C]102.599771173969[/C][C]-1.59977117396893[/C][/ROW]
[ROW][C]46[/C][C]93.9[/C][C]100.754688449922[/C][C]-6.85468844992178[/C][/ROW]
[ROW][C]47[/C][C]90.2[/C][C]93.0330389984306[/C][C]-2.83303899843062[/C][/ROW]
[ROW][C]48[/C][C]92.4[/C][C]89.0761116191203[/C][C]3.32388838087975[/C][/ROW]
[ROW][C]49[/C][C]94.4[/C][C]91.5775539682347[/C][C]2.82244603176535[/C][/ROW]
[ROW][C]50[/C][C]93.3[/C][C]93.833520674866[/C][C]-0.533520674865997[/C][/ROW]
[ROW][C]51[/C][C]93.9[/C][C]92.685135859522[/C][C]1.21486414047796[/C][/ROW]
[ROW][C]52[/C][C]95.1[/C][C]93.3953114907096[/C][C]1.70468850929035[/C][/ROW]
[ROW][C]53[/C][C]97.6[/C][C]94.7499091335501[/C][C]2.8500908664499[/C][/ROW]
[ROW][C]54[/C][C]99.3[/C][C]97.5083829411888[/C][C]1.79161705881117[/C][/ROW]
[ROW][C]55[/C][C]101.1[/C][C]99.3708641057274[/C][C]1.72913589427263[/C][/ROW]
[ROW][C]56[/C][C]100.6[/C][C]101.327678873908[/C][C]-0.727678873908488[/C][/ROW]
[ROW][C]57[/C][C]99.3[/C][C]100.761685915055[/C][C]-1.46168591505533[/C][/ROW]
[ROW][C]58[/C][C]97[/C][C]99.3291260979338[/C][C]-2.32912609793382[/C][/ROW]
[ROW][C]59[/C][C]96.4[/C][C]96.8178984146026[/C][C]-0.41789841460259[/C][/ROW]
[ROW][C]60[/C][C]98.7[/C][C]96.1799993441905[/C][C]2.52000065580951[/C][/ROW]
[/TABLE]
Source: https://freestatistics.org/blog/index.php?pk=167180&T=2

Globally Unique Identifier (entire table): ba.freestatistics.org/blog/index.php?pk=167180&T=2

As an alternative you can also use a QR Code:  

The GUIDs for individual cells are displayed in the table below:

Interpolation Forecasts of Exponential Smoothing
tObservedFittedResiduals
384.484.7-0.299999999999983
480.483.2727930982116-2.87279309821156
584.479.01226043260645.38773956739357
690.783.50087277017897.19912722982107
791.690.45375926185961.14624073814042
891.991.45771145915450.442288540845468
992.591.7978224621310.702177537869005
1092.592.46150271316710.0384972868328504
119292.4649940195071-0.464994019507088
129291.9228238641040.077176135896039
1394.591.92982294260312.57017705739693
1495.594.66291145853470.837088541465292
1596.395.73882674432090.561173255679051
1610096.58971936316613.41028063683387
17103.1100.5989965976912.50100340230938
18109.2103.9258117774885.27418822251215
19108.7110.504126180767-1.80412618076657
20107.5109.840510568053-2.34051056805303
21104.5108.428250430854-3.92825043085365
22103.8105.071998685278-1.27199868527826
23102.5104.256641540927-1.75664154092698
24100.8102.797332294655-1.99733229465535
25100.7100.916194882723-0.216194882723485
26102.7100.7965882395851.90341176041458
27106.5102.9692080290143.53079197098606
28105.5107.089414396981-1.58941439698066
29110.1105.9452709256484.15472907435193
30110.1110.92206194526-0.822061945259563
31109110.847509416564-1.84750941656394
32106.9109.579959392398-2.67995939239839
33108107.2369147524450.763085247554869
34106.1108.406118703733-2.30611870373323
35101.7106.29697755345-4.59697755345006
36100.6101.480079164049-0.88007916404888
37102.6100.3002650727742.29973492722554
38100.5102.508827280456-2.00882728045599
39105.2100.2266473920254.973352607975
40104.3105.377679111906-1.07767911190646
41104.1104.379944746049-0.279944746049495
42104.8104.1545566486760.645443351323692
43105.2104.9130916949080.286908305092155
44102.7105.339111315171-2.63911131517095
45101102.599771173969-1.59977117396893
4693.9100.754688449922-6.85468844992178
4790.293.0330389984306-2.83303899843062
4892.489.07611161912033.32388838087975
4994.491.57755396823472.82244603176535
5093.393.833520674866-0.533520674865997
5193.992.6851358595221.21486414047796
5295.193.39531149070961.70468850929035
5397.694.74990913355012.8500908664499
5499.397.50838294118881.79161705881117
55101.199.37086410572741.72913589427263
56100.6101.327678873908-0.727678873908488
5799.3100.761685915055-1.46168591505533
589799.3291260979338-2.32912609793382
5996.496.8178984146026-0.41789841460259
6098.796.17999934419052.52000065580951


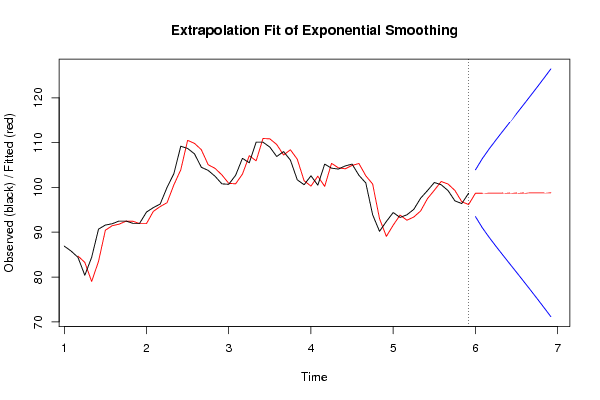
Extrapolation Forecasts of Exponential Smoothing
tForecast95% Lower Bound95% Upper Bound
6198.708537378688593.4971265055743103.919948251803
6298.71707475737791.0055883064468106.428561208307
6398.725612136065588.857917294882108.593306977249
6498.73414951475486.8463961790202110.621902850488
6598.742686893442584.8951023222695112.590271464615
6698.75122427213182.967406602516114.535041941746
6798.759761650819481.0429525085907116.476570793048
6898.768299029507979.1094176316606118.427180427355
6998.776836408196477.1589152171943120.394757599199
7098.785373786884975.186205070705122.384542503065
7198.793911165573473.1877185213518124.400103809795
7298.802448544261971.160989266024126.4439078225

\begin{tabular}{lllllllll}
\hline
Extrapolation Forecasts of Exponential Smoothing \tabularnewline
t & Forecast & 95% Lower Bound & 95% Upper Bound \tabularnewline
61 & 98.7085373786885 & 93.4971265055743 & 103.919948251803 \tabularnewline
62 & 98.717074757377 & 91.0055883064468 & 106.428561208307 \tabularnewline
63 & 98.7256121360655 & 88.857917294882 & 108.593306977249 \tabularnewline
64 & 98.734149514754 & 86.8463961790202 & 110.621902850488 \tabularnewline
65 & 98.7426868934425 & 84.8951023222695 & 112.590271464615 \tabularnewline
66 & 98.751224272131 & 82.967406602516 & 114.535041941746 \tabularnewline
67 & 98.7597616508194 & 81.0429525085907 & 116.476570793048 \tabularnewline
68 & 98.7682990295079 & 79.1094176316606 & 118.427180427355 \tabularnewline
69 & 98.7768364081964 & 77.1589152171943 & 120.394757599199 \tabularnewline
70 & 98.7853737868849 & 75.186205070705 & 122.384542503065 \tabularnewline
71 & 98.7939111655734 & 73.1877185213518 & 124.400103809795 \tabularnewline
72 & 98.8024485442619 & 71.160989266024 & 126.4439078225 \tabularnewline
\hline
\end{tabular}
%Source: https://freestatistics.org/blog/index.php?pk=167180&T=3

[TABLE]
[ROW][C]Extrapolation Forecasts of Exponential Smoothing[/C][/ROW]
[ROW][C]t[/C][C]Forecast[/C][C]95% Lower Bound[/C][C]95% Upper Bound[/C][/ROW]
[ROW][C]61[/C][C]98.7085373786885[/C][C]93.4971265055743[/C][C]103.919948251803[/C][/ROW]
[ROW][C]62[/C][C]98.717074757377[/C][C]91.0055883064468[/C][C]106.428561208307[/C][/ROW]
[ROW][C]63[/C][C]98.7256121360655[/C][C]88.857917294882[/C][C]108.593306977249[/C][/ROW]
[ROW][C]64[/C][C]98.734149514754[/C][C]86.8463961790202[/C][C]110.621902850488[/C][/ROW]
[ROW][C]65[/C][C]98.7426868934425[/C][C]84.8951023222695[/C][C]112.590271464615[/C][/ROW]
[ROW][C]66[/C][C]98.751224272131[/C][C]82.967406602516[/C][C]114.535041941746[/C][/ROW]
[ROW][C]67[/C][C]98.7597616508194[/C][C]81.0429525085907[/C][C]116.476570793048[/C][/ROW]
[ROW][C]68[/C][C]98.7682990295079[/C][C]79.1094176316606[/C][C]118.427180427355[/C][/ROW]
[ROW][C]69[/C][C]98.7768364081964[/C][C]77.1589152171943[/C][C]120.394757599199[/C][/ROW]
[ROW][C]70[/C][C]98.7853737868849[/C][C]75.186205070705[/C][C]122.384542503065[/C][/ROW]
[ROW][C]71[/C][C]98.7939111655734[/C][C]73.1877185213518[/C][C]124.400103809795[/C][/ROW]
[ROW][C]72[/C][C]98.8024485442619[/C][C]71.160989266024[/C][C]126.4439078225[/C][/ROW]
[/TABLE]
Source: https://freestatistics.org/blog/index.php?pk=167180&T=3

Globally Unique Identifier (entire table): ba.freestatistics.org/blog/index.php?pk=167180&T=3

As an alternative you can also use a QR Code:  

The GUIDs for individual cells are displayed in the table below:

Extrapolation Forecasts of Exponential Smoothing
tForecast95% Lower Bound95% Upper Bound
6198.708537378688593.4971265055743103.919948251803
6298.71707475737791.0055883064468106.428561208307
6398.725612136065588.857917294882108.593306977249
6498.73414951475486.8463961790202110.621902850488
6598.742686893442584.8951023222695112.590271464615
6698.75122427213182.967406602516114.535041941746
6798.759761650819481.0429525085907116.476570793048
6898.768299029507979.1094176316606118.427180427355
6998.776836408196477.1589152171943120.394757599199
7098.785373786884975.186205070705122.384542503065
7198.793911165573473.1877185213518124.400103809795
7298.802448544261971.160989266024126.4439078225


Parameters (Session):
par1 = 12 ; par2 = Double ; par3 = multiplicative ;
Parameters (R input):
par1 = 12 ; par2 = Double ; par3 = multiplicative ;
R code (references can be found in the software module):
par1 <- as.numeric(par1)
if (par2 == 'Single') K <- 1
if (par2 == 'Double') K <- 2
if (par2 == 'Triple') K <- par1
nx <- length(x)
nxmK <- nx - K
x <- ts(x, frequency = par1)
if (par2 == 'Single') fit <- HoltWinters(x, gamma=F, beta=F)
if (par2 == 'Double') fit <- HoltWinters(x, gamma=F)
if (par2 == 'Triple') fit <- HoltWinters(x, seasonal=par3)
fit
myresid <- x - fit$fitted[,'xhat']
bitmap(file='test1.png')
op <- par(mfrow=c(2,1))
plot(fit,ylab='Observed (black) / Fitted (red)',main='Interpolation Fit of Exponential Smoothing')
plot(myresid,ylab='Residuals',main='Interpolation Prediction Errors')
par(op)
dev.off()
bitmap(file='test2.png')
p <- predict(fit, par1, prediction.interval=TRUE)
np <- length(p[,1])
plot(fit,p,ylab='Observed (black) / Fitted (red)',main='Extrapolation Fit of Exponential Smoothing')
dev.off()
bitmap(file='test3.png')
op <- par(mfrow = c(2,2))
acf(as.numeric(myresid),lag.max = nx/2,main='Residual ACF')
spectrum(myresid,main='Residals Periodogram')
cpgram(myresid,main='Residal Cumulative Periodogram')
qqnorm(myresid,main='Residual Normal QQ Plot')
qqline(myresid)
par(op)
dev.off()
load(file='createtable')
a<-table.start()
a<-table.row.start(a)
a<-table.element(a,'Estimated Parameters of Exponential Smoothing',2,TRUE)
a<-table.row.end(a)
a<-table.row.start(a)
a<-table.element(a,'Parameter',header=TRUE)
a<-table.element(a,'Value',header=TRUE)
a<-table.row.end(a)
a<-table.row.start(a)
a<-table.element(a,'alpha',header=TRUE)
a<-table.element(a,fit$alpha)
a<-table.row.end(a)
a<-table.row.start(a)
a<-table.element(a,'beta',header=TRUE)
a<-table.element(a,fit$beta)
a<-table.row.end(a)
a<-table.row.start(a)
a<-table.element(a,'gamma',header=TRUE)
a<-table.element(a,fit$gamma)
a<-table.row.end(a)
a<-table.end(a)
table.save(a,file='mytable.tab')
a<-table.start()
a<-table.row.start(a)
a<-table.element(a,'Interpolation Forecasts of Exponential Smoothing',4,TRUE)
a<-table.row.end(a)
a<-table.row.start(a)
a<-table.element(a,'t',header=TRUE)
a<-table.element(a,'Observed',header=TRUE)
a<-table.element(a,'Fitted',header=TRUE)
a<-table.element(a,'Residuals',header=TRUE)
a<-table.row.end(a)
for (i in 1:nxmK) {
a<-table.row.start(a)
a<-table.element(a,i+K,header=TRUE)
a<-table.element(a,x[i+K])
a<-table.element(a,fit$fitted[i,'xhat'])
a<-table.element(a,myresid[i])
a<-table.row.end(a)
}
a<-table.end(a)
table.save(a,file='mytable1.tab')
a<-table.start()
a<-table.row.start(a)
a<-table.element(a,'Extrapolation Forecasts of Exponential Smoothing',4,TRUE)
a<-table.row.end(a)
a<-table.row.start(a)
a<-table.element(a,'t',header=TRUE)
a<-table.element(a,'Forecast',header=TRUE)
a<-table.element(a,'95% Lower Bound',header=TRUE)
a<-table.element(a,'95% Upper Bound',header=TRUE)
a<-table.row.end(a)
for (i in 1:np) {
a<-table.row.start(a)
a<-table.element(a,nx+i,header=TRUE)
a<-table.element(a,p[i,'fit'])
a<-table.element(a,p[i,'lwr'])
a<-table.element(a,p[i,'upr'])
a<-table.row.end(a)
}
a<-table.end(a)
table.save(a,file='mytable2.tab')