Free Statistics

of Irreproducible Research!

Author's title

Author*Unverified author*
R Software Modulerwasp_exponentialsmoothing.wasp
Title produced by softwareExponential Smoothing
Date of computationTue, 22 May 2012 07:36:20 -0400
Cite this page as followsStatistical Computations at FreeStatistics.org, Office for Research Development and Education, URL https://freestatistics.org/blog/index.php?v=date/2012/May/22/t13376866089vzw0msonrt9yvs.htm/, Retrieved Fri, 03 May 2024 16:48:42 +0000
Statistical Computations at FreeStatistics.org, Office for Research Development and Education, URL https://freestatistics.org/blog/index.php?pk=167043, Retrieved Fri, 03 May 2024 16:48:42 +0000
QR Codes:

Original text written by user:
IsPrivate?No (this computation is public)
User-defined keywords
Estimated Impact105
Family? (F = Feedback message, R = changed R code, M = changed R Module, P = changed Parameters, D = changed Data)
-       [Exponential Smoothing] [Triple exponentia...] [2012-05-22 11:36:20] [76c30f62b7052b57088120e90a652e05] [Current]
Feedback Forum

Post a new message
Dataseries X:
402,55
403,04
399,25
401,26
402,76
402,27
402,27
406,11
406,39
407,88
407,77
407,77
407,77
408,06
403,74
403,44
404,3
403,29
403,29
400,66
400,84
401,31
402
402
402
403,33
403,79
403,04
402,91
406,55
406,55
404,69
404,74
404,2
404,18
404,18
404,18
404,82
406,46
407,25
407,34
404,3
404,3
404,7
406,82
406,82
406,76
406,76
406,76
407,67
406,03
401,97
401,84
402,24
402,24
401,57
401,63
402,06
402,11
402,43


Summary of computational transaction
Raw Inputview raw input (R code)
Raw Outputview raw output of R engine
Computing time2 seconds
R Server'Gwilym Jenkins' @ jenkins.wessa.net

\begin{tabular}{lllllllll}
\hline
Summary of computational transaction \tabularnewline
Raw Input & view raw input (R code)  \tabularnewline
Raw Output & view raw output of R engine  \tabularnewline
Computing time & 2 seconds \tabularnewline
R Server & 'Gwilym Jenkins' @ jenkins.wessa.net \tabularnewline
\hline
\end{tabular}
%Source: https://freestatistics.org/blog/index.php?pk=167043&T=0

[TABLE]
[ROW][C]Summary of computational transaction[/C][/ROW]
[ROW][C]Raw Input[/C][C]view raw input (R code) [/C][/ROW]
[ROW][C]Raw Output[/C][C]view raw output of R engine [/C][/ROW]
[ROW][C]Computing time[/C][C]2 seconds[/C][/ROW]
[ROW][C]R Server[/C][C]'Gwilym Jenkins' @ jenkins.wessa.net[/C][/ROW]
[/TABLE]
Source: https://freestatistics.org/blog/index.php?pk=167043&T=0

Globally Unique Identifier (entire table): ba.freestatistics.org/blog/index.php?pk=167043&T=0

As an alternative you can also use a QR Code:  

The GUIDs for individual cells are displayed in the table below:

Summary of computational transaction
Raw Inputview raw input (R code)
Raw Outputview raw output of R engine
Computing time2 seconds
R Server'Gwilym Jenkins' @ jenkins.wessa.net


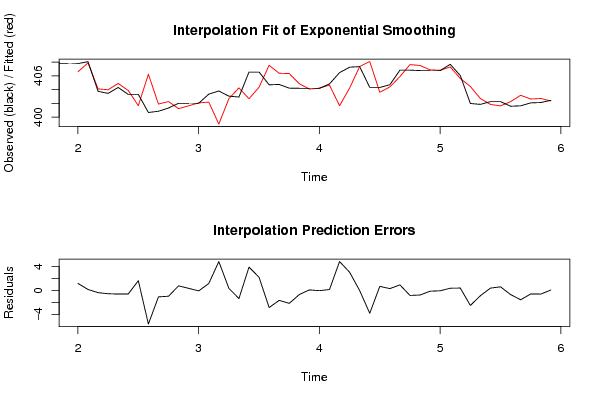
Estimated Parameters of Exponential Smoothing
ParameterValue
alpha0.747001106156908
beta0
gamma1

\begin{tabular}{lllllllll}
\hline
Estimated Parameters of Exponential Smoothing \tabularnewline
Parameter & Value \tabularnewline
alpha & 0.747001106156908 \tabularnewline
beta & 0 \tabularnewline
gamma & 1 \tabularnewline
\hline
\end{tabular}
%Source: https://freestatistics.org/blog/index.php?pk=167043&T=1

[TABLE]
[ROW][C]Estimated Parameters of Exponential Smoothing[/C][/ROW]
[ROW][C]Parameter[/C][C]Value[/C][/ROW]
[ROW][C]alpha[/C][C]0.747001106156908[/C][/ROW]
[ROW][C]beta[/C][C]0[/C][/ROW]
[ROW][C]gamma[/C][C]1[/C][/ROW]
[/TABLE]
Source: https://freestatistics.org/blog/index.php?pk=167043&T=1

Globally Unique Identifier (entire table): ba.freestatistics.org/blog/index.php?pk=167043&T=1

As an alternative you can also use a QR Code:  

The GUIDs for individual cells are displayed in the table below:

Estimated Parameters of Exponential Smoothing
ParameterValue
alpha0.747001106156908
beta0
gamma1


Interpolation Forecasts of Exponential Smoothing
tObservedFittedResiduals
13407.77406.5847061965811.18529380341886
14408.06407.8801627713970.179837228603276
15403.74404.088292172632-0.348292172632341
16403.44403.968574993618-0.52857499361761
17404.3404.883353014573-0.583353014572651
18403.29403.853878459948-0.56387845994783
19403.29401.6527014191691.63729858083053
20400.66406.2245560627-5.56455606269986
21400.84401.887033987798-1.04703398779844
22401.31402.25243923327-0.942439233270022
23402401.2188935427390.781106457260876
24402401.631171722880.368828277119974
25402402.057022334222-0.057022334222097
26403.33402.1700879787881.15991202121222
27403.79398.97671817994.81328182009986
28403.04402.6670911286790.372908871321101
29402.91404.241419815217-1.3314198152172
30406.55402.658065573813.89193442619018
31406.55404.3422810442752.20771895572551
32404.69407.518179080394-2.82817908039397
33404.74406.367661725999-1.62766172599913
34404.2406.325799765967-2.12579976596697
35404.18404.844337601721-0.6643376017214
36404.18404.0725615473830.107438452616634
37404.18404.195413937071-0.0154139370713438
38404.82404.6474441461390.172555853861411
39406.46401.6408167159874.81918328401258
40407.25404.2121886205453.03781137945492
41407.34407.34600915602-0.00600915602046825
42404.3408.074240988372-3.77424098837184
43404.3403.6057102931450.694289706855216
44404.7404.3769983736230.323001626376879
45406.82405.8841460555880.935853944412258
46406.82407.63120476391-0.811204763910382
47406.76407.501494831297-0.741494831297075
48406.76406.86734072916-0.107340729160114
49406.76406.798671313784-0.0386713137843344
50407.67407.2808843859030.389115614097477
51406.03405.6116189361260.418381063873937
52401.97404.444901592886-2.47490159288606
53401.84402.690636211565-0.850636211565075
54402.24401.8345722138050.40542778619465
55402.24401.6187920395450.62120796045474
56401.57402.241552500964-0.671552500964424
57401.63403.160818108224-1.53081810822431
58402.06402.623266144017-0.563266144016552
59402.11402.696403170564-0.586403170563983
60402.43402.3385429969170.0914570030828941

\begin{tabular}{lllllllll}
\hline
Interpolation Forecasts of Exponential Smoothing \tabularnewline
t & Observed & Fitted & Residuals \tabularnewline
13 & 407.77 & 406.584706196581 & 1.18529380341886 \tabularnewline
14 & 408.06 & 407.880162771397 & 0.179837228603276 \tabularnewline
15 & 403.74 & 404.088292172632 & -0.348292172632341 \tabularnewline
16 & 403.44 & 403.968574993618 & -0.52857499361761 \tabularnewline
17 & 404.3 & 404.883353014573 & -0.583353014572651 \tabularnewline
18 & 403.29 & 403.853878459948 & -0.56387845994783 \tabularnewline
19 & 403.29 & 401.652701419169 & 1.63729858083053 \tabularnewline
20 & 400.66 & 406.2245560627 & -5.56455606269986 \tabularnewline
21 & 400.84 & 401.887033987798 & -1.04703398779844 \tabularnewline
22 & 401.31 & 402.25243923327 & -0.942439233270022 \tabularnewline
23 & 402 & 401.218893542739 & 0.781106457260876 \tabularnewline
24 & 402 & 401.63117172288 & 0.368828277119974 \tabularnewline
25 & 402 & 402.057022334222 & -0.057022334222097 \tabularnewline
26 & 403.33 & 402.170087978788 & 1.15991202121222 \tabularnewline
27 & 403.79 & 398.9767181799 & 4.81328182009986 \tabularnewline
28 & 403.04 & 402.667091128679 & 0.372908871321101 \tabularnewline
29 & 402.91 & 404.241419815217 & -1.3314198152172 \tabularnewline
30 & 406.55 & 402.65806557381 & 3.89193442619018 \tabularnewline
31 & 406.55 & 404.342281044275 & 2.20771895572551 \tabularnewline
32 & 404.69 & 407.518179080394 & -2.82817908039397 \tabularnewline
33 & 404.74 & 406.367661725999 & -1.62766172599913 \tabularnewline
34 & 404.2 & 406.325799765967 & -2.12579976596697 \tabularnewline
35 & 404.18 & 404.844337601721 & -0.6643376017214 \tabularnewline
36 & 404.18 & 404.072561547383 & 0.107438452616634 \tabularnewline
37 & 404.18 & 404.195413937071 & -0.0154139370713438 \tabularnewline
38 & 404.82 & 404.647444146139 & 0.172555853861411 \tabularnewline
39 & 406.46 & 401.640816715987 & 4.81918328401258 \tabularnewline
40 & 407.25 & 404.212188620545 & 3.03781137945492 \tabularnewline
41 & 407.34 & 407.34600915602 & -0.00600915602046825 \tabularnewline
42 & 404.3 & 408.074240988372 & -3.77424098837184 \tabularnewline
43 & 404.3 & 403.605710293145 & 0.694289706855216 \tabularnewline
44 & 404.7 & 404.376998373623 & 0.323001626376879 \tabularnewline
45 & 406.82 & 405.884146055588 & 0.935853944412258 \tabularnewline
46 & 406.82 & 407.63120476391 & -0.811204763910382 \tabularnewline
47 & 406.76 & 407.501494831297 & -0.741494831297075 \tabularnewline
48 & 406.76 & 406.86734072916 & -0.107340729160114 \tabularnewline
49 & 406.76 & 406.798671313784 & -0.0386713137843344 \tabularnewline
50 & 407.67 & 407.280884385903 & 0.389115614097477 \tabularnewline
51 & 406.03 & 405.611618936126 & 0.418381063873937 \tabularnewline
52 & 401.97 & 404.444901592886 & -2.47490159288606 \tabularnewline
53 & 401.84 & 402.690636211565 & -0.850636211565075 \tabularnewline
54 & 402.24 & 401.834572213805 & 0.40542778619465 \tabularnewline
55 & 402.24 & 401.618792039545 & 0.62120796045474 \tabularnewline
56 & 401.57 & 402.241552500964 & -0.671552500964424 \tabularnewline
57 & 401.63 & 403.160818108224 & -1.53081810822431 \tabularnewline
58 & 402.06 & 402.623266144017 & -0.563266144016552 \tabularnewline
59 & 402.11 & 402.696403170564 & -0.586403170563983 \tabularnewline
60 & 402.43 & 402.338542996917 & 0.0914570030828941 \tabularnewline
\hline
\end{tabular}
%Source: https://freestatistics.org/blog/index.php?pk=167043&T=2

[TABLE]
[ROW][C]Interpolation Forecasts of Exponential Smoothing[/C][/ROW]
[ROW][C]t[/C][C]Observed[/C][C]Fitted[/C][C]Residuals[/C][/ROW]
[ROW][C]13[/C][C]407.77[/C][C]406.584706196581[/C][C]1.18529380341886[/C][/ROW]
[ROW][C]14[/C][C]408.06[/C][C]407.880162771397[/C][C]0.179837228603276[/C][/ROW]
[ROW][C]15[/C][C]403.74[/C][C]404.088292172632[/C][C]-0.348292172632341[/C][/ROW]
[ROW][C]16[/C][C]403.44[/C][C]403.968574993618[/C][C]-0.52857499361761[/C][/ROW]
[ROW][C]17[/C][C]404.3[/C][C]404.883353014573[/C][C]-0.583353014572651[/C][/ROW]
[ROW][C]18[/C][C]403.29[/C][C]403.853878459948[/C][C]-0.56387845994783[/C][/ROW]
[ROW][C]19[/C][C]403.29[/C][C]401.652701419169[/C][C]1.63729858083053[/C][/ROW]
[ROW][C]20[/C][C]400.66[/C][C]406.2245560627[/C][C]-5.56455606269986[/C][/ROW]
[ROW][C]21[/C][C]400.84[/C][C]401.887033987798[/C][C]-1.04703398779844[/C][/ROW]
[ROW][C]22[/C][C]401.31[/C][C]402.25243923327[/C][C]-0.942439233270022[/C][/ROW]
[ROW][C]23[/C][C]402[/C][C]401.218893542739[/C][C]0.781106457260876[/C][/ROW]
[ROW][C]24[/C][C]402[/C][C]401.63117172288[/C][C]0.368828277119974[/C][/ROW]
[ROW][C]25[/C][C]402[/C][C]402.057022334222[/C][C]-0.057022334222097[/C][/ROW]
[ROW][C]26[/C][C]403.33[/C][C]402.170087978788[/C][C]1.15991202121222[/C][/ROW]
[ROW][C]27[/C][C]403.79[/C][C]398.9767181799[/C][C]4.81328182009986[/C][/ROW]
[ROW][C]28[/C][C]403.04[/C][C]402.667091128679[/C][C]0.372908871321101[/C][/ROW]
[ROW][C]29[/C][C]402.91[/C][C]404.241419815217[/C][C]-1.3314198152172[/C][/ROW]
[ROW][C]30[/C][C]406.55[/C][C]402.65806557381[/C][C]3.89193442619018[/C][/ROW]
[ROW][C]31[/C][C]406.55[/C][C]404.342281044275[/C][C]2.20771895572551[/C][/ROW]
[ROW][C]32[/C][C]404.69[/C][C]407.518179080394[/C][C]-2.82817908039397[/C][/ROW]
[ROW][C]33[/C][C]404.74[/C][C]406.367661725999[/C][C]-1.62766172599913[/C][/ROW]
[ROW][C]34[/C][C]404.2[/C][C]406.325799765967[/C][C]-2.12579976596697[/C][/ROW]
[ROW][C]35[/C][C]404.18[/C][C]404.844337601721[/C][C]-0.6643376017214[/C][/ROW]
[ROW][C]36[/C][C]404.18[/C][C]404.072561547383[/C][C]0.107438452616634[/C][/ROW]
[ROW][C]37[/C][C]404.18[/C][C]404.195413937071[/C][C]-0.0154139370713438[/C][/ROW]
[ROW][C]38[/C][C]404.82[/C][C]404.647444146139[/C][C]0.172555853861411[/C][/ROW]
[ROW][C]39[/C][C]406.46[/C][C]401.640816715987[/C][C]4.81918328401258[/C][/ROW]
[ROW][C]40[/C][C]407.25[/C][C]404.212188620545[/C][C]3.03781137945492[/C][/ROW]
[ROW][C]41[/C][C]407.34[/C][C]407.34600915602[/C][C]-0.00600915602046825[/C][/ROW]
[ROW][C]42[/C][C]404.3[/C][C]408.074240988372[/C][C]-3.77424098837184[/C][/ROW]
[ROW][C]43[/C][C]404.3[/C][C]403.605710293145[/C][C]0.694289706855216[/C][/ROW]
[ROW][C]44[/C][C]404.7[/C][C]404.376998373623[/C][C]0.323001626376879[/C][/ROW]
[ROW][C]45[/C][C]406.82[/C][C]405.884146055588[/C][C]0.935853944412258[/C][/ROW]
[ROW][C]46[/C][C]406.82[/C][C]407.63120476391[/C][C]-0.811204763910382[/C][/ROW]
[ROW][C]47[/C][C]406.76[/C][C]407.501494831297[/C][C]-0.741494831297075[/C][/ROW]
[ROW][C]48[/C][C]406.76[/C][C]406.86734072916[/C][C]-0.107340729160114[/C][/ROW]
[ROW][C]49[/C][C]406.76[/C][C]406.798671313784[/C][C]-0.0386713137843344[/C][/ROW]
[ROW][C]50[/C][C]407.67[/C][C]407.280884385903[/C][C]0.389115614097477[/C][/ROW]
[ROW][C]51[/C][C]406.03[/C][C]405.611618936126[/C][C]0.418381063873937[/C][/ROW]
[ROW][C]52[/C][C]401.97[/C][C]404.444901592886[/C][C]-2.47490159288606[/C][/ROW]
[ROW][C]53[/C][C]401.84[/C][C]402.690636211565[/C][C]-0.850636211565075[/C][/ROW]
[ROW][C]54[/C][C]402.24[/C][C]401.834572213805[/C][C]0.40542778619465[/C][/ROW]
[ROW][C]55[/C][C]402.24[/C][C]401.618792039545[/C][C]0.62120796045474[/C][/ROW]
[ROW][C]56[/C][C]401.57[/C][C]402.241552500964[/C][C]-0.671552500964424[/C][/ROW]
[ROW][C]57[/C][C]401.63[/C][C]403.160818108224[/C][C]-1.53081810822431[/C][/ROW]
[ROW][C]58[/C][C]402.06[/C][C]402.623266144017[/C][C]-0.563266144016552[/C][/ROW]
[ROW][C]59[/C][C]402.11[/C][C]402.696403170564[/C][C]-0.586403170563983[/C][/ROW]
[ROW][C]60[/C][C]402.43[/C][C]402.338542996917[/C][C]0.0914570030828941[/C][/ROW]
[/TABLE]
Source: https://freestatistics.org/blog/index.php?pk=167043&T=2

Globally Unique Identifier (entire table): ba.freestatistics.org/blog/index.php?pk=167043&T=2

As an alternative you can also use a QR Code:  

The GUIDs for individual cells are displayed in the table below:

Interpolation Forecasts of Exponential Smoothing
tObservedFittedResiduals
13407.77406.5847061965811.18529380341886
14408.06407.8801627713970.179837228603276
15403.74404.088292172632-0.348292172632341
16403.44403.968574993618-0.52857499361761
17404.3404.883353014573-0.583353014572651
18403.29403.853878459948-0.56387845994783
19403.29401.6527014191691.63729858083053
20400.66406.2245560627-5.56455606269986
21400.84401.887033987798-1.04703398779844
22401.31402.25243923327-0.942439233270022
23402401.2188935427390.781106457260876
24402401.631171722880.368828277119974
25402402.057022334222-0.057022334222097
26403.33402.1700879787881.15991202121222
27403.79398.97671817994.81328182009986
28403.04402.6670911286790.372908871321101
29402.91404.241419815217-1.3314198152172
30406.55402.658065573813.89193442619018
31406.55404.3422810442752.20771895572551
32404.69407.518179080394-2.82817908039397
33404.74406.367661725999-1.62766172599913
34404.2406.325799765967-2.12579976596697
35404.18404.844337601721-0.6643376017214
36404.18404.0725615473830.107438452616634
37404.18404.195413937071-0.0154139370713438
38404.82404.6474441461390.172555853861411
39406.46401.6408167159874.81918328401258
40407.25404.2121886205453.03781137945492
41407.34407.34600915602-0.00600915602046825
42404.3408.074240988372-3.77424098837184
43404.3403.6057102931450.694289706855216
44404.7404.3769983736230.323001626376879
45406.82405.8841460555880.935853944412258
46406.82407.63120476391-0.811204763910382
47406.76407.501494831297-0.741494831297075
48406.76406.86734072916-0.107340729160114
49406.76406.798671313784-0.0386713137843344
50407.67407.2808843859030.389115614097477
51406.03405.6116189361260.418381063873937
52401.97404.444901592886-2.47490159288606
53401.84402.690636211565-0.850636211565075
54402.24401.8345722138050.40542778619465
55402.24401.6187920395450.62120796045474
56401.57402.241552500964-0.671552500964424
57401.63403.160818108224-1.53081810822431
58402.06402.623266144017-0.563266144016552
59402.11402.696403170564-0.586403170563983
60402.43402.3385429969170.0914570030828941


Extrapolation Forecasts of Exponential Smoothing
tForecast95% Lower Bound95% Upper Bound
61402.435748993559398.802853839769406.06864414735
62403.055079199405398.520488681245407.589669717566
63401.102548081897395.817938811917406.387157351876
64398.891302309412392.950622288967404.831982329857
65399.396728500388392.865552260669405.927904740108
66399.493873495634392.421331728826406.566415262441
67399.029830462021391.454513240135406.605147683906
68398.861480923084390.814741522484406.908220323683
69400.065003743252391.572972246012408.557035240492
70400.915764175893392.000654366189409.830873985597
71401.403807992958392.084807677043410.722808308874
72401.65548951049391.949390868038411.361588152941

\begin{tabular}{lllllllll}
\hline
Extrapolation Forecasts of Exponential Smoothing \tabularnewline
t & Forecast & 95% Lower Bound & 95% Upper Bound \tabularnewline
61 & 402.435748993559 & 398.802853839769 & 406.06864414735 \tabularnewline
62 & 403.055079199405 & 398.520488681245 & 407.589669717566 \tabularnewline
63 & 401.102548081897 & 395.817938811917 & 406.387157351876 \tabularnewline
64 & 398.891302309412 & 392.950622288967 & 404.831982329857 \tabularnewline
65 & 399.396728500388 & 392.865552260669 & 405.927904740108 \tabularnewline
66 & 399.493873495634 & 392.421331728826 & 406.566415262441 \tabularnewline
67 & 399.029830462021 & 391.454513240135 & 406.605147683906 \tabularnewline
68 & 398.861480923084 & 390.814741522484 & 406.908220323683 \tabularnewline
69 & 400.065003743252 & 391.572972246012 & 408.557035240492 \tabularnewline
70 & 400.915764175893 & 392.000654366189 & 409.830873985597 \tabularnewline
71 & 401.403807992958 & 392.084807677043 & 410.722808308874 \tabularnewline
72 & 401.65548951049 & 391.949390868038 & 411.361588152941 \tabularnewline
\hline
\end{tabular}
%Source: https://freestatistics.org/blog/index.php?pk=167043&T=3

[TABLE]
[ROW][C]Extrapolation Forecasts of Exponential Smoothing[/C][/ROW]
[ROW][C]t[/C][C]Forecast[/C][C]95% Lower Bound[/C][C]95% Upper Bound[/C][/ROW]
[ROW][C]61[/C][C]402.435748993559[/C][C]398.802853839769[/C][C]406.06864414735[/C][/ROW]
[ROW][C]62[/C][C]403.055079199405[/C][C]398.520488681245[/C][C]407.589669717566[/C][/ROW]
[ROW][C]63[/C][C]401.102548081897[/C][C]395.817938811917[/C][C]406.387157351876[/C][/ROW]
[ROW][C]64[/C][C]398.891302309412[/C][C]392.950622288967[/C][C]404.831982329857[/C][/ROW]
[ROW][C]65[/C][C]399.396728500388[/C][C]392.865552260669[/C][C]405.927904740108[/C][/ROW]
[ROW][C]66[/C][C]399.493873495634[/C][C]392.421331728826[/C][C]406.566415262441[/C][/ROW]
[ROW][C]67[/C][C]399.029830462021[/C][C]391.454513240135[/C][C]406.605147683906[/C][/ROW]
[ROW][C]68[/C][C]398.861480923084[/C][C]390.814741522484[/C][C]406.908220323683[/C][/ROW]
[ROW][C]69[/C][C]400.065003743252[/C][C]391.572972246012[/C][C]408.557035240492[/C][/ROW]
[ROW][C]70[/C][C]400.915764175893[/C][C]392.000654366189[/C][C]409.830873985597[/C][/ROW]
[ROW][C]71[/C][C]401.403807992958[/C][C]392.084807677043[/C][C]410.722808308874[/C][/ROW]
[ROW][C]72[/C][C]401.65548951049[/C][C]391.949390868038[/C][C]411.361588152941[/C][/ROW]
[/TABLE]
Source: https://freestatistics.org/blog/index.php?pk=167043&T=3

Globally Unique Identifier (entire table): ba.freestatistics.org/blog/index.php?pk=167043&T=3

As an alternative you can also use a QR Code:  

The GUIDs for individual cells are displayed in the table below:

Extrapolation Forecasts of Exponential Smoothing
tForecast95% Lower Bound95% Upper Bound
61402.435748993559398.802853839769406.06864414735
62403.055079199405398.520488681245407.589669717566
63401.102548081897395.817938811917406.387157351876
64398.891302309412392.950622288967404.831982329857
65399.396728500388392.865552260669405.927904740108
66399.493873495634392.421331728826406.566415262441
67399.029830462021391.454513240135406.605147683906
68398.861480923084390.814741522484406.908220323683
69400.065003743252391.572972246012408.557035240492
70400.915764175893392.000654366189409.830873985597
71401.403807992958392.084807677043410.722808308874
72401.65548951049391.949390868038411.361588152941


Parameters (Session):
par1 = 12 ; par2 = Triple ; par3 = additive ;
Parameters (R input):
par1 = 12 ; par2 = Triple ; par3 = additive ;
R code (references can be found in the software module):
par1 <- as.numeric(par1)
if (par2 == 'Single') K <- 1
if (par2 == 'Double') K <- 2
if (par2 == 'Triple') K <- par1
nx <- length(x)
nxmK <- nx - K
x <- ts(x, frequency = par1)
if (par2 == 'Single') fit <- HoltWinters(x, gamma=F, beta=F)
if (par2 == 'Double') fit <- HoltWinters(x, gamma=F)
if (par2 == 'Triple') fit <- HoltWinters(x, seasonal=par3)
fit
myresid <- x - fit$fitted[,'xhat']
bitmap(file='test1.png')
op <- par(mfrow=c(2,1))
plot(fit,ylab='Observed (black) / Fitted (red)',main='Interpolation Fit of Exponential Smoothing')
plot(myresid,ylab='Residuals',main='Interpolation Prediction Errors')
par(op)
dev.off()
bitmap(file='test2.png')
p <- predict(fit, par1, prediction.interval=TRUE)
np <- length(p[,1])
plot(fit,p,ylab='Observed (black) / Fitted (red)',main='Extrapolation Fit of Exponential Smoothing')
dev.off()
bitmap(file='test3.png')
op <- par(mfrow = c(2,2))
acf(as.numeric(myresid),lag.max = nx/2,main='Residual ACF')
spectrum(myresid,main='Residals Periodogram')
cpgram(myresid,main='Residal Cumulative Periodogram')
qqnorm(myresid,main='Residual Normal QQ Plot')
qqline(myresid)
par(op)
dev.off()
load(file='createtable')
a<-table.start()
a<-table.row.start(a)
a<-table.element(a,'Estimated Parameters of Exponential Smoothing',2,TRUE)
a<-table.row.end(a)
a<-table.row.start(a)
a<-table.element(a,'Parameter',header=TRUE)
a<-table.element(a,'Value',header=TRUE)
a<-table.row.end(a)
a<-table.row.start(a)
a<-table.element(a,'alpha',header=TRUE)
a<-table.element(a,fit$alpha)
a<-table.row.end(a)
a<-table.row.start(a)
a<-table.element(a,'beta',header=TRUE)
a<-table.element(a,fit$beta)
a<-table.row.end(a)
a<-table.row.start(a)
a<-table.element(a,'gamma',header=TRUE)
a<-table.element(a,fit$gamma)
a<-table.row.end(a)
a<-table.end(a)
table.save(a,file='mytable.tab')
a<-table.start()
a<-table.row.start(a)
a<-table.element(a,'Interpolation Forecasts of Exponential Smoothing',4,TRUE)
a<-table.row.end(a)
a<-table.row.start(a)
a<-table.element(a,'t',header=TRUE)
a<-table.element(a,'Observed',header=TRUE)
a<-table.element(a,'Fitted',header=TRUE)
a<-table.element(a,'Residuals',header=TRUE)
a<-table.row.end(a)
for (i in 1:nxmK) {
a<-table.row.start(a)
a<-table.element(a,i+K,header=TRUE)
a<-table.element(a,x[i+K])
a<-table.element(a,fit$fitted[i,'xhat'])
a<-table.element(a,myresid[i])
a<-table.row.end(a)
}
a<-table.end(a)
table.save(a,file='mytable1.tab')
a<-table.start()
a<-table.row.start(a)
a<-table.element(a,'Extrapolation Forecasts of Exponential Smoothing',4,TRUE)
a<-table.row.end(a)
a<-table.row.start(a)
a<-table.element(a,'t',header=TRUE)
a<-table.element(a,'Forecast',header=TRUE)
a<-table.element(a,'95% Lower Bound',header=TRUE)
a<-table.element(a,'95% Upper Bound',header=TRUE)
a<-table.row.end(a)
for (i in 1:np) {
a<-table.row.start(a)
a<-table.element(a,nx+i,header=TRUE)
a<-table.element(a,p[i,'fit'])
a<-table.element(a,p[i,'lwr'])
a<-table.element(a,p[i,'upr'])
a<-table.row.end(a)
}
a<-table.end(a)
table.save(a,file='mytable2.tab')