Free Statistics

of Irreproducible Research!

Author's title

Author*The author of this computation has been verified*
R Software Modulerwasp_hierarchicalclusteringdm.wasp
Title produced by softwareHierarchical Clustering
Date of computationTue, 15 May 2012 11:32:53 -0400
Cite this page as followsStatistical Computations at FreeStatistics.org, Office for Research Development and Education, URL https://freestatistics.org/blog/index.php?v=date/2012/May/15/t1337096135f8dtoa8dxr6glnu.htm/, Retrieved Thu, 09 May 2024 00:12:11 +0000
Statistical Computations at FreeStatistics.org, Office for Research Development and Education, URL https://freestatistics.org/blog/index.php?pk=166476, Retrieved Thu, 09 May 2024 00:12:11 +0000
QR Codes:

Original text written by user:
IsPrivate?No (this computation is public)
User-defined keywords
Estimated Impact153
Family? (F = Feedback message, R = changed R code, M = changed R Module, P = changed Parameters, D = changed Data)
-       [Hierarchical Clustering] [Hierarchical clus...] [2012-05-15 15:32:53] [2d8eb933f626a8d2aaa7a56374bb41d5] [Current]
Feedback Forum

Post a new message


Summary of computational transaction
Raw Inputview raw input (R code)
Raw Outputview raw output of R engine
Computing time3 seconds
R Server'AstonUniversity' @ aston.wessa.net

\begin{tabular}{lllllllll}
\hline
Summary of computational transaction \tabularnewline
Raw Input & view raw input (R code)  \tabularnewline
Raw Output & view raw output of R engine  \tabularnewline
Computing time & 3 seconds \tabularnewline
R Server & 'AstonUniversity' @ aston.wessa.net \tabularnewline
\hline
\end{tabular}
%Source: https://freestatistics.org/blog/index.php?pk=166476&T=0

[TABLE]
[ROW][C]Summary of computational transaction[/C][/ROW]
[ROW][C]Raw Input[/C][C]view raw input (R code) [/C][/ROW]
[ROW][C]Raw Output[/C][C]view raw output of R engine [/C][/ROW]
[ROW][C]Computing time[/C][C]3 seconds[/C][/ROW]
[ROW][C]R Server[/C][C]'AstonUniversity' @ aston.wessa.net[/C][/ROW]
[/TABLE]
Source: https://freestatistics.org/blog/index.php?pk=166476&T=0

Globally Unique Identifier (entire table): ba.freestatistics.org/blog/index.php?pk=166476&T=0

As an alternative you can also use a QR Code:  

The GUIDs for individual cells are displayed in the table below:

Summary of computational transaction
Raw Inputview raw input (R code)
Raw Outputview raw output of R engine
Computing time3 seconds
R Server'AstonUniversity' @ aston.wessa.net


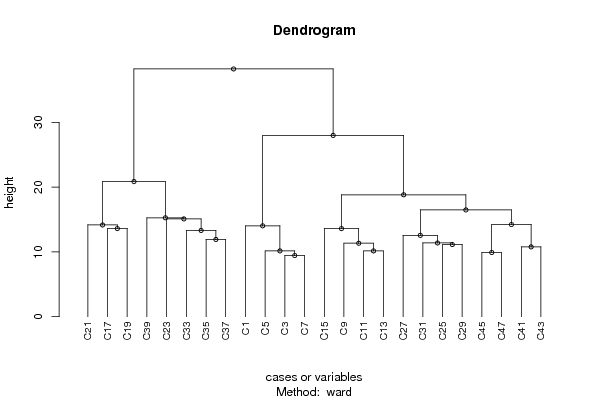
Summary of Dendrogram
LabelHeight
C19.4339811320566
C39.89949493661167
C510.1488915650922
C710.1552558700253
C910.770329614269
C1111.13552872566
C1311.3364430330751
C1511.3729866655701
C1711.916375287813
C1912.5531323846062
C2113.3060976345773
C2313.5987931153119
C2513.6014705087354
C2714.0221790660293
C2914.1540802309983
C3114.2210968336676
C3315.0907790007078
C3515.2635781157663
C3716.4798463984849
C3918.8151889926729
C4120.8588257196222
C4327.9849037598399
C4538.2457449645431

\begin{tabular}{lllllllll}
\hline
Summary of Dendrogram \tabularnewline
Label & Height \tabularnewline
C1 & 9.4339811320566 \tabularnewline
C3 & 9.89949493661167 \tabularnewline
C5 & 10.1488915650922 \tabularnewline
C7 & 10.1552558700253 \tabularnewline
C9 & 10.770329614269 \tabularnewline
C11 & 11.13552872566 \tabularnewline
C13 & 11.3364430330751 \tabularnewline
C15 & 11.3729866655701 \tabularnewline
C17 & 11.916375287813 \tabularnewline
C19 & 12.5531323846062 \tabularnewline
C21 & 13.3060976345773 \tabularnewline
C23 & 13.5987931153119 \tabularnewline
C25 & 13.6014705087354 \tabularnewline
C27 & 14.0221790660293 \tabularnewline
C29 & 14.1540802309983 \tabularnewline
C31 & 14.2210968336676 \tabularnewline
C33 & 15.0907790007078 \tabularnewline
C35 & 15.2635781157663 \tabularnewline
C37 & 16.4798463984849 \tabularnewline
C39 & 18.8151889926729 \tabularnewline
C41 & 20.8588257196222 \tabularnewline
C43 & 27.9849037598399 \tabularnewline
C45 & 38.2457449645431 \tabularnewline
\hline
\end{tabular}
%Source: https://freestatistics.org/blog/index.php?pk=166476&T=1

[TABLE]
[ROW][C]Summary of Dendrogram[/C][/ROW]
[ROW][C]Label[/C][C]Height[/C][/ROW]
[ROW][C]C1[/C][C]9.4339811320566[/C][/ROW]
[ROW][C]C3[/C][C]9.89949493661167[/C][/ROW]
[ROW][C]C5[/C][C]10.1488915650922[/C][/ROW]
[ROW][C]C7[/C][C]10.1552558700253[/C][/ROW]
[ROW][C]C9[/C][C]10.770329614269[/C][/ROW]
[ROW][C]C11[/C][C]11.13552872566[/C][/ROW]
[ROW][C]C13[/C][C]11.3364430330751[/C][/ROW]
[ROW][C]C15[/C][C]11.3729866655701[/C][/ROW]
[ROW][C]C17[/C][C]11.916375287813[/C][/ROW]
[ROW][C]C19[/C][C]12.5531323846062[/C][/ROW]
[ROW][C]C21[/C][C]13.3060976345773[/C][/ROW]
[ROW][C]C23[/C][C]13.5987931153119[/C][/ROW]
[ROW][C]C25[/C][C]13.6014705087354[/C][/ROW]
[ROW][C]C27[/C][C]14.0221790660293[/C][/ROW]
[ROW][C]C29[/C][C]14.1540802309983[/C][/ROW]
[ROW][C]C31[/C][C]14.2210968336676[/C][/ROW]
[ROW][C]C33[/C][C]15.0907790007078[/C][/ROW]
[ROW][C]C35[/C][C]15.2635781157663[/C][/ROW]
[ROW][C]C37[/C][C]16.4798463984849[/C][/ROW]
[ROW][C]C39[/C][C]18.8151889926729[/C][/ROW]
[ROW][C]C41[/C][C]20.8588257196222[/C][/ROW]
[ROW][C]C43[/C][C]27.9849037598399[/C][/ROW]
[ROW][C]C45[/C][C]38.2457449645431[/C][/ROW]
[/TABLE]
Source: https://freestatistics.org/blog/index.php?pk=166476&T=1

Globally Unique Identifier (entire table): ba.freestatistics.org/blog/index.php?pk=166476&T=1

As an alternative you can also use a QR Code:  

The GUIDs for individual cells are displayed in the table below:

Summary of Dendrogram
LabelHeight
C19.4339811320566
C39.89949493661167
C510.1488915650922
C710.1552558700253
C910.770329614269
C1111.13552872566
C1311.3364430330751
C1511.3729866655701
C1711.916375287813
C1912.5531323846062
C2113.3060976345773
C2313.5987931153119
C2513.6014705087354
C2714.0221790660293
C2914.1540802309983
C3114.2210968336676
C3315.0907790007078
C3515.2635781157663
C3716.4798463984849
C3918.8151889926729
C4120.8588257196222
C4327.9849037598399
C4538.2457449645431


Parameters (Session):
par1 = ward ; par2 = ALL ; par3 = FALSE ; par4 = FALSE ; par5 = female ; par6 = prep ; par7 = all ; par8 = COLLES actuals ; par9 = variables ;
Parameters (R input):
par1 = ward ; par2 = ALL ; par3 = FALSE ; par4 = FALSE ; par5 = female ; par6 = prep ; par7 = all ; par8 = COLLES actuals ; par9 = variables ;
R code (references can be found in the software module):
x <- as.data.frame(read.table(file='https://automated.biganalytics.eu/download/utaut.csv',sep=',',header=T))
x$U25 <- 6-x$U25
if(par5 == 'female') x <- x[x$Gender==0,]
if(par5 == 'male') x <- x[x$Gender==1,]
if(par6 == 'prep') x <- x[x$Pop==1,]
if(par6 == 'bachelor') x <- x[x$Pop==0,]
if(par7 != 'all') {
x <- x[x$Year==as.numeric(par7),]
}
cAc <- with(x,cbind( A1, A2, A3, A4, A5, A6, A7, A8, A9,A10))
cAs <- with(x,cbind(A11,A12,A13,A14,A15,A16,A17,A18,A19,A20))
cA <- cbind(cAc,cAs)
cCa <- with(x,cbind(C1,C3,C5,C7, C9,C11,C13,C15,C17,C19,C21,C23,C25,C27,C29,C31,C33,C35,C37,C39,C41,C43,C45,C47))
cCp <- with(x,cbind(C2,C4,C6,C8,C10,C12,C14,C16,C18,C20,C22,C24,C26,C28,C30,C32,C34,C36,C38,C40,C42,C44,C46,C48))
cC <- cbind(cCa,cCp)
cU <- with(x,cbind(U1,U2,U3,U4,U5,U6,U7,U8,U9,U10,U11,U12,U13,U14,U15,U16,U17,U18,U19,U20,U21,U22,U23,U24,U25,U26,U27,U28,U29,U30,U31,U32,U33))
cE <- with(x,cbind(BC,NNZFG,MRT,AFL,LPM,LPC,W,WPA))
cX <- with(x,cbind(X1,X2,X3,X4,X5,X6,X7,X8,X9,X10,X11,X12,X13,X14,X15,X16,X17,X18))
if (par8=='ATTLES connected') x <- cAc
if (par8=='ATTLES separate') x <- cAs
if (par8=='ATTLES all') x <- cA
if (par8=='COLLES actuals') x <- cCa
if (par8=='COLLES preferred') x <- cCp
if (par8=='COLLES all') x <- cC
if (par8=='CSUQ') x <- cU
if (par8=='Learning Activities') x <- cE
if (par8=='Exam Items') x <- cX
ncol <- length(x[1,])
for (jjj in 1:ncol) {
x <- x[!is.na(x[,jjj]),]
}
par3 <- as.logical(par3)
par4 <- as.logical(par4)
if (par3 == TRUE){
dum = xlab
xlab = ylab
ylab = dum
}
if (par9=='variables') {
x <- t(x)
} else {
ncol <- length(x[1,])
colnames(x) <- 1:ncol
}
hc <- hclust(dist(x),method=par1)
d <- as.dendrogram(hc)
str(d)
mysub <- paste('Method: ',par1)
bitmap(file='test1.png')
if (par4 == TRUE){
plot(d,main=main,ylab=ylab,xlab=xlab,horiz=par3, nodePar=list(pch = c(1,NA), cex=0.8, lab.cex = 0.8),type='t',center=T, sub=mysub)
} else {
plot(d,main=main,ylab=ylab,xlab=xlab,horiz=par3, nodePar=list(pch = c(1,NA), cex=0.8, lab.cex = 0.8), sub=mysub)
}
dev.off()
if (par2 != 'ALL'){
if (par3 == TRUE){
ylab = 'cluster'
} else {
xlab = 'cluster'
}
par2 <- as.numeric(par2)
memb <- cutree(hc, k = par2)
cent <- NULL
for(k in 1:par2){
cent <- rbind(cent, colMeans(x[memb == k, , drop = FALSE]))
}
hc1 <- hclust(dist(cent),method=par1, members = table(memb))
de <- as.dendrogram(hc1)
bitmap(file='test2.png')
if (par4 == TRUE){
plot(de,main=main,ylab=ylab,xlab=xlab,horiz=par3, nodePar=list(pch = c(1,NA), cex=0.8, lab.cex = 0.8),type='t',center=T, sub=mysub)
} else {
plot(de,main=main,ylab=ylab,xlab=xlab,horiz=par3, nodePar=list(pch = c(1,NA), cex=0.8, lab.cex = 0.8), sub=mysub)
}
dev.off()
str(de)
}
load(file='createtable')
a<-table.start()
a<-table.row.start(a)
a<-table.element(a,'Summary of Dendrogram',2,TRUE)
a<-table.row.end(a)
a<-table.row.start(a)
a<-table.element(a,'Label',header=TRUE)
a<-table.element(a,'Height',header=TRUE)
a<-table.row.end(a)
num <- length(x[,1])-1
for (i in 1:num)
{
a<-table.row.start(a)
a<-table.element(a,hc$labels[i])
a<-table.element(a,hc$height[i])
a<-table.row.end(a)
}
a<-table.end(a)
table.save(a,file='mytable1.tab')
if (par2 != 'ALL'){
a<-table.start()
a<-table.row.start(a)
a<-table.element(a,'Summary of Cut Dendrogram',2,TRUE)
a<-table.row.end(a)
a<-table.row.start(a)
a<-table.element(a,'Label',header=TRUE)
a<-table.element(a,'Height',header=TRUE)
a<-table.row.end(a)
num <- par2-1
for (i in 1:num)
{
a<-table.row.start(a)
a<-table.element(a,i)
a<-table.element(a,hc1$height[i])
a<-table.row.end(a)
}
a<-table.end(a)
table.save(a,file='mytable2.tab')
}