Free Statistics

of Irreproducible Research!

Author's title

Author*The author of this computation has been verified*
R Software Modulerwasp_arimabackwardselection.wasp
Title produced by softwareARIMA Backward Selection
Date of computationFri, 11 May 2012 07:32:48 -0400
Cite this page as followsStatistical Computations at FreeStatistics.org, Office for Research Development and Education, URL https://freestatistics.org/blog/index.php?v=date/2012/May/11/t13367360162h1u439ci2f4xrd.htm/, Retrieved Mon, 29 Apr 2024 15:42:56 +0000
Statistical Computations at FreeStatistics.org, Office for Research Development and Education, URL https://freestatistics.org/blog/index.php?pk=166404, Retrieved Mon, 29 Apr 2024 15:42:56 +0000
QR Codes:

Original text written by user:
IsPrivate?No (this computation is public)
User-defined keywords
Estimated Impact147
Family? (F = Feedback message, R = changed R code, M = changed R Module, P = changed Parameters, D = changed Data)
-     [Univariate Data Series] [] [2012-05-11 11:23:57] [74be16979710d4c4e7c6647856088456]
- RMP     [ARIMA Backward Selection] [model1] [2012-05-11 11:32:48] [d76b387543b13b5e3afd8ff9e5fdc89f] [Current]
Feedback Forum

Post a new message
Dataseries X:
133.105
139.066
137.645
143.836
137.175
140.47
138.662
146.738
142.133
144.151
141.176
150.444
139.494
141.234
140.273
153.8
147.401
153.157
150.366
160.347
150.227
155.468
152.358
163.189
155.438
159.07
155.232
165.366
157.161
165.623
157.775
173.696
161.44
166.145
164.361
177.168
164.15
164.869
163.064
174.409
164.062
166.523
164.027
173.251
164.983
166.886
163.6
172.94
166.603
167.785
166.85
177.504
167.63
168.123
167.705
181.996
172.861
175.444
176.473
193.009
178.455
187.177
183.767
195.74
188.674
195.03
186.305
201.588
192.843
197.391
194.408
210.311
197.148
202.714
193.651
198.97
185.515
189.982
186.276
197.11
190.522
192.175
189.153
201.316
188.959
192.146
187.763
200.365


Summary of computational transaction
Raw Inputview raw input (R code)
Raw Outputview raw output of R engine
Computing time3 seconds
R Server'Gertrude Mary Cox' @ cox.wessa.net

\begin{tabular}{lllllllll}
\hline
Summary of computational transaction \tabularnewline
Raw Input & view raw input (R code)  \tabularnewline
Raw Output & view raw output of R engine  \tabularnewline
Computing time & 3 seconds \tabularnewline
R Server & 'Gertrude Mary Cox' @ cox.wessa.net \tabularnewline
\hline
\end{tabular}
%Source: https://freestatistics.org/blog/index.php?pk=166404&T=0

[TABLE]
[ROW][C]Summary of computational transaction[/C][/ROW]
[ROW][C]Raw Input[/C][C]view raw input (R code) [/C][/ROW]
[ROW][C]Raw Output[/C][C]view raw output of R engine [/C][/ROW]
[ROW][C]Computing time[/C][C]3 seconds[/C][/ROW]
[ROW][C]R Server[/C][C]'Gertrude Mary Cox' @ cox.wessa.net[/C][/ROW]
[/TABLE]
Source: https://freestatistics.org/blog/index.php?pk=166404&T=0

Globally Unique Identifier (entire table): ba.freestatistics.org/blog/index.php?pk=166404&T=0

As an alternative you can also use a QR Code:  

The GUIDs for individual cells are displayed in the table below:

Summary of computational transaction
Raw Inputview raw input (R code)
Raw Outputview raw output of R engine
Computing time3 seconds
R Server'Gertrude Mary Cox' @ cox.wessa.net


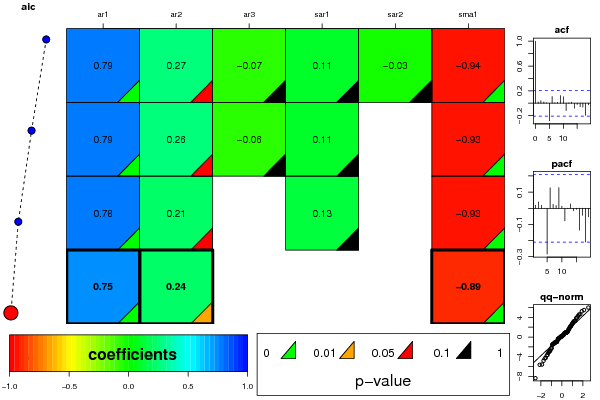
ARIMA Parameter Estimation and Backward Selection
Iterationar1ar2ar3sar1sar2sma1
Estimates ( 1 )0.79490.2677-0.06520.1116-0.0256-0.9367
(p-val)(0 )(0.085 )(0.5999 )(0.4141 )(0.8483 )(0 )
Estimates ( 2 )0.79250.26-0.05550.11430-0.9341
(p-val)(0 )(0.0852 )(0.6282 )(0.3772 )(NA )(0 )
Estimates ( 3 )0.78380.213300.12670-0.9334
(p-val)(0 )(0.0618 )(NA )(0.319 )(NA )(0 )
Estimates ( 4 )0.75490.2397000-0.8934
(p-val)(0 )(0.0317 )(NA )(NA )(NA )(0 )
Estimates ( 5 )NANANANANANA
(p-val)(NA )(NA )(NA )(NA )(NA )(NA )
Estimates ( 6 )NANANANANANA
(p-val)(NA )(NA )(NA )(NA )(NA )(NA )
Estimates ( 7 )NANANANANANA
(p-val)(NA )(NA )(NA )(NA )(NA )(NA )
Estimates ( 8 )NANANANANANA
(p-val)(NA )(NA )(NA )(NA )(NA )(NA )
Estimates ( 9 )NANANANANANA
(p-val)(NA )(NA )(NA )(NA )(NA )(NA )
Estimates ( 10 )NANANANANANA
(p-val)(NA )(NA )(NA )(NA )(NA )(NA )
Estimates ( 11 )NANANANANANA
(p-val)(NA )(NA )(NA )(NA )(NA )(NA )

\begin{tabular}{lllllllll}
\hline
ARIMA Parameter Estimation and Backward Selection \tabularnewline
Iteration & ar1 & ar2 & ar3 & sar1 & sar2 & sma1 \tabularnewline
Estimates ( 1 ) & 0.7949 & 0.2677 & -0.0652 & 0.1116 & -0.0256 & -0.9367 \tabularnewline
(p-val) & (0 ) & (0.085 ) & (0.5999 ) & (0.4141 ) & (0.8483 ) & (0 ) \tabularnewline
Estimates ( 2 ) & 0.7925 & 0.26 & -0.0555 & 0.1143 & 0 & -0.9341 \tabularnewline
(p-val) & (0 ) & (0.0852 ) & (0.6282 ) & (0.3772 ) & (NA ) & (0 ) \tabularnewline
Estimates ( 3 ) & 0.7838 & 0.2133 & 0 & 0.1267 & 0 & -0.9334 \tabularnewline
(p-val) & (0 ) & (0.0618 ) & (NA ) & (0.319 ) & (NA ) & (0 ) \tabularnewline
Estimates ( 4 ) & 0.7549 & 0.2397 & 0 & 0 & 0 & -0.8934 \tabularnewline
(p-val) & (0 ) & (0.0317 ) & (NA ) & (NA ) & (NA ) & (0 ) \tabularnewline
Estimates ( 5 ) & NA & NA & NA & NA & NA & NA \tabularnewline
(p-val) & (NA ) & (NA ) & (NA ) & (NA ) & (NA ) & (NA ) \tabularnewline
Estimates ( 6 ) & NA & NA & NA & NA & NA & NA \tabularnewline
(p-val) & (NA ) & (NA ) & (NA ) & (NA ) & (NA ) & (NA ) \tabularnewline
Estimates ( 7 ) & NA & NA & NA & NA & NA & NA \tabularnewline
(p-val) & (NA ) & (NA ) & (NA ) & (NA ) & (NA ) & (NA ) \tabularnewline
Estimates ( 8 ) & NA & NA & NA & NA & NA & NA \tabularnewline
(p-val) & (NA ) & (NA ) & (NA ) & (NA ) & (NA ) & (NA ) \tabularnewline
Estimates ( 9 ) & NA & NA & NA & NA & NA & NA \tabularnewline
(p-val) & (NA ) & (NA ) & (NA ) & (NA ) & (NA ) & (NA ) \tabularnewline
Estimates ( 10 ) & NA & NA & NA & NA & NA & NA \tabularnewline
(p-val) & (NA ) & (NA ) & (NA ) & (NA ) & (NA ) & (NA ) \tabularnewline
Estimates ( 11 ) & NA & NA & NA & NA & NA & NA \tabularnewline
(p-val) & (NA ) & (NA ) & (NA ) & (NA ) & (NA ) & (NA ) \tabularnewline
\hline
\end{tabular}
%Source: https://freestatistics.org/blog/index.php?pk=166404&T=1

[TABLE]
[ROW][C]ARIMA Parameter Estimation and Backward Selection[/C][/ROW]
[ROW][C]Iteration[/C][C]ar1[/C][C]ar2[/C][C]ar3[/C][C]sar1[/C][C]sar2[/C][C]sma1[/C][/ROW]
[ROW][C]Estimates ( 1 )[/C][C]0.7949[/C][C]0.2677[/C][C]-0.0652[/C][C]0.1116[/C][C]-0.0256[/C][C]-0.9367[/C][/ROW]
[ROW][C](p-val)[/C][C](0 )[/C][C](0.085 )[/C][C](0.5999 )[/C][C](0.4141 )[/C][C](0.8483 )[/C][C](0 )[/C][/ROW]
[ROW][C]Estimates ( 2 )[/C][C]0.7925[/C][C]0.26[/C][C]-0.0555[/C][C]0.1143[/C][C]0[/C][C]-0.9341[/C][/ROW]
[ROW][C](p-val)[/C][C](0 )[/C][C](0.0852 )[/C][C](0.6282 )[/C][C](0.3772 )[/C][C](NA )[/C][C](0 )[/C][/ROW]
[ROW][C]Estimates ( 3 )[/C][C]0.7838[/C][C]0.2133[/C][C]0[/C][C]0.1267[/C][C]0[/C][C]-0.9334[/C][/ROW]
[ROW][C](p-val)[/C][C](0 )[/C][C](0.0618 )[/C][C](NA )[/C][C](0.319 )[/C][C](NA )[/C][C](0 )[/C][/ROW]
[ROW][C]Estimates ( 4 )[/C][C]0.7549[/C][C]0.2397[/C][C]0[/C][C]0[/C][C]0[/C][C]-0.8934[/C][/ROW]
[ROW][C](p-val)[/C][C](0 )[/C][C](0.0317 )[/C][C](NA )[/C][C](NA )[/C][C](NA )[/C][C](0 )[/C][/ROW]
[ROW][C]Estimates ( 5 )[/C][C]NA[/C][C]NA[/C][C]NA[/C][C]NA[/C][C]NA[/C][C]NA[/C][/ROW]
[ROW][C](p-val)[/C][C](NA )[/C][C](NA )[/C][C](NA )[/C][C](NA )[/C][C](NA )[/C][C](NA )[/C][/ROW]
[ROW][C]Estimates ( 6 )[/C][C]NA[/C][C]NA[/C][C]NA[/C][C]NA[/C][C]NA[/C][C]NA[/C][/ROW]
[ROW][C](p-val)[/C][C](NA )[/C][C](NA )[/C][C](NA )[/C][C](NA )[/C][C](NA )[/C][C](NA )[/C][/ROW]
[ROW][C]Estimates ( 7 )[/C][C]NA[/C][C]NA[/C][C]NA[/C][C]NA[/C][C]NA[/C][C]NA[/C][/ROW]
[ROW][C](p-val)[/C][C](NA )[/C][C](NA )[/C][C](NA )[/C][C](NA )[/C][C](NA )[/C][C](NA )[/C][/ROW]
[ROW][C]Estimates ( 8 )[/C][C]NA[/C][C]NA[/C][C]NA[/C][C]NA[/C][C]NA[/C][C]NA[/C][/ROW]
[ROW][C](p-val)[/C][C](NA )[/C][C](NA )[/C][C](NA )[/C][C](NA )[/C][C](NA )[/C][C](NA )[/C][/ROW]
[ROW][C]Estimates ( 9 )[/C][C]NA[/C][C]NA[/C][C]NA[/C][C]NA[/C][C]NA[/C][C]NA[/C][/ROW]
[ROW][C](p-val)[/C][C](NA )[/C][C](NA )[/C][C](NA )[/C][C](NA )[/C][C](NA )[/C][C](NA )[/C][/ROW]
[ROW][C]Estimates ( 10 )[/C][C]NA[/C][C]NA[/C][C]NA[/C][C]NA[/C][C]NA[/C][C]NA[/C][/ROW]
[ROW][C](p-val)[/C][C](NA )[/C][C](NA )[/C][C](NA )[/C][C](NA )[/C][C](NA )[/C][C](NA )[/C][/ROW]
[ROW][C]Estimates ( 11 )[/C][C]NA[/C][C]NA[/C][C]NA[/C][C]NA[/C][C]NA[/C][C]NA[/C][/ROW]
[ROW][C](p-val)[/C][C](NA )[/C][C](NA )[/C][C](NA )[/C][C](NA )[/C][C](NA )[/C][C](NA )[/C][/ROW]
[/TABLE]
Source: https://freestatistics.org/blog/index.php?pk=166404&T=1

Globally Unique Identifier (entire table): ba.freestatistics.org/blog/index.php?pk=166404&T=1

As an alternative you can also use a QR Code:  

The GUIDs for individual cells are displayed in the table below:

ARIMA Parameter Estimation and Backward Selection
Iterationar1ar2ar3sar1sar2sma1
Estimates ( 1 )0.79490.2677-0.06520.1116-0.0256-0.9367
(p-val)(0 )(0.085 )(0.5999 )(0.4141 )(0.8483 )(0 )
Estimates ( 2 )0.79250.26-0.05550.11430-0.9341
(p-val)(0 )(0.0852 )(0.6282 )(0.3772 )(NA )(0 )
Estimates ( 3 )0.78380.213300.12670-0.9334
(p-val)(0 )(0.0618 )(NA )(0.319 )(NA )(0 )
Estimates ( 4 )0.75490.2397000-0.8934
(p-val)(0 )(0.0317 )(NA )(NA )(NA )(0 )
Estimates ( 5 )NANANANANANA
(p-val)(NA )(NA )(NA )(NA )(NA )(NA )
Estimates ( 6 )NANANANANANA
(p-val)(NA )(NA )(NA )(NA )(NA )(NA )
Estimates ( 7 )NANANANANANA
(p-val)(NA )(NA )(NA )(NA )(NA )(NA )
Estimates ( 8 )NANANANANANA
(p-val)(NA )(NA )(NA )(NA )(NA )(NA )
Estimates ( 9 )NANANANANANA
(p-val)(NA )(NA )(NA )(NA )(NA )(NA )
Estimates ( 10 )NANANANANANA
(p-val)(NA )(NA )(NA )(NA )(NA )(NA )
Estimates ( 11 )NANANANANANA
(p-val)(NA )(NA )(NA )(NA )(NA )(NA )


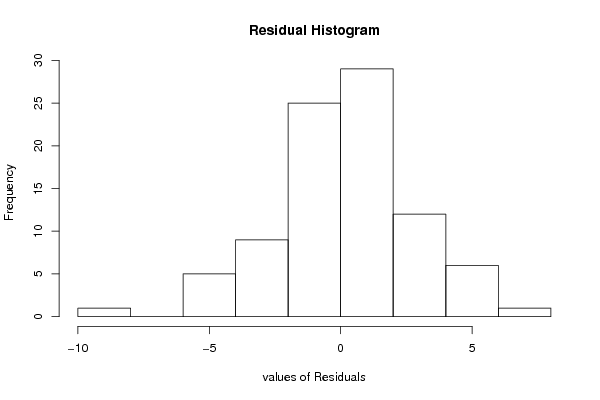
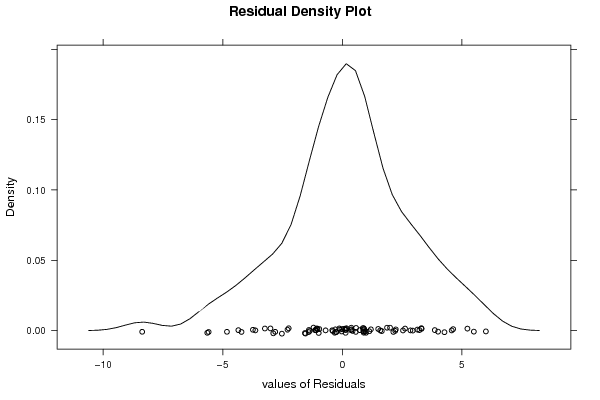
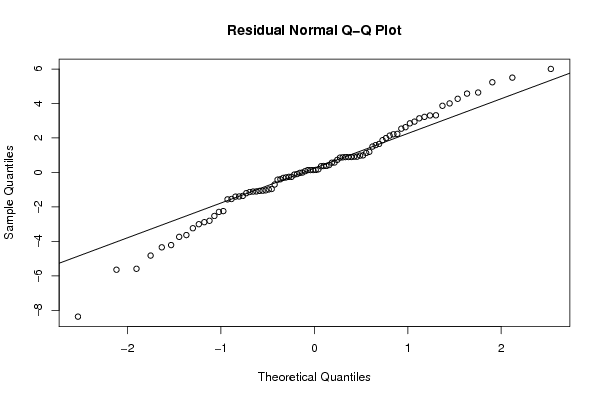
Estimated ARIMA Residuals
Value
0.143834818248342
2.13507276404364
-1.36488007242248
-0.289634018156677
1.86921363138622
2.94680561718968
-1.10349491846618
-1.06216399968299
1.99576638591325
-3.63679641281016
-2.29306086874244
0.990718243688076
5.50096244101465
3.14041054086673
3.30502056624534
-0.00726018503030562
0.372723540975927
-2.24510052647632
0.892239568349886
-0.318126982361361
1.5003139729472
1.12861987956441
-0.09498496398483
-1.20491901630456
0.376024665008545
0.0698899865116491
4.63563005295076
-3.73929977463391
5.23257416253082
-2.52774338043482
-0.98849916178299
2.21347027549843
2.23619558421263
-3.23892588007432
-4.3473442307875
0.427911672785828
0.727755770095941
-0.421967526688686
-1.11169210716728
0.180042488749353
-1.39680913764519
0.913082014182216
-1.40601572228076
-0.700417269668283
-1.03708866481857
2.53751290444386
-1.56293056177311
1.65043029916049
0.876503780356279
-1.13791198205763
-2.80652083025241
1.5874059808773
4.27271579753982
0.891393855664978
-0.126829750519967
3.31612584404167
6.00501061647983
-4.21724919216226
4.57430593711769
-0.255485738612096
-0.258786072103664
3.22475875488443
2.84823492982415
-5.59256400097471
2.6238118867788
1.19494638009981
0.574226744373426
0.914323313981378
4.00546328638062
-3.0057901938455
0.893787324006602
-5.64782156365265
-8.3708284190616
-4.82587021121791
-0.396354138543889
0.562090094685458
0.359772057609957
3.86678872912941
-1.54195942012579
-0.0286617135785812
0.975569265981577
-2.88729720996113
-0.963691955102135
-1.07107438040979
0.856981784271256

\begin{tabular}{lllllllll}
\hline
Estimated ARIMA Residuals \tabularnewline
Value \tabularnewline
0.143834818248342 \tabularnewline
2.13507276404364 \tabularnewline
-1.36488007242248 \tabularnewline
-0.289634018156677 \tabularnewline
1.86921363138622 \tabularnewline
2.94680561718968 \tabularnewline
-1.10349491846618 \tabularnewline
-1.06216399968299 \tabularnewline
1.99576638591325 \tabularnewline
-3.63679641281016 \tabularnewline
-2.29306086874244 \tabularnewline
0.990718243688076 \tabularnewline
5.50096244101465 \tabularnewline
3.14041054086673 \tabularnewline
3.30502056624534 \tabularnewline
-0.00726018503030562 \tabularnewline
0.372723540975927 \tabularnewline
-2.24510052647632 \tabularnewline
0.892239568349886 \tabularnewline
-0.318126982361361 \tabularnewline
1.5003139729472 \tabularnewline
1.12861987956441 \tabularnewline
-0.09498496398483 \tabularnewline
-1.20491901630456 \tabularnewline
0.376024665008545 \tabularnewline
0.0698899865116491 \tabularnewline
4.63563005295076 \tabularnewline
-3.73929977463391 \tabularnewline
5.23257416253082 \tabularnewline
-2.52774338043482 \tabularnewline
-0.98849916178299 \tabularnewline
2.21347027549843 \tabularnewline
2.23619558421263 \tabularnewline
-3.23892588007432 \tabularnewline
-4.3473442307875 \tabularnewline
0.427911672785828 \tabularnewline
0.727755770095941 \tabularnewline
-0.421967526688686 \tabularnewline
-1.11169210716728 \tabularnewline
0.180042488749353 \tabularnewline
-1.39680913764519 \tabularnewline
0.913082014182216 \tabularnewline
-1.40601572228076 \tabularnewline
-0.700417269668283 \tabularnewline
-1.03708866481857 \tabularnewline
2.53751290444386 \tabularnewline
-1.56293056177311 \tabularnewline
1.65043029916049 \tabularnewline
0.876503780356279 \tabularnewline
-1.13791198205763 \tabularnewline
-2.80652083025241 \tabularnewline
1.5874059808773 \tabularnewline
4.27271579753982 \tabularnewline
0.891393855664978 \tabularnewline
-0.126829750519967 \tabularnewline
3.31612584404167 \tabularnewline
6.00501061647983 \tabularnewline
-4.21724919216226 \tabularnewline
4.57430593711769 \tabularnewline
-0.255485738612096 \tabularnewline
-0.258786072103664 \tabularnewline
3.22475875488443 \tabularnewline
2.84823492982415 \tabularnewline
-5.59256400097471 \tabularnewline
2.6238118867788 \tabularnewline
1.19494638009981 \tabularnewline
0.574226744373426 \tabularnewline
0.914323313981378 \tabularnewline
4.00546328638062 \tabularnewline
-3.0057901938455 \tabularnewline
0.893787324006602 \tabularnewline
-5.64782156365265 \tabularnewline
-8.3708284190616 \tabularnewline
-4.82587021121791 \tabularnewline
-0.396354138543889 \tabularnewline
0.562090094685458 \tabularnewline
0.359772057609957 \tabularnewline
3.86678872912941 \tabularnewline
-1.54195942012579 \tabularnewline
-0.0286617135785812 \tabularnewline
0.975569265981577 \tabularnewline
-2.88729720996113 \tabularnewline
-0.963691955102135 \tabularnewline
-1.07107438040979 \tabularnewline
0.856981784271256 \tabularnewline
\hline
\end{tabular}
%Source: https://freestatistics.org/blog/index.php?pk=166404&T=2

[TABLE]
[ROW][C]Estimated ARIMA Residuals[/C][/ROW]
[ROW][C]Value[/C][/ROW]
[ROW][C]0.143834818248342[/C][/ROW]
[ROW][C]2.13507276404364[/C][/ROW]
[ROW][C]-1.36488007242248[/C][/ROW]
[ROW][C]-0.289634018156677[/C][/ROW]
[ROW][C]1.86921363138622[/C][/ROW]
[ROW][C]2.94680561718968[/C][/ROW]
[ROW][C]-1.10349491846618[/C][/ROW]
[ROW][C]-1.06216399968299[/C][/ROW]
[ROW][C]1.99576638591325[/C][/ROW]
[ROW][C]-3.63679641281016[/C][/ROW]
[ROW][C]-2.29306086874244[/C][/ROW]
[ROW][C]0.990718243688076[/C][/ROW]
[ROW][C]5.50096244101465[/C][/ROW]
[ROW][C]3.14041054086673[/C][/ROW]
[ROW][C]3.30502056624534[/C][/ROW]
[ROW][C]-0.00726018503030562[/C][/ROW]
[ROW][C]0.372723540975927[/C][/ROW]
[ROW][C]-2.24510052647632[/C][/ROW]
[ROW][C]0.892239568349886[/C][/ROW]
[ROW][C]-0.318126982361361[/C][/ROW]
[ROW][C]1.5003139729472[/C][/ROW]
[ROW][C]1.12861987956441[/C][/ROW]
[ROW][C]-0.09498496398483[/C][/ROW]
[ROW][C]-1.20491901630456[/C][/ROW]
[ROW][C]0.376024665008545[/C][/ROW]
[ROW][C]0.0698899865116491[/C][/ROW]
[ROW][C]4.63563005295076[/C][/ROW]
[ROW][C]-3.73929977463391[/C][/ROW]
[ROW][C]5.23257416253082[/C][/ROW]
[ROW][C]-2.52774338043482[/C][/ROW]
[ROW][C]-0.98849916178299[/C][/ROW]
[ROW][C]2.21347027549843[/C][/ROW]
[ROW][C]2.23619558421263[/C][/ROW]
[ROW][C]-3.23892588007432[/C][/ROW]
[ROW][C]-4.3473442307875[/C][/ROW]
[ROW][C]0.427911672785828[/C][/ROW]
[ROW][C]0.727755770095941[/C][/ROW]
[ROW][C]-0.421967526688686[/C][/ROW]
[ROW][C]-1.11169210716728[/C][/ROW]
[ROW][C]0.180042488749353[/C][/ROW]
[ROW][C]-1.39680913764519[/C][/ROW]
[ROW][C]0.913082014182216[/C][/ROW]
[ROW][C]-1.40601572228076[/C][/ROW]
[ROW][C]-0.700417269668283[/C][/ROW]
[ROW][C]-1.03708866481857[/C][/ROW]
[ROW][C]2.53751290444386[/C][/ROW]
[ROW][C]-1.56293056177311[/C][/ROW]
[ROW][C]1.65043029916049[/C][/ROW]
[ROW][C]0.876503780356279[/C][/ROW]
[ROW][C]-1.13791198205763[/C][/ROW]
[ROW][C]-2.80652083025241[/C][/ROW]
[ROW][C]1.5874059808773[/C][/ROW]
[ROW][C]4.27271579753982[/C][/ROW]
[ROW][C]0.891393855664978[/C][/ROW]
[ROW][C]-0.126829750519967[/C][/ROW]
[ROW][C]3.31612584404167[/C][/ROW]
[ROW][C]6.00501061647983[/C][/ROW]
[ROW][C]-4.21724919216226[/C][/ROW]
[ROW][C]4.57430593711769[/C][/ROW]
[ROW][C]-0.255485738612096[/C][/ROW]
[ROW][C]-0.258786072103664[/C][/ROW]
[ROW][C]3.22475875488443[/C][/ROW]
[ROW][C]2.84823492982415[/C][/ROW]
[ROW][C]-5.59256400097471[/C][/ROW]
[ROW][C]2.6238118867788[/C][/ROW]
[ROW][C]1.19494638009981[/C][/ROW]
[ROW][C]0.574226744373426[/C][/ROW]
[ROW][C]0.914323313981378[/C][/ROW]
[ROW][C]4.00546328638062[/C][/ROW]
[ROW][C]-3.0057901938455[/C][/ROW]
[ROW][C]0.893787324006602[/C][/ROW]
[ROW][C]-5.64782156365265[/C][/ROW]
[ROW][C]-8.3708284190616[/C][/ROW]
[ROW][C]-4.82587021121791[/C][/ROW]
[ROW][C]-0.396354138543889[/C][/ROW]
[ROW][C]0.562090094685458[/C][/ROW]
[ROW][C]0.359772057609957[/C][/ROW]
[ROW][C]3.86678872912941[/C][/ROW]
[ROW][C]-1.54195942012579[/C][/ROW]
[ROW][C]-0.0286617135785812[/C][/ROW]
[ROW][C]0.975569265981577[/C][/ROW]
[ROW][C]-2.88729720996113[/C][/ROW]
[ROW][C]-0.963691955102135[/C][/ROW]
[ROW][C]-1.07107438040979[/C][/ROW]
[ROW][C]0.856981784271256[/C][/ROW]
[/TABLE]
Source: https://freestatistics.org/blog/index.php?pk=166404&T=2

Globally Unique Identifier (entire table): ba.freestatistics.org/blog/index.php?pk=166404&T=2

As an alternative you can also use a QR Code:  

The GUIDs for individual cells are displayed in the table below:

Estimated ARIMA Residuals
Value
0.143834818248342
2.13507276404364
-1.36488007242248
-0.289634018156677
1.86921363138622
2.94680561718968
-1.10349491846618
-1.06216399968299
1.99576638591325
-3.63679641281016
-2.29306086874244
0.990718243688076
5.50096244101465
3.14041054086673
3.30502056624534
-0.00726018503030562
0.372723540975927
-2.24510052647632
0.892239568349886
-0.318126982361361
1.5003139729472
1.12861987956441
-0.09498496398483
-1.20491901630456
0.376024665008545
0.0698899865116491
4.63563005295076
-3.73929977463391
5.23257416253082
-2.52774338043482
-0.98849916178299
2.21347027549843
2.23619558421263
-3.23892588007432
-4.3473442307875
0.427911672785828
0.727755770095941
-0.421967526688686
-1.11169210716728
0.180042488749353
-1.39680913764519
0.913082014182216
-1.40601572228076
-0.700417269668283
-1.03708866481857
2.53751290444386
-1.56293056177311
1.65043029916049
0.876503780356279
-1.13791198205763
-2.80652083025241
1.5874059808773
4.27271579753982
0.891393855664978
-0.126829750519967
3.31612584404167
6.00501061647983
-4.21724919216226
4.57430593711769
-0.255485738612096
-0.258786072103664
3.22475875488443
2.84823492982415
-5.59256400097471
2.6238118867788
1.19494638009981
0.574226744373426
0.914323313981378
4.00546328638062
-3.0057901938455
0.893787324006602
-5.64782156365265
-8.3708284190616
-4.82587021121791
-0.396354138543889
0.562090094685458
0.359772057609957
3.86678872912941
-1.54195942012579
-0.0286617135785812
0.975569265981577
-2.88729720996113
-0.963691955102135
-1.07107438040979
0.856981784271256


Parameters (Session):
par1 = FALSE ; par2 = 1 ; par3 = 0 ; par4 = 1 ; par5 = 4 ; par6 = 3 ; par7 = 0 ; par8 = 2 ; par9 = 1 ;
Parameters (R input):
par1 = FALSE ; par2 = 1 ; par3 = 0 ; par4 = 1 ; par5 = 4 ; par6 = 3 ; par7 = 0 ; par8 = 2 ; par9 = 1 ;
R code (references can be found in the software module):
library(lattice)
if (par1 == 'TRUE') par1 <- TRUE
if (par1 == 'FALSE') par1 <- FALSE
par2 <- as.numeric(par2) #Box-Cox lambda transformation parameter
par3 <- as.numeric(par3) #degree of non-seasonal differencing
par4 <- as.numeric(par4) #degree of seasonal differencing
par5 <- as.numeric(par5) #seasonal period
par6 <- as.numeric(par6) #degree (p) of the non-seasonal AR(p) polynomial
par7 <- as.numeric(par7) #degree (q) of the non-seasonal MA(q) polynomial
par8 <- as.numeric(par8) #degree (P) of the seasonal AR(P) polynomial
par9 <- as.numeric(par9) #degree (Q) of the seasonal MA(Q) polynomial
armaGR <- function(arima.out, names, n){
try1 <- arima.out$coef
try2 <- sqrt(diag(arima.out$var.coef))
try.data.frame <- data.frame(matrix(NA,ncol=4,nrow=length(names)))
dimnames(try.data.frame) <- list(names,c('coef','std','tstat','pv'))
try.data.frame[,1] <- try1
for(i in 1:length(try2)) try.data.frame[which(rownames(try.data.frame)==names(try2)[i]),2] <- try2[i]
try.data.frame[,3] <- try.data.frame[,1] / try.data.frame[,2]
try.data.frame[,4] <- round((1-pt(abs(try.data.frame[,3]),df=n-(length(try2)+1)))*2,5)
vector <- rep(NA,length(names))
vector[is.na(try.data.frame[,4])] <- 0
maxi <- which.max(try.data.frame[,4])
continue <- max(try.data.frame[,4],na.rm=TRUE) > .05
vector[maxi] <- 0
list(summary=try.data.frame,next.vector=vector,continue=continue)
}
arimaSelect <- function(series, order=c(13,0,0), seasonal=list(order=c(2,0,0),period=12), include.mean=F){
nrc <- order[1]+order[3]+seasonal$order[1]+seasonal$order[3]
coeff <- matrix(NA, nrow=nrc*2, ncol=nrc)
pval <- matrix(NA, nrow=nrc*2, ncol=nrc)
mylist <- rep(list(NULL), nrc)
names <- NULL
if(order[1] > 0) names <- paste('ar',1:order[1],sep='')
if(order[3] > 0) names <- c( names , paste('ma',1:order[3],sep='') )
if(seasonal$order[1] > 0) names <- c(names, paste('sar',1:seasonal$order[1],sep=''))
if(seasonal$order[3] > 0) names <- c(names, paste('sma',1:seasonal$order[3],sep=''))
arima.out <- arima(series, order=order, seasonal=seasonal, include.mean=include.mean, method='ML')
mylist[[1]] <- arima.out
last.arma <- armaGR(arima.out, names, length(series))
mystop <- FALSE
i <- 1
coeff[i,] <- last.arma[[1]][,1]
pval [i,] <- last.arma[[1]][,4]
i <- 2
aic <- arima.out$aic
while(!mystop){
mylist[[i]] <- arima.out
arima.out <- arima(series, order=order, seasonal=seasonal, include.mean=include.mean, method='ML', fixed=last.arma$next.vector)
aic <- c(aic, arima.out$aic)
last.arma <- armaGR(arima.out, names, length(series))
mystop <- !last.arma$continue
coeff[i,] <- last.arma[[1]][,1]
pval [i,] <- last.arma[[1]][,4]
i <- i+1
}
list(coeff, pval, mylist, aic=aic)
}
arimaSelectplot <- function(arimaSelect.out,noms,choix){
noms <- names(arimaSelect.out[[3]][[1]]$coef)
coeff <- arimaSelect.out[[1]]
k <- min(which(is.na(coeff[,1])))-1
coeff <- coeff[1:k,]
pval <- arimaSelect.out[[2]][1:k,]
aic <- arimaSelect.out$aic[1:k]
coeff[coeff==0] <- NA
n <- ncol(coeff)
if(missing(choix)) choix <- k
layout(matrix(c(1,1,1,2,
3,3,3,2,
3,3,3,4,
5,6,7,7),nr=4),
widths=c(10,35,45,15),
heights=c(30,30,15,15))
couleurs <- rainbow(75)[1:50]#(50)
ticks <- pretty(coeff)
par(mar=c(1,1,3,1))
plot(aic,k:1-.5,type='o',pch=21,bg='blue',cex=2,axes=F,lty=2,xpd=NA)
points(aic[choix],k-choix+.5,pch=21,cex=4,bg=2,xpd=NA)
title('aic',line=2)
par(mar=c(3,0,0,0))
plot(0,axes=F,xlab='',ylab='',xlim=range(ticks),ylim=c(.1,1))
rect(xleft = min(ticks) + (0:49)/50*(max(ticks)-min(ticks)),
xright = min(ticks) + (1:50)/50*(max(ticks)-min(ticks)),
ytop = rep(1,50),
ybottom= rep(0,50),col=couleurs,border=NA)
axis(1,ticks)
rect(xleft=min(ticks),xright=max(ticks),ytop=1,ybottom=0)
text(mean(coeff,na.rm=T),.5,'coefficients',cex=2,font=2)
par(mar=c(1,1,3,1))
image(1:n,1:k,t(coeff[k:1,]),axes=F,col=couleurs,zlim=range(ticks))
for(i in 1:n) for(j in 1:k) if(!is.na(coeff[j,i])) {
if(pval[j,i]<.01) symb = 'green'
else if( (pval[j,i]<.05) & (pval[j,i]>=.01)) symb = 'orange'
else if( (pval[j,i]<.1) & (pval[j,i]>=.05)) symb = 'red'
else symb = 'black'
polygon(c(i+.5 ,i+.2 ,i+.5 ,i+.5),
c(k-j+0.5,k-j+0.5,k-j+0.8,k-j+0.5),
col=symb)
if(j==choix) {
rect(xleft=i-.5,
xright=i+.5,
ybottom=k-j+1.5,
ytop=k-j+.5,
lwd=4)
text(i,
k-j+1,
round(coeff[j,i],2),
cex=1.2,
font=2)
}
else{
rect(xleft=i-.5,xright=i+.5,ybottom=k-j+1.5,ytop=k-j+.5)
text(i,k-j+1,round(coeff[j,i],2),cex=1.2,font=1)
}
}
axis(3,1:n,noms)
par(mar=c(0.5,0,0,0.5))
plot(0,axes=F,xlab='',ylab='',type='n',xlim=c(0,8),ylim=c(-.2,.8))
cols <- c('green','orange','red','black')
niv <- c('0','0.01','0.05','0.1')
for(i in 0:3){
polygon(c(1+2*i ,1+2*i ,1+2*i-.5 ,1+2*i),
c(.4 ,.7 , .4 , .4),
col=cols[i+1])
text(2*i,0.5,niv[i+1],cex=1.5)
}
text(8,.5,1,cex=1.5)
text(4,0,'p-value',cex=2)
box()
residus <- arimaSelect.out[[3]][[choix]]$res
par(mar=c(1,2,4,1))
acf(residus,main='')
title('acf',line=.5)
par(mar=c(1,2,4,1))
pacf(residus,main='')
title('pacf',line=.5)
par(mar=c(2,2,4,1))
qqnorm(residus,main='')
title('qq-norm',line=.5)
qqline(residus)
residus
}
if (par2 == 0) x <- log(x)
if (par2 != 0) x <- x^par2
(selection <- arimaSelect(x, order=c(par6,par3,par7), seasonal=list(order=c(par8,par4,par9), period=par5)))
bitmap(file='test1.png')
resid <- arimaSelectplot(selection)
dev.off()
resid
bitmap(file='test2.png')
acf(resid,length(resid)/2, main='Residual Autocorrelation Function')
dev.off()
bitmap(file='test3.png')
pacf(resid,length(resid)/2, main='Residual Partial Autocorrelation Function')
dev.off()
bitmap(file='test4.png')
cpgram(resid, main='Residual Cumulative Periodogram')
dev.off()
bitmap(file='test5.png')
hist(resid, main='Residual Histogram', xlab='values of Residuals')
dev.off()
bitmap(file='test6.png')
densityplot(~resid,col='black',main='Residual Density Plot', xlab='values of Residuals')
dev.off()
bitmap(file='test7.png')
qqnorm(resid, main='Residual Normal Q-Q Plot')
qqline(resid)
dev.off()
ncols <- length(selection[[1]][1,])
nrows <- length(selection[[2]][,1])-1
load(file='createtable')
a<-table.start()
a<-table.row.start(a)
a<-table.element(a,'ARIMA Parameter Estimation and Backward Selection', ncols+1,TRUE)
a<-table.row.end(a)
a<-table.row.start(a)
a<-table.element(a,'Iteration', header=TRUE)
for (i in 1:ncols) {
a<-table.element(a,names(selection[[3]][[1]]$coef)[i],header=TRUE)
}
a<-table.row.end(a)
for (j in 1:nrows) {
a<-table.row.start(a)
mydum <- 'Estimates ('
mydum <- paste(mydum,j)
mydum <- paste(mydum,')')
a<-table.element(a,mydum, header=TRUE)
for (i in 1:ncols) {
a<-table.element(a,round(selection[[1]][j,i],4))
}
a<-table.row.end(a)
a<-table.row.start(a)
a<-table.element(a,'(p-val)', header=TRUE)
for (i in 1:ncols) {
mydum <- '('
mydum <- paste(mydum,round(selection[[2]][j,i],4),sep='')
mydum <- paste(mydum,')')
a<-table.element(a,mydum)
}
a<-table.row.end(a)
}
a<-table.end(a)
table.save(a,file='mytable.tab')
a<-table.start()
a<-table.row.start(a)
a<-table.element(a,'Estimated ARIMA Residuals', 1,TRUE)
a<-table.row.end(a)
a<-table.row.start(a)
a<-table.element(a,'Value', 1,TRUE)
a<-table.row.end(a)
for (i in (par4*par5+par3):length(resid)) {
a<-table.row.start(a)
a<-table.element(a,resid[i])
a<-table.row.end(a)
}
a<-table.end(a)
table.save(a,file='mytable1.tab')