Free Statistics
of Irreproducible Research!
Description of Statistical Computation | |||||||||||||||||||||||||||||||||||||||||
|---|---|---|---|---|---|---|---|---|---|---|---|---|---|---|---|---|---|---|---|---|---|---|---|---|---|---|---|---|---|---|---|---|---|---|---|---|---|---|---|---|---|
| Author's title | |||||||||||||||||||||||||||||||||||||||||
| Author | *Unverified author* | ||||||||||||||||||||||||||||||||||||||||
| R Software Module | rwasp_univariatedataseries.wasp | ||||||||||||||||||||||||||||||||||||||||
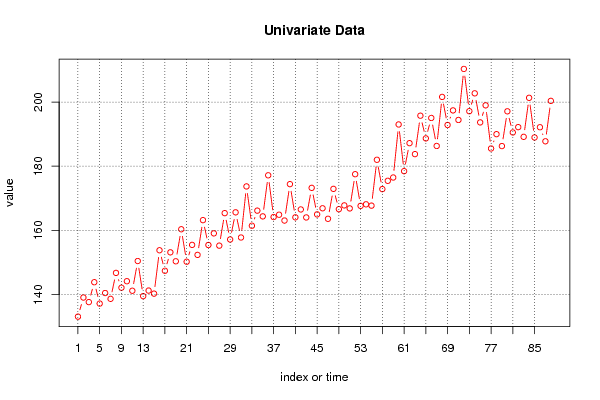
| Title produced by software | Univariate Data Series | ||||||||||||||||||||||||||||||||||||||||
| Date of computation | Fri, 11 May 2012 07:23:57 -0400 | ||||||||||||||||||||||||||||||||||||||||
| Cite this page as follows | Statistical Computations at FreeStatistics.org, Office for Research Development and Education, URL https://freestatistics.org/blog/index.php?v=date/2012/May/11/t1336735505k958wv9dckg6hik.htm/, Retrieved Mon, 29 Apr 2024 13:49:16 +0000 | ||||||||||||||||||||||||||||||||||||||||
| Statistical Computations at FreeStatistics.org, Office for Research Development and Education, URL https://freestatistics.org/blog/index.php?pk=166403, Retrieved Mon, 29 Apr 2024 13:49:16 +0000 | |||||||||||||||||||||||||||||||||||||||||
| QR Codes: | |||||||||||||||||||||||||||||||||||||||||
|
| |||||||||||||||||||||||||||||||||||||||||
| Original text written by user: | |||||||||||||||||||||||||||||||||||||||||
| IsPrivate? | No (this computation is public) | ||||||||||||||||||||||||||||||||||||||||
| User-defined keywords | |||||||||||||||||||||||||||||||||||||||||
| Estimated Impact | 167 | ||||||||||||||||||||||||||||||||||||||||
Tree of Dependent Computations | |||||||||||||||||||||||||||||||||||||||||
| Family? (F = Feedback message, R = changed R code, M = changed R Module, P = changed Parameters, D = changed Data) | |||||||||||||||||||||||||||||||||||||||||
| - [Univariate Data Series] [] [2012-05-11 11:23:57] [d41d8cd98f00b204e9800998ecf8427e] [Current] - RMP [ARIMA Backward Selection] [model1] [2012-05-11 11:32:48] [b98453cac15ba1066b407e146608df68] - RMP [ARIMA Backward Selection] [model2] [2012-05-11 11:34:41] [b98453cac15ba1066b407e146608df68] - RMP [ARIMA Forecasting] [forecast model1] [2012-05-11 11:37:09] [b98453cac15ba1066b407e146608df68] - RMP [ARIMA Forecasting] [forecast model2] [2012-05-11 11:38:23] [b98453cac15ba1066b407e146608df68] | |||||||||||||||||||||||||||||||||||||||||
| Feedback Forum | |||||||||||||||||||||||||||||||||||||||||
Post a new message | |||||||||||||||||||||||||||||||||||||||||
Dataset | |||||||||||||||||||||||||||||||||||||||||
| Dataseries X: | |||||||||||||||||||||||||||||||||||||||||
133.105 139.066 137.645 143.836 137.175 140.47 138.662 146.738 142.133 144.151 141.176 150.444 139.494 141.234 140.273 153.8 147.401 153.157 150.366 160.347 150.227 155.468 152.358 163.189 155.438 159.07 155.232 165.366 157.161 165.623 157.775 173.696 161.44 166.145 164.361 177.168 164.15 164.869 163.064 174.409 164.062 166.523 164.027 173.251 164.983 166.886 163.6 172.94 166.603 167.785 166.85 177.504 167.63 168.123 167.705 181.996 172.861 175.444 176.473 193.009 178.455 187.177 183.767 195.74 188.674 195.03 186.305 201.588 192.843 197.391 194.408 210.311 197.148 202.714 193.651 198.97 185.515 189.982 186.276 197.11 190.522 192.175 189.153 201.316 188.959 192.146 187.763 200.365 | |||||||||||||||||||||||||||||||||||||||||
Tables (Output of Computation) | |||||||||||||||||||||||||||||||||||||||||
| |||||||||||||||||||||||||||||||||||||||||
Figures (Output of Computation) | |||||||||||||||||||||||||||||||||||||||||
Input Parameters & R Code | |||||||||||||||||||||||||||||||||||||||||
| Parameters (Session): | |||||||||||||||||||||||||||||||||||||||||
| par1 = Private consumption (quarterly) ; par2 = Denmark Stastistics ; par3 = Quarterly private consumption from 1990-2011 (mia. krones) ; par4 = 4 ; | |||||||||||||||||||||||||||||||||||||||||
| Parameters (R input): | |||||||||||||||||||||||||||||||||||||||||
| par1 = Private consumption (quarterly) ; par2 = Denmark Stastistics ; par3 = Quarterly private consumption from 1990-2011 (mia. krones) ; par4 = 4 ; | |||||||||||||||||||||||||||||||||||||||||
| R code (references can be found in the software module): | |||||||||||||||||||||||||||||||||||||||||
if (par4 != 'No season') { | |||||||||||||||||||||||||||||||||||||||||