| Multiple Linear Regression - Estimated Regression Equation |
| TimIN[t] = + 34121.5084063352 -0.807427860863971Date[t] -11.3252963352218Precip[t] + 0.911552314296925Temp[t] + e[t] |
| Multiple Linear Regression - Ordinary Least Squares | |||||
| Variable | Parameter | S.D. | T-STAT H0: parameter = 0 | 2-tail p-value | 1-tail p-value |
| (Intercept) | 34121.5084063352 | 8192.904762 | 4.1648 | 0.000242 | 0.000121 |
| Date | -0.807427860863971 | 0.200673 | -4.0236 | 0.000358 | 0.000179 |
| Precip | -11.3252963352218 | 4.983501 | -2.2726 | 0.030383 | 0.015191 |
| Temp | 0.911552314296925 | 0.352712 | 2.5844 | 0.014865 | 0.007433 |
| Multiple Linear Regression - Regression Statistics | |
| Multiple R | 0.811194587523697 |
| R-squared | 0.658036658827741 |
| Adjusted R-squared | 0.623840324710515 |
| F-TEST (value) | 19.2429006153693 |
| F-TEST (DF numerator) | 3 |
| F-TEST (DF denominator) | 30 |
| p-value | 3.77429111408922e-07 |
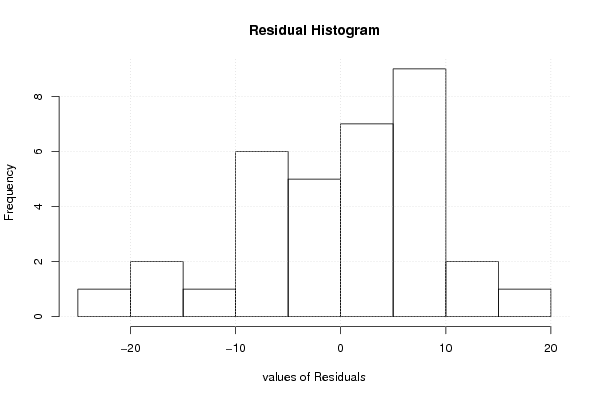
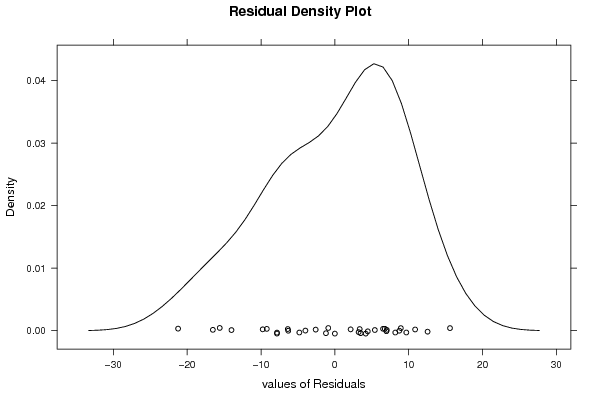
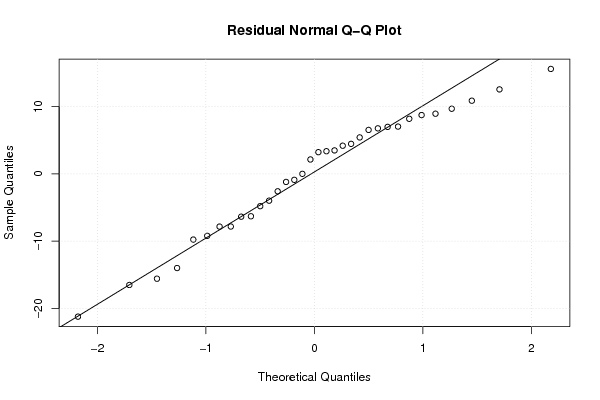
| Multiple Linear Regression - Residual Statistics | |
| Residual Standard Deviation | 9.52638661164102 |
| Sum Squared Residuals | 2722.5612562336 |
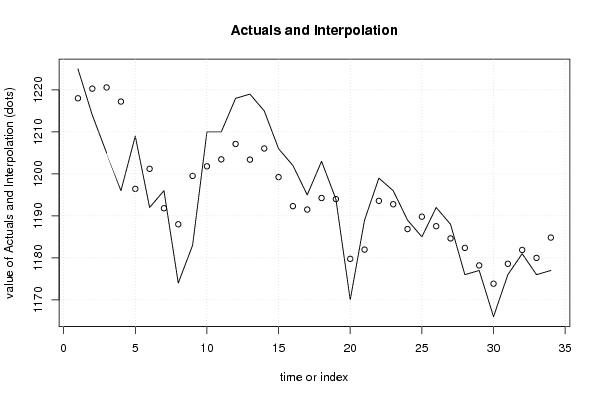
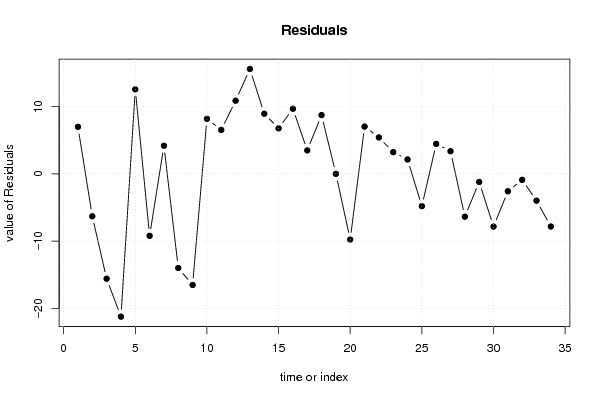
| Multiple Linear Regression - Actuals, Interpolation, and Residuals | |||
| Time or Index | Actuals | Interpolation Forecast | Residuals Prediction Error |
| 1 | 1225 | 1218.01379488043 | 6.98620511957144 |
| 2 | 1214 | 1220.3056448882 | -6.30564488819599 |
| 3 | 1205 | 1220.59207980449 | -15.5920798044883 |
| 4 | 1196 | 1217.23230546359 | -21.232305463593 |
| 5 | 1209 | 1196.43983428169 | 12.5601657183136 |
| 6 | 1192 | 1201.21492317597 | -9.21492317597361 |
| 7 | 1196 | 1191.81685592278 | 4.18314407722141 |
| 8 | 1174 | 1188.00130542473 | -14.0013054247348 |
| 9 | 1183 | 1199.52188144482 | -16.5218814448192 |
| 10 | 1210 | 1201.81373145256 | 8.18626854743519 |
| 11 | 1210 | 1203.4674948403 | 6.53250515969746 |
| 12 | 1218 | 1207.12667331949 | 10.8733266805065 |
| 13 | 1219 | 1203.40227805288 | 15.5977219471206 |
| 14 | 1215 | 1206.05874898634 | 8.94125101365628 |
| 15 | 1206 | 1199.23507585112 | 6.76492414887996 |
| 16 | 1202 | 1192.32024748447 | 9.67975251553333 |
| 17 | 1195 | 1191.5128196236 | 3.4871803763973 |
| 18 | 1203 | 1194.2604457885 | 8.73955421150326 |
| 19 | 1194 | 1193.99994931621 | 5.06837890774059e-05 |
| 20 | 1170 | 1179.77065479724 | -9.77065479724219 |
| 21 | 1189 | 1181.97134957356 | 7.02865042644192 |
| 22 | 1199 | 1193.58308082507 | 5.41691917492776 |
| 23 | 1196 | 1192.77565296421 | 3.22434703579173 |
| 24 | 1189 | 1186.86353214328 | 2.13646785671848 |
| 25 | 1185 | 1189.80643799304 | -4.8064379930382 |
| 26 | 1192 | 1187.5405264293 | 4.45947357070084 |
| 27 | 1188 | 1184.63652824555 | 3.36347175444774 |
| 28 | 1176 | 1182.37061668181 | -6.3706166818132 |
| 29 | 1177 | 1178.20341448005 | -1.20341448005387 |
| 30 | 1166 | 1173.84093259343 | -7.84093259343189 |
| 31 | 1176 | 1178.59397384978 | -2.59397384977917 |
| 32 | 1181 | 1181.88853140325 | -0.888531403251357 |
| 33 | 1176 | 1179.98724076523 | -3.98724076523107 |
| 34 | 1177 | 1184.83143725301 | -7.83143725300804 |
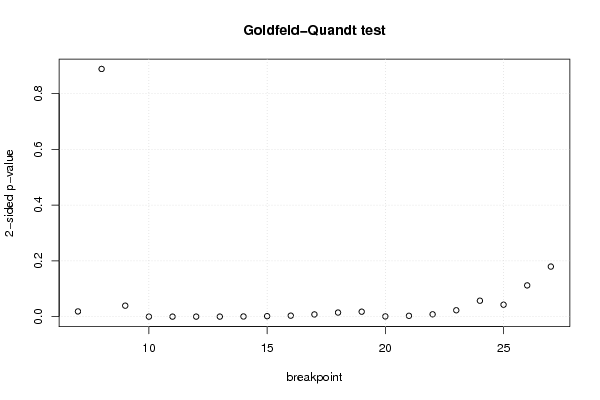
| Goldfeld-Quandt test for Heteroskedasticity | |||
| p-values | Alternative Hypothesis | ||
| breakpoint index | greater | 2-sided | less |
| 7 | 0.00939174904738038 | 0.0187834980947608 | 0.99060825095262 |
| 8 | 0.444038318450007 | 0.888076636900013 | 0.555961681549993 |
| 9 | 0.980298481778986 | 0.0394030364420272 | 0.0197015182210136 |
| 10 | 0.999960917931299 | 7.8164137401243e-05 | 3.90820687006215e-05 |
| 11 | 0.999963925491332 | 7.21490173365206e-05 | 3.60745086682603e-05 |
| 12 | 0.999911032245317 | 0.000177935509365692 | 8.89677546828458e-05 |
| 13 | 0.999879057083546 | 0.000241885832908931 | 0.000120942916454466 |
| 14 | 0.999657639866083 | 0.000684720267833593 | 0.000342360133916797 |
| 15 | 0.999088200518482 | 0.00182359896303542 | 0.000911799481517709 |
| 16 | 0.998207420484983 | 0.0035851590300336 | 0.0017925795150168 |
| 17 | 0.995940697433611 | 0.00811860513277837 | 0.00405930256638919 |
| 18 | 0.992609632408777 | 0.0147807351824465 | 0.00739036759122324 |
| 19 | 0.991094895507681 | 0.0178102089846374 | 0.00890510449231869 |
| 20 | 0.99953306184675 | 0.000933876306500882 | 0.000466938153250441 |
| 21 | 0.998472218537406 | 0.00305556292518744 | 0.00152778146259372 |
| 22 | 0.99575096531462 | 0.00849806937075942 | 0.00424903468537971 |
| 23 | 0.988525614471415 | 0.0229487710571698 | 0.0114743855285849 |
| 24 | 0.971382097806336 | 0.0572358043873283 | 0.0286179021936642 |
| 25 | 0.978592715840258 | 0.0428145683194839 | 0.0214072841597419 |
| 26 | 0.943921709237606 | 0.112156581524788 | 0.0560782907623938 |
| 27 | 0.910213273348722 | 0.179573453302555 | 0.0897867266512775 |
| Meta Analysis of Goldfeld-Quandt test for Heteroskedasticity | |||
| Description | # significant tests | % significant tests | OK/NOK |
| 1% type I error level | 11 | 0.523809523809524 | NOK |
| 5% type I error level | 17 | 0.80952380952381 | NOK |
| 10% type I error level | 18 | 0.857142857142857 | NOK |