| Multiple Linear Regression - Estimated Regression Equation |
| TimIN[t] = -262.050387124644 + 0.533838453356457Sunset[t] + 0.0203959280203797Date[t] -0.453922028780611Humidity[t] + 1.19679108229863Dewpoint[t] + e[t] |
| Multiple Linear Regression - Ordinary Least Squares | |||||
| Variable | Parameter | S.D. | T-STAT H0: parameter = 0 | 2-tail p-value | 1-tail p-value |
| (Intercept) | -262.050387124644 | 493.105884 | -0.5314 | 0.599169 | 0.299585 |
| Sunset | 0.533838453356457 | 0.138394 | 3.8574 | 0.000588 | 0.000294 |
| Date | 0.0203959280203797 | 0.010056 | 2.0282 | 0.051814 | 0.025907 |
| Humidity | -0.453922028780611 | 0.111542 | -4.0695 | 0.000331 | 0.000166 |
| Dewpoint | 1.19679108229863 | 0.425125 | 2.8152 | 0.008673 | 0.004336 |
| Multiple Linear Regression - Regression Statistics | |
| Multiple R | 0.813780190055558 |
| R-squared | 0.662238197726861 |
| Adjusted R-squared | 0.615650362930565 |
| F-TEST (value) | 14.2148309880142 |
| F-TEST (DF numerator) | 4 |
| F-TEST (DF denominator) | 29 |
| p-value | 1.54974100674554e-06 |
| Multiple Linear Regression - Residual Statistics | |
| Residual Standard Deviation | 9.62953512885713 |
| Sum Squared Residuals | 2689.11045713891 |
| Multiple Linear Regression - Actuals, Interpolation, and Residuals | |||
| Time or Index | Actuals | Interpolation Forecast | Residuals Prediction Error |
| 1 | 1225 | 1216.71323485808 | 8.28676514191853 |
| 2 | 1214 | 1219.90125886294 | -5.90125886294268 |
| 3 | 1205 | 1220.02597456241 | -15.0259745624099 |
| 4 | 1196 | 1216.55393456039 | -20.5539345603948 |
| 5 | 1209 | 1199.80915198256 | 9.19084801743708 |
| 6 | 1192 | 1193.80667905786 | -1.80667905786333 |
| 7 | 1196 | 1198.82707662235 | -2.82707662234768 |
| 8 | 1174 | 1186.48820239236 | -12.4882023923605 |
| 9 | 1183 | 1189.15221406849 | -6.15221406848868 |
| 10 | 1210 | 1196.51488782431 | 13.4851121756931 |
| 11 | 1210 | 1198.39502746357 | 11.604972536432 |
| 12 | 1218 | 1196.03127629435 | 21.968723705653 |
| 13 | 1219 | 1207.13259877129 | 11.8674012287117 |
| 14 | 1215 | 1211.96704297476 | 3.03295702523582 |
| 15 | 1206 | 1202.22086023682 | 3.77913976317648 |
| 16 | 1202 | 1196.46536828287 | 5.53463171713484 |
| 17 | 1195 | 1194.66759549637 | 0.332404503626893 |
| 18 | 1203 | 1197.62017248004 | 5.37982751996342 |
| 19 | 1194 | 1193.87120560818 | 0.128794391815823 |
| 20 | 1170 | 1189.40236111394 | -19.4023611139439 |
| 21 | 1189 | 1189.95028016863 | -0.950280168625818 |
| 22 | 1199 | 1191.20169665044 | 7.79830334956049 |
| 23 | 1196 | 1196.94178154113 | -0.941781541134477 |
| 24 | 1189 | 1186.70620700322 | 2.29379299677648 |
| 25 | 1185 | 1191.92827922707 | -6.92827922707024 |
| 26 | 1192 | 1191.33186766439 | 0.668132335611023 |
| 27 | 1188 | 1185.0110831693 | 2.98891683069902 |
| 28 | 1176 | 1181.3201864425 | -5.32018644250062 |
| 29 | 1177 | 1180.23168308858 | -3.23168308858497 |
| 30 | 1166 | 1172.86411423573 | -6.86411423572638 |
| 31 | 1176 | 1173.84661306444 | 2.15338693556414 |
| 32 | 1181 | 1181.04222227409 | -0.0422222740886662 |
| 33 | 1176 | 1173.13319221359 | 2.86680778640789 |
| 34 | 1177 | 1181.92466974294 | -4.92466974293498 |
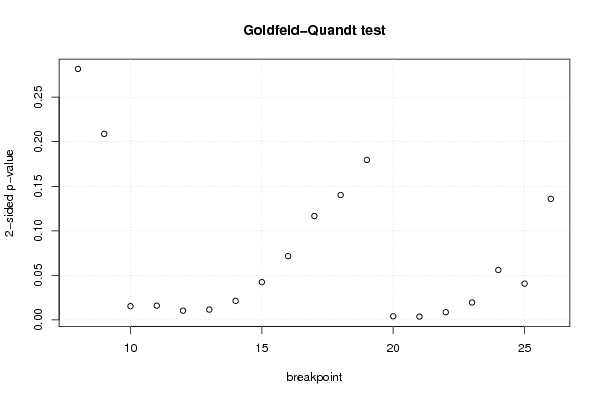
| Goldfeld-Quandt test for Heteroskedasticity | |||
| p-values | Alternative Hypothesis | ||
| breakpoint index | greater | 2-sided | less |
| 8 | 0.859121179109051 | 0.281757641781898 | 0.140878820890949 |
| 9 | 0.895575587298455 | 0.208848825403091 | 0.104424412701545 |
| 10 | 0.992359983490367 | 0.015280033019265 | 0.00764001650963249 |
| 11 | 0.992062979164831 | 0.0158740416703381 | 0.00793702083516903 |
| 12 | 0.994876765685182 | 0.0102464686296369 | 0.00512323431481843 |
| 13 | 0.994252060608544 | 0.0114958787829128 | 0.00574793939145642 |
| 14 | 0.989341546847141 | 0.0213169063057173 | 0.0106584531528586 |
| 15 | 0.978846885428418 | 0.0423062291431645 | 0.0211531145715822 |
| 16 | 0.964243242847231 | 0.0715135143055387 | 0.0357567571527694 |
| 17 | 0.941717766728965 | 0.116564466542071 | 0.0582822332710354 |
| 18 | 0.929922225503628 | 0.140155548992744 | 0.0700777744963722 |
| 19 | 0.910215602064095 | 0.179568795871809 | 0.0897843979359046 |
| 20 | 0.998013028058159 | 0.00397394388368274 | 0.00198697194184137 |
| 21 | 0.998221698069194 | 0.00355660386161248 | 0.00177830193080624 |
| 22 | 0.995719865806735 | 0.00856026838652932 | 0.00428013419326466 |
| 23 | 0.990257527000425 | 0.0194849459991494 | 0.00974247299957472 |
| 24 | 0.97202118798092 | 0.0559576240381598 | 0.0279788120190799 |
| 25 | 0.979694758772831 | 0.0406104824543388 | 0.0203052412271694 |
| 26 | 0.93209235338913 | 0.135815293221739 | 0.0679076466108696 |
| Meta Analysis of Goldfeld-Quandt test for Heteroskedasticity | |||
| Description | # significant tests | % significant tests | OK/NOK |
| 1% type I error level | 3 | 0.157894736842105 | NOK |
| 5% type I error level | 11 | 0.578947368421053 | NOK |
| 10% type I error level | 13 | 0.684210526315789 | NOK |